Purpose
To compare choroidal thickness maps of different types of macular edema secondary to branch retinal vein occlusion (BRVO) using swept-source optical coherence tomography (SS OCT).
Design
Retrospective cross-sectional study.
Methods
We generated choroidal thickness maps of 55 eyes of 55 patients with BRVO using the macular volumetric raster scan protocol of the SS OCT. The enrolled eyes were classified into 4 types of macular edema according to the captured OCT images: no macular edema (nME, 13 eyes), cystoid macular edema (CME, 15 eyes), serous retinal detachment (SRD, 12 eyes), and mixed type (CME + SRD, 15 eyes). The data from normal fellow eyes served as the control. Statistical analysis was performed to compare choroidal thickness maps according to the type of macular edema.
Results
The mean choroidal thicknesses in the control, nME, CME, SRD, and mixed-type groups were 205.77 ± 41.65 μm, 211.56 ± 46.34 μm, 214.30 ± 49.21 μm, 249.18 ± 43.51 μm, and 248.05 ± 49.51 μm, respectively. No statistical difference in choroidal thickness was observed among the nME, CME, and control groups, while the SRD and mixed groups showed larger choroidal thickness values than the control group ( P < .001). No topographic feature in the choroidal thickness was observed to vary according to the location of BRVO.
Conclusions
The results suggest the choroidal thickness in BRVO varies according to the type of macular edema. Among the macular edema groups, choroidal thickness was significantly increased in eyes with SRD relative to those without SRD, which suggests that increased choroidal thickness may influence the development of SRD in BRVO.
Macular edema is the leading cause of visual disturbance in branch retinal vein occlusion (BRVO). Macular edema in BRVO occurs because of various pathologic changes, such as intraretinal fluid accumulation, formation of cystoid spaces, subretinal fluid accumulation, and epiretinal membrane formation. To date, optical coherence tomography (OCT) studies in macular edema secondary to BRVO have focused on changes in the retinal layer. After Spaide suggested an enhanced depth imaging spectral-domain OCT for visualization of the choroid, many enhanced depth imaging spectral-domain OCT studies of changes in choroidal thickness in various macular diseases, such as age-related macular degeneration, central serous chorioretinopathy (CSC), and pathologic myopia, have been reported. In contrast, only a few studies have evaluated choroidal thickness in retinal vein occlusion. The enhanced depth imaging OCT used in these studies, however, did not reflect the exact macular choroidal thickness. The choroid is a highly vascularized tissue composed of an anastomosed network of choriocapillaries. The measurement of choroidal thickness at a few sample points, such as subfoveal areas, does not determine the exact choroidal thickness of the entire macula.
Recently developed swept-source OCT uses a longer wavelength of approximately 1000 nm as the light source instead of the light source of spectral-domain OCT, which operates at approximately 800 nm. This longer wavelength enables visualization of the choroid and sclera. The purpose of this study was to generate Early Treatment Diabetic Retinopathy Study (ETDRS)-style choroidal thickness maps of patients with BRVO and compare the choroidal thickness maps of different subtypes of macular edema secondary to BRVO.
Methods and Patients
Patients
This retrospective cross-sectional study design was approved by the Institutional Review Board of Hanyang University Medical Center, Seoul, South Korea. All subjects were screened after a retrospective review of the medical records of patients with naïve BRVO at Hanyang University Medical Center between September 1, 2013 and March 30, 2014. We screened 62 eyes of 62 patients with recent-onset unilateral BRVO (within 4 weeks of symptom onset). All subjects underwent swept-source OCT (DRI-1; Topcon, Tokyo, Japan), as well as comprehensive ophthalmologic examinations, including logarithm of the minimal angle of resolution (logMAR) best-corrected visual acuity (BCVA), refraction, and slit-lamp examination. Additionally, we performed fluorescein angiography (FA) in patients with BRVO. The following criteria were used to select cases with BRVO for this study: (1) naïve BRVO patient; (2) no concomitant retinal disease; (3) refractive errors lower than −6.0 or +6.0 diopters; (4) no history of retinal surgery; and (5) minimal media opacity. The normal fellow eyes of BRVO patients were enrolled as a control group. We also divided BRVO into major and macular BRVO based on previous reports for subgroup analysis. Major BRVO was defined as BRVO involving not only the fovea but also the entire sector of the retina up to the periphery drained by the occluded major branch retinal vein, while macular BRVO was defined as BRVO involving a part of the macular area when one of the macular venules was occluded.
Swept-Source Optical Coherence Tomography Scan Protocol
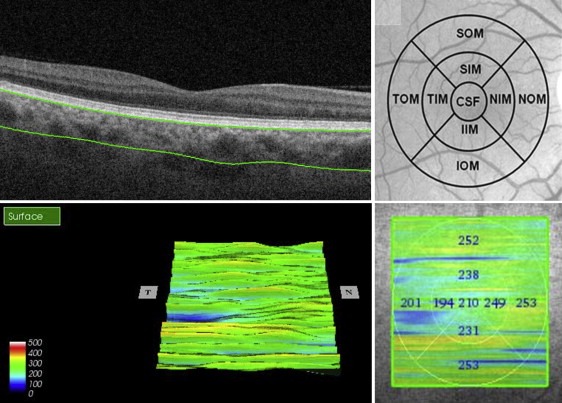
In this study, all enrolled eyes were examined with swept-source OCT using a light source of a wavelength-tunable laser centered at 1050 nm with a 1000-Hz repetition rate. After pupil dilation, 1 well-trained examiner performed the swept-source OCT examinations. To obtain data, the 3D macular volumetric raster scan protocol, which can cover a 6 × 6-mm 2 macular area centered on the fovea, was selected. This protocol can acquire a 3D imaging set consisting of 512 A-scans and 256 B-scans. Eyes with BRVO and normal fellow eyes were both examined ( Figure 1 ).
Classification of Macular Edema and Generation of Choroidal Thickness Maps
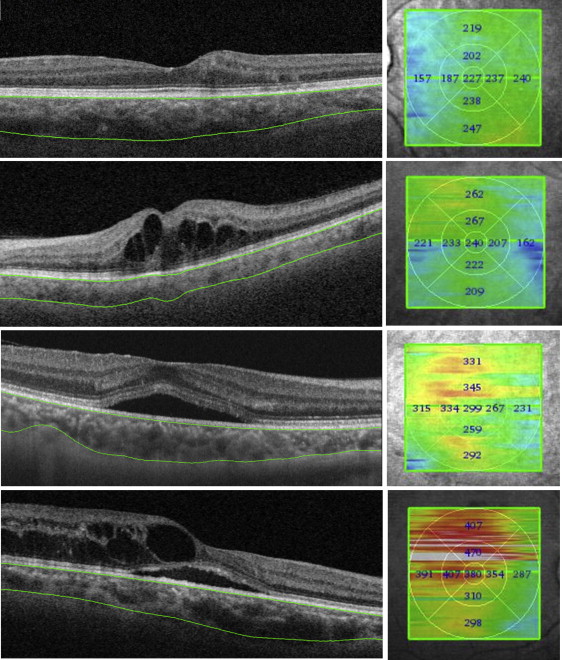
We classified captured OCT images into 4 categories: no macular edema, cystoid macular edema type, serous retinal detachment type, and cystoid macular edema with serous retinal detachment (mixed) type ( Figure 2 ). The choroidal thickness was defined as the distance between the outer border of the retinal pigment epithelium and the chorioscleral junction. An ETDRS-style topographic map of choroidal thickness was generated automatically by built-in segmentation software. To obtain accurate data, 2 retinal specialists (Y.U.S., B.R.L.) reviewed all of the OCT images independently and modified segmentation lines if there were automated segmentation errors. All values obtained by the 2 readers were averaged for analysis. Statistical analysis was performed using SPSS for Windows software, version 18.0 (SPSS Inc, Chicago, Illinois, USA). Analysis of variance (ANOVA) and Pearson χ 2 tests were used to compare the clinical characteristics in different types of macular edema in BRVO, and the Mann-Whitney test was used to compare the choroidal thickness maps by subtype of macular edema. Interobserver repeatability was also tested by calculating the intraclass correlation. A P value of .05 or less was considered statistically significant.
Results
We enrolled a total of 55 subjects who met the study criteria. Seven subjects were excluded owing to low OCT image quality (3 eyes), high refractive errors (2 eyes), and concomitant retinal diseases, such as diabetic retinopathy (2 eyes). The type of macular edema was no macular edema in 13 eyes, cystoid macular edema in 15 eyes, serous retinal detachment in 12 eyes, and mixed type in 15 eyes. The mean age was 59.32 ± 10.18 years (range, 39–78 years). Twenty-five patients (45.45%) were male and 30 patients (54.55%) were female. There was no statistically significant difference in BCVA between control eyes (0.04 ± 0.05) and no macular edema type (0.03 ± 0.06), while eyes with macular edema (0.35 ± 0.29) had lower BCVA than control eyes ( P < .001, Mann-Whitney test). There was a high degree of agreement between the 2 observers (high intraclass correlation coefficient from 0.9907 to 0.9996 for all variables, P < .001). A summary of the clinical characteristics of enrolled patients is shown in Table 1 .
| Control (Fellow Eyes) (n = 55) | Macular Edema Group | |||||
|---|---|---|---|---|---|---|
| nME Group (n = 13) | CME Group (n = 15) | SRD Group (n = 12) | Mixed Group (CME + SRD) (n = 15) | P Value | ||
| Mean age (y) | 59.32 ± 10.18 | 54.71 ± 9.88 | 66.86 ± 7.49 | 55.33 ± 4.16 | 57.60 ± 12.34 | .085 a |
| Sex (male/female) | 25/30 | 5/8 | 6/9 | 5/7 | 9/6 | .627 b |
| BCVA (logMAR) | 0.04 ± 0.05 | 0.03 ± 0.06 | 0.32 ±0.27 | 0.35 ± 0.28 | 0.36 ± 0.30 | .022 a |
| Refraction (SE, diopter) | 0.05 ±0.16 | −0.52 ±1.25 | −0.26 ± 1.23 | 0.55 ± 0.42 | 0.11 ± 1.30 | .654 a |
| Location of vein occlusion (superior/inferior) | 9/4 | 9/6 | 8/4 | 9/6 | .944 b | |
| Type (major/macular) | 2/11 | 8/7 | 10/2 | 13/2 | <.001 b | |
Mean Choroidal Thickness According to the Type of Macular Edema
The mean choroidal thickness of the whole macula in eyes with BRVO was 211.56 ± 46.34 μm in the no macular edema group, 214.30 ± 49.21 μm in the cystoid macular edema group, 249.18 ± 43.51 μm in the serous retinal detachment group, and 248.05 ± 49.51 μm in the mixed group ( Figure 3 ). The mean choroidal thickness of normal fellow eyes (control group) was 205.77 ± 41.65 μm. When compared with the mean choroidal thickness of the control group, the serous retinal detachment and mixed groups showed significantly larger choroidal thickness values ( P < .001, P < .001 respectively, Mann-Whitney test), while the no macular edema and cystoid macular edema groups did not ( P = .363, P = .169, respectively, Mann-Whitney test).
Of the BRVO groups, 33 eyes and 22 eyes were classified into major and macular BRVO, respectively ( Table 1 ). The eyes with major BRVO showed serous retinal detachment more commonly than those with macular BRVO ( P < .001, Pearson χ 2 test). The mean choroidal whole macular thickness was 230.98 ± 61.93 μm in eyes with major BRVO and 209.97 ± 43.02 μm in eyes with macular BRVO, which was a statistically significant difference ( P = .041, Mann-Whitney U test).
Overall, BRVO eyes with serous retinal detachment (serous retinal detachment or mixed groups) showed larger choroidal thickness values than BRVO eyes without serous retinal detachment (no macular edema or cystoid macular edema group) (247.52 ± 38.91 μm and 212.79 ± 52.23 μm, respectively, P < .001, Mann-Whitney test).
Topography of Choroidal Thickness in Eyes With Branch Retinal Vein Occlusion
The trend of the mean choroidal thickness of the central subfield in BRVO patients was the same as that of the whole macular choroidal thickness. The mean choroidal thickness of the central subfield was 224.75 ± 47.91 μm in the control group. When compared with the mean central subfield choroidal thickness of the control group, the serous retinal detachment (272.44 ± 31.48 μm) and mixed groups (277.20 ± 24.39 μm) showed significantly larger central subfield choroidal thickness values ( P = .027, P < .001, respectively, Mann-Whitney test), while the no macular edema (215.82 ± 34.65 μm) and cystoid macular edema groups (215.82 ± 34.65 μm) did not ( P = .661, P = .709, respectively, Mann-Whitney test) ( Table 2 ).
Stay updated, free articles. Join our Telegram channel

Full access? Get Clinical Tree


