Purpose
To compare choroidal thickness of different areas on swept-source optical coherence tomography (SSOCT) line and cube scans for their interchangeable use.
Design
Validity analysis.
Methods
SSOCT line and cube scans were obtained from 21 patients with various choroidal thicknesses. Subfoveal center point choroidal thickness, mean central millimeter choroidal thickness, and mean 6-mm-area choroidal thicknesses were obtained from both eyes by 2 independent graders in a reading center setting. Cross-correlations were performed using Passing and Bablok regression models. A 95% confidence interval of slope that included 1 was considered to indicate no significant difference. Average choroidal thickness of center point, Early Treatment Diabetic Retinopathy Study grid subfields, and total grid area of 6 mm on both scans and the correlation between different areas served as main outcome measures.
Results
No significant difference between line scans/corresponding subfields of cube scans (outer nasal 0.92–1.11, inner nasal 0.88–1.06, central 0.94–1.11, inner temporal 0.95–1.12, outer temporal 0.93–1.17). No significant difference between subfoveal center point measurement/mean of choroidal thickness in the central millimeter of cube scans (0.89–1.08). Significant difference of subfoveal center point measurement or mean of central millimeter area of cube scans to entire 6-mm area of cube scans (1.01–1.53 and 1.03–1.38).
Conclusions
Measurements on a single SSOCT horizontal line scan can represent the entire choroid but subfoveal center point measurements are only indicative for the central millimeter area. There is a consistent overestimation of choroidal thickness when trying to estimate overall choroidal thickness from any central measurement.
Choroidal thickness was first measured in vivo by ultrasound more than 3 decades ago. The measurements were inaccurate and small changes could not be detected. Optical coherence tomography (OCT) is the most frequently used imaging technique in ophthalmology today, and its continuous technical advances have allowed imaging not only of the retina but also of the choroid. With enhanced-depth imaging and long-wavelength OCT at 1050-nm, the choroid can now be assessed in vivo to its full extent and with high accuracy for the first time.
The choroid is a vascular layer with many functions in healthy and diseased eyes, including regulating temperature and intraocular pressure. Its most important function is to supply the outer retina with oxygen and nutrients. The foveal avascular zone of the choroid is the primary source of nutrients. Choroidal thickness is variable and many studies have shown factors that influence choroidal thickness. Age has the greatest influence—the older we get, the more the choroid thins. Women have a thinner choroid than men, and axial length is also a known influence factor (the greater the axial length, the thinner the choroid). Environmental factors that affect choroidal thickness, such as drinking coffee, smoking, and even drinking more than 1000 mL of water in less than 1 hour, have been identified. Blood pressure, eye pressure, and hypercholesterolemia are other possible influences. All these factors generate the need for an easy, manageable scanning and evaluation protocol for the choroid.
Many earlier studies measured subfoveal choroidal thickness at a single point in order to evaluate the degree of choroidal thinning as a sign for choroidal disease involvement. But, unlike the retina, which is known to have a different layer structure at the fovea, there is no evidence that subfoveal choroidal thickness is sufficient for drawing conclusions about the entire choroid. On the one hand, new OCT technologies allow us to image more than 1 B-scan at the foveal center and to evaluate more than 1 single subfoveal point. On the other hand, manual evaluation is time-consuming and automatic analyses need to be validated first. Therefore, there is a need for a scanning protocol that allows conclusions of the highest possible validity and covers a larger area of the choroid and that is also applicable for daily clinical use.
To date, the only marketed swept-source 1050-nm OCT device has a standard protocol of 256 × 256 scans. This protocol results in 65 536 scanning and evaluation points, which is too many to be feasible for manual evaluation and thus excludes clinical use. An automated analysis of the choroid where more evaluation points increase accuracy of an algorithm is currently not available in clinical practice. Therefore manual segmentation remains necessary.
Compared with the standard protocol of 256 × 256 scans, single B-scans are easy to obtain with a shorter acquisition and post-processing analysis time than for the cube scan. Manual segmentation of 1 or 2 single B-scans (horizontal and/or vertical) is not very time-consuming and is therefore feasible in clinical practice. Hence, many studies that analyzed choroidal thickness in the past used single-point measurements to draw conclusions for the entire choroid. In our study we aimed to evaluate if a line scan can represent the entire cube scan area and the subareas for which they can serve as valid predictors.
Methods
Study Design, Participants and Optical Coherence Tomography Examination
The presented study is a prospectively designed validity analysis study that was approved by the ethics committee of the Medical University of Vienna. OCT scans were all obtained from patients attending the uveitis outpatient clinic of the Department of Ophthalmology at the Medical University of Vienna. A high spread of different choroidal thicknesses could be expected in these patients. Images were taken according to a predefined imaging protocol to guarantee a standardized procedure. All participating patients gave informed consent prior to the study and the study adhered to the tenets of the Declaration of Helsinki and the standards of Good Scientific Practice of the Medical University of Vienna.
Inclusion criteria were patients over 18 years of age, no pregnancy, and the presence of an acute or chronic stage of uveitis of any form. All patients were imaged once with a DRI-1, Atlantis Swept-Source OCT (Topcon, Tokyo, Japan) operating at a 1050-nm wavelength. Exclusion criteria were ocular opacity due to cataract, vitreous opacification or corneal opacities that might lead to poor image quality that prevents evaluation of the choroid, and poor visual acuity precluding fixation during the OCT examination.
OCT images were obtained from each patient after a full ophthalmologic examination including visual acuity testing, eye pressure measurement with Goldmann applanation tonometry, and fundus biomicroscopy in fully dilated pupils. The scanning protocol used was a 12 × 9-mm macular wide-field cube scan with 256 × 256 scanning points and a pseudo-averaging of 3 scans (averaging of each B-scan with 2 consecutive B-scans [previous and next B-scan]) and a 12-mm horizontal line scan at the foveal center point with a real averaging mode of 96 scans.
The main outcome measures were the average choroidal thickness of the center point, Early Treatment Diabetic Retinopathy Study (ETDRS) grid subfields and entire ETDRS grid area of 6 mm of the line and cube scans, and the correlation between different areas.
Standardized Image Evaluation
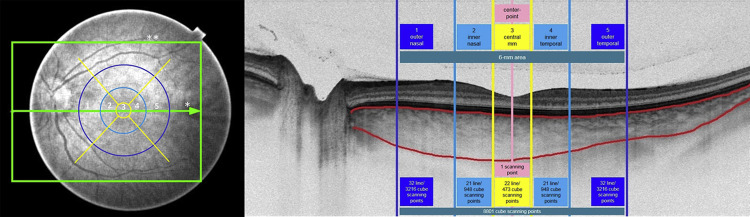
All scans were exported, saved in the database of the Vienna Reading Center (VRC), and analyzed with custom VRC software by an experienced VRC grader. An ETDRS grid was positioned at the foveal center point in line and cube scans. The B-scan position of the line scan was compared to the B-scan of the cube scans that contains the center point, and if the line scan did not hit the foveal center point the eye was excluded from the study. The software automatically showed the inner and outer choroidal border of the choroid using an automatic algorithm validated by the VRC. This was used as the starting point for choroidal delineation in the line scans. The 2 borders comprising the choroid were delineated with the highest possible accuracy. As a last step, choroidal thickness in the ETDRS “fields” outer nasal, inner nasal, center, inner temporal, and outer temporal was calculated. The annotated B-scan had a length of 12 mm (256 scanning points), of which 6 mm (128 scanning points) were used in the ETDRS grid. Therefore, each millimeter of the ETDRS grid comprised 21 or 22 (128/6) scanning points. This means for our automated calculations that after segmentation correction of the line scan, mean choroidal thickness was automatically calculated by the software from 32 scanning points in the outer nasal and outer temporal, 21 scanning points from the inner nasal and inner temporal, and 22 scanning points from the central millimeter choroidal thickness. In many cases no segmentation adjustment was necessary, as the segmentation performed very well. If it had to be adjusted, the segmentation correction of each line scan took only a few seconds; the images were very clear and the choroid could be well delineated, as the image was averaged from 96 B-scans of the same location. Line scans where a full delineation of the 6-mm area was not possible owing to poor image quality were excluded from the analysis.
The cube scan was analyzed by manual inspection of each result of the automatic choroidal delineation. If large errors (deviation of >10% of total choroidal thickness or deviation of more than 1 mm length on any B-scan) were present, the scans were excluded from the study. A deviation of >10% was chosen because this is about the reported 95% confidence interval of a choroidal thickness in a healthy population. Smaller errors were manually corrected, a time-consuming procedure because of the large number of B-scans and the worse resolution compared to the line scan, as the cube scans are not averaged. Automatically calculated thickness values for each ETDRS subfield were also noted from the cube scan areas. The 12 × 9-mm cube scan comprised 256 × 256 (65 536) scanning points. Therefore, each subfield comprised the following scanning points (number of A-scans): 473 scanning points (central millimeter), 948 scanning points (inner nasal and temporal), and 3216 scanning points (outer nasal and temporal), which were used for the automated calculation of the choroidal thickness values by the software.
As a last step, the choroidal thickness value of a single-point subfoveal measurement at the center point was noted as a value from a single measurement point from the cube and line scans (manual measurement of orthogonal line measurement between delineated choroidal boarders of line scans or of scan through center point in cube scans; see Figure 1 for choroidal borders and position of center point measurement). The value of the “mean” choroidal thickness in the entire 6-mm area of the cube scan was calculated by using the known number of points in each subfield, as described in the paragraph above.
The same trained and experienced grader from the VRC analyzed the scans in random order. To guarantee high quality, all data were checked by a second expert grader and if discrepancies appeared the graders reached agreement by analyzing the scans again together.
Examples to show line and cube scan choroidal thickness calculations and ETDRS subfields on a representative fundus image showing the position of a 12-mm line scan and a 12 × 9-mm cube scan and the ETDRS subfields, as well as a representative B-scan showing the choroidal thickness calculation on a line scan, are given in Figure 1 . Figure 1 also gives an overview of the number of scanning points in each subfield. All scanning points (A-scans) on the line in each ETDRS subfield were averaged into 1 line scan subfield value. All scanning points (A-scans) on the several B-scans of the cube scan crossing each ETDRS subfield were averaged into 1 cube scan subfield value. Thus, each of the subfields comprises a certain number of scanning points (see above-mentioned numbers) that were used for automated calculation of choroidal thickness values after manual adjustment of the segmentation lines at the choroidal borders. The center point measurement was the central point measurement in the central millimeter subfield and was only calculated from 1 manual measurement point.
Statistical Evaluation
Passing and Bablok regression was used for all statistical comparisons. A 95% confidence interval of slope that included 1 was considered to indicate no significant difference in calculated intervals between the calculated values. Likewise, if the 95% confidence interval for the intercept did contain 0, this was taken as no significant constant shift between calculations. A test for linearity was performed before testing for these statistical differences. If the linearity testing was positive (no significant deviation from linearity) and there was no significant difference between areas, values from both areas could be used interchangeably. If the linearity testing was positive and there was a significant difference between areas, a linear conversion formula could be found to use values from one area for the calculation of the values of the other area. If there is a significant deviation from linearity, there is no simple linear conversion formula (change of unit of calculated value and/or origin).
Scan Analysis
As the primary objective, values from line and cube scan calculations of the corresponding outer nasal, inner nasal, central, inner temporal, and outer temporal ETDRS subfields were compared.
As the secondary objective, cross-comparisons of the values of single-point subfoveal measurements at the center point, mean values of all calculation points in the entire central millimeter area, and mean values of all calculation points in the entire 6-mm area of the cube scan were performed. The comparisons included:
- A)
the value of a single-point subfoveal measurement at the center point from cube scans vs the calculated mean value of all scanning points in the entire central millimeter area;
- B)
the value of a single-point subfoveal measurement at the center point from cube scans vs the calculated mean value of all scanning points in the entire 6-mm area; and
- C)
the calculated mean value of all scanning points in the entire central millimeter area vs the calculated mean value of all scanning points in the entire 6-mm area.
In addition, we evaluated if a conversion formula could be applied to any of the results where a significant difference was found for 2 areas but linearity testing was positive, meaning that they cannot represent entire areas but there is a regular error.
Results
Patient Population and Scan Exclusion
Forty-two eyes were screened for the study. Visual acuity testing and slit-lamp examination including fundus biomicroscopy were performed prior to OCT scanning. Consequently, 1 eye with poor study preconditions (media opacities, poor visual acuity precluding fixation) was excluded without OCT measurements. Forty-one eyes of 21 patients remained for OCT scanning. Scans of 3 eyes of 3 patients had to be excluded owing to poor image quality and/or poor automated segmentation quality in the cube scan, but these patients’ second eyes remained in the study. No scans had to be excluded owing to a wrong B-scan location (not scanned at foveal center point), impossible line scan annotation, or lack of agreement between graders. Thus, choroidal thickness values from scans of 38 eyes of 21 patients remained for statistical analysis.
Out of 21 patients, 15 patients suffered from posterior uveitis or panuveitis (toxoplasmosis, syphilis, serpiginous-like choroiditis, punctate inner choroidopathy, idiopathic chorioretinitis, or retinal vasculitis; Behçet or birdshot chorioretinitis; Vogt-Koyanagi-Harada disease), 1 patient had an idiopathic intermediate uveitis, 1 patient had scleritis, and 4 patients suffered from HLA-B27-associated anterior uveitis. The mean age of the study group of 21 patients was 42.1 years and the ratio of men to women was 10:11 (48% men). The mean age of the study group of 38 eyes (age of patients with 2 included eyes counted double) was 42.5 years and the ratio of male to female eyes was 17:21 (45% male eyes). Mean choroidal central millimeter thickness in line scans was 306 μm ± 94 μm and the mean choroidal thickness value of single-point subfoveal measurements at the center point in line scans was 312 μm ± 108 μm, with a range between 112 and 719 μm; mean choroidal central millimeter thickness in cube scans was 302 μm ± 87 μm and the mean choroidal thickness value of single-point subfoveal measurements at the center point in cube scans was 307 μm ± 96 μm with a range between 112 and 536 μm.
Linearity Testing
There was no significant deviation from linearity for any of the areas tested, meaning that either all areas would either be representative for the other area or a conversion formula could be found for this particular case.
Primary Objective
Line Scan Versus Cube Scan Measurements
For the primary objective, if line scan measurements can represent the thickness in corresponding ETDRS subfields of a cube scan, there would be no significant difference between the corresponding subfields (outer nasal 0.92–1.11, inner nasal 0.88–1.06, central 0.94–1.11, inner temporal 0.95–1.12, outer temporal 0.93–1.17). Regression equations of each subfield are given in Figures 2 and 3 .
In Table 1 exemplary calculations for 200 μm, 300 μm, and 400 μm of choroidal thickness in each area could be found to estimate what the deviation in line scan thickness from cube scan thickness in corresponding areas was. For example, if the line scan had measured 300 μm mean central millimeter choroidal thickness, the thickness would be 296 μm in the cube scan, which is a deviation of −1.3% and is not statistically significant. All values of significance are shown in Table 1 . These calculations show that horizontal line scan measurements are indicative for corresponding horizontal cube scan areas without conversion.


