Purpose
To investigate the prevalence and degree of macular thinning on optical coherence tomography (SDOCT) in African-American female patients with asymptomatic sickle cell disease.
Design
Prospective comparative case series.
Methods
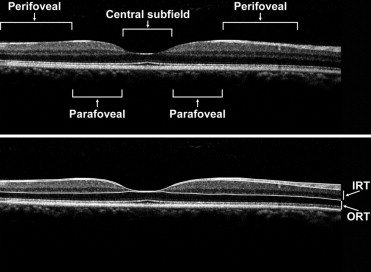
Twenty-one sickle cell patients (42 eyes) without other systemic or ocular diseases and 18 healthy control patients (33 eyes) underwent SD-OCT. Images were manually segmented to measure inner retinal thickness (IRT) and outer retinal thickness (ORT). Central macular (central 1 mm), parafoveal (0.5–1.5 mm eccentricity), and perifoveal (1.5–3 mm eccentricity) thickness measurements were obtained in sickle cell patients and age/gender/race-matched healthy control subjects.
Results
Central macular total thickness (CMT) in sickle cell patients was 220 ± 3 μm (mean ± SEM), which was significantly lower ( P < .05) than controls (228 ± 3 μm). Parafoveal regions had thickness measurements of 314 ± 5 μm (nasal) and 304 ± 2 μm (temporal), which were significantly lower than controls (327 ± 2 μm and 311 ± 2 μm nasally and temporally, respectively) ( P < .03, P < .043). There was also no significant difference in IRT in central macula, parafoveal, and perifoveal regions. Central macular ORT was 175 ± 2 μm vs 185 ± 1 μm in controls ( P < .0002). ORT in temporal parafoveal and perifoveal regions was 142 ± 2 μm and 120 ± 1 μm, respectively, vs 150 ± 1 μm and 122 ± 1 μm in controls ( P < .001 and P = .16, respectively).
Conclusions
Manual segmentation of SD-OCT images revealed significant total retinal thinning in the central macula and splaying in asymptomatic sickle cell patients. Retinal thinning was predominately in outer retinal layers in central macula and parafoveal regions.
Patients with sickle cell disease (SCD) suffer from manifestations of vascular occlusions in various parts of their body, including the retina. Nonproliferative (background) and proliferative vascular changes occur in sickle cell patients because of intravascular sickling, hemolysis, hemostasis, and thrombosis in arterioles and capillaries. Sickle cell retinopathy can progress from a nonproliferative form in which the predominant pathology is arteriolar occlusions in the retinal periphery, to formation of arteriovenous anastomoses and to proliferative retinopathy with neovascularization, which can lead to vision-threatening hemorrhages and retinal detachment.
Although pathology in sickle cell retinopathy is predominantly in the retinal periphery, there are also changes in the macular region. Macular infarctions attributable to SCD has been documented using fluorescein angiography (FA), electroretinography, and histopathology. Previous case reports of individual sickle cell patients with visually symptomatic macular infarctions examined with time-domain optical coherence tomography (OCT) and ultra-high-resolution OCT suggest involvement of 1 of the inner retinal layers, sparing the photoreceptors and retinal pigment epithelium (RPE) layers. Additionally, in FA studies, the foveal avascular zone (FAZ) was shown to be enlarged in SCD patients, with no significant difference in FAZ diameter with respect to stage of retinopathy, type of hemoglobinopathy, or visual acuity.
Moreover, studies establishing normative data in healthy control patients have demonstrated that, in terms of central subfield (CSF) thickness, the central macula is significantly less thick in African Americans and female subjects than in whites and male subjects using the Stratus OCT and Spectralis spectral-domain OCT (SD-OCT).
In the current study, the SD-OCT and manual segmentation of images was utilized to compare thickness of retinal layers in patients at various stages of sickle cell retinopathy and age-, gender-, and race-matched healthy subjects.
Methods
Patient Selection
Twenty-one African-American female sickle cell patients (42 eyes) without history of ocular disease, aside from refractive error or sickle cell retinopathy, and 18 African-American female healthy control subjects (33 eyes) without clinical evidence of maculopathy by ophthalmic examination participated in the study. The ages and diagnoses of patients are listed in the Table . The average age of sickle cell patients (30 ± 2 years) was comparable to the control subjects (34 ± 2 years) ( P = .20). Initial evaluation included best-corrected visual acuity (BCVA) testing, applanation tonometry, slit-lamp biomicroscopy, and fundus examination. Exclusion criteria for control subjects included BCVA <20/20, diagnosis of ocular disease, clinical evidence of maculopathy, hypertension, and/or diabetes. Informed consent was obtained and subjects underwent SD-OCT imaging using a commercially available instrument (Spectralis; Heidelberg Engineering, Heidelberg, Germany). Nineteen to 31 horizontal OCT scans were generated. The central foveal OCT scan was then selected for analysis.
| Age (Years) | Race/Gender | Hgb Type | OD | OS |
|---|---|---|---|---|
| 18 | AAF | SC | Stage 2 | Stage 2 |
| 19 | AAF | SThal | Stage 3 | Stage 2 |
| 22 | AAF | SS | Stage 2 | Stage 2 |
| 22 | AAF | SC | Stage 2 | Stage 2 |
| 23 | AAF | SS | Stage 2 | Stage 2 |
| 23 | AAF | SS | Stage 2 | Stage 2 |
| 23 | AAF | SS | None | None |
| 24 | AAF | SS | Stage 1 | none |
| 25 | AAF | SC | Stage 1 | none |
| 27 | AAF | SS | Stage 2 | Stage 2 |
| 27 | AAF | SS | Stage 1 | Stage 1 |
| 28 | AAF | SS | Stage 1 | Stage 2 |
| 28 | AAF | SS | Stage 2 | Stage 1 |
| 28 | AAF | SThal | None | None |
| 32 | AAF | SS | Stage 1 | Stage 1 |
| 37 | AAF | SC | Stage 2 | Stage 2 |
| 40 | AAF | SC | Stage 2 | Stage 2 |
| 40 | AAF | SC | Stage 1 | Stage 2 |
| 43 | AAF | SS | Stage 2 | Stage 1 |
| 49 | AAF | SS | Stage 4 | Stage 2 |
| 51 | AAF | SC | Stage 3 | Stage 4 |
Analysis
For quantitative analysis of retinal thickness, boundary lines were manually drawn by one observer (Q.V.H.) in a masked manner, using image processing software (ImageJ, Bethesda, Maryland, USA) to segment retinal layers. Boundary lines were drawn at the internal limiting membrane (ILM), posterior boundary of the retinal nerve fiber layer (NFL), posterior boundary of outer plexiform layer (OPL), and neural RPE interface. Examples of OCT scans displaying boundary lines in a control subject and SCD patient are shown in Figures 1 and 2 , respectively. A dedicated software program developed in Matlab (The Mathworks Inc, Natick, Massachusetts, USA) was used to provide automated measurements of inner retinal thickness (IRT: posterior NFL to posterior OPL) and outer retinal thickness (ORT: posterior OPL to RPE interface) based on the depth separation between boundary lines. Thickness profiles were generated from measurements obtained at 100-μm intervals laterally along OCT scans and then aligned based on the minimum IRT at the fovea center. Thickness was averaged among the central subfield macula (1 mm diameter, centered on fovea), parafoveal (0.5 to 1.5 mm eccentricity, nasally or temporally), and perifoveal (1.5 mm to 3 mm eccentricity, nasally or temporally) regions. An unpaired t test was performed to compare measurements in SCD patients and control subjects. Significance was accepted at P values less than .05.