Purpose
To identify baseline structural parameters that predict the progression of visual field (VF) loss in patients with open-angle glaucoma.
Design
Multicenter cohort study.
Methods
Participants from the Advanced Imaging for Glaucoma (AIG) study were enrolled and followed up. VF progression is defined as either a confirmed progression event on Humphrey Progression Analysis or a significant ( P < .05) negative slope for VF index (VFI). Fourier-domain optical coherence tomography (FDOCT) was used to measure optic disc, peripapillary retinal nerve fiber layer (NFL), and macular ganglion cell complex (GCC) thickness parameters.
Results
A total of 277 eyes of 188 participants were followed up for 3.7 ± 2.1 years. VF progression was observed in 83 eyes (30%). Several baseline NFL and GCC parameters, but not disc parameters, were found to be significant predictors of progression on univariate Cox regression analysis. The most accurate single predictors were the GCC focal loss volume (FLV), followed closely by NFL-FLV. An abnormal GCC-FLV at baseline increased risk of progression by a hazard ratio of 3.1. Multivariate Cox analysis showed that combining age and central corneal thickness with GCC-FLV in a composite index called “Glaucoma Composite Progression Index” (GCPI) further improved the accuracy of progression prediction. GCC-FLV and GCPI were both found to be significantly correlated with the annual rate of change in VFI.
Conclusion
Focal GCC and NFL loss as measured by FDOCT are the strongest predictors for VF progression among the measurements considered. Older age and thinner central corneal thickness can enhance the predictive power using the composite risk model.
In the initial evaluation of glaucoma patients, it is important to evaluate the risk of disease progression and the likely rate of visual field (VF) loss. Patients with higher risk of rapid progression could be followed more closely and treated more aggressively. Understanding an individual’s risk profile would allow for the rational use of medical, laser, and surgical treatments, all of which have significant cost, compliance, and safety issues.
A number of risk factors have been previously identified; these include intraocular pressure (IOP) and its variability, corneal thickness, cup-to-disc ratio, age, VF parameters, and optic disc hemorrhage. Family history and race also provide risk information. Photographic evidence of nerve fiber layer (NFL) defect and evidence of disc rim defect have also been recognized as risk factors for VF loss. In a recent meta-analysis, Ernest and associates identified a list of recognized baseline prognostic factors for future VF loss, including disc hemorrhage (for normal tension glaucoma), VF loss, IOP, and exfoliation syndrome, whereas a definitive association was not proven for other factors, such as family history. However, none of these risk factors by themselves are reliable predictors of glaucoma progression, and clinicians must consider all of them in glaucoma patient management.
Advanced imaging technologies can quantify glaucomatous damage to retinal neural structures and may provide useful prognostic information, because structural damage often precedes VF damage. Fourier-domain optical coherence tomography (FDOCT), in particular, provides 3-dimensional imaging that measures the neural structures of the retina and optic nerve head (ONH) with excellent resolution.
The Advanced Imaging for Glaucoma (AIG) Study was designed to identify the role of quantitative imaging in evaluating the risk of glaucoma progression, and in early diagnosis of glaucoma and clinical decision making. The purpose of this article is to identify baseline FDOCT structural predictors for the progression of glaucomatous VF defects using the longitudinal AIG Study perimetric glaucoma cohort.
Methods
Longitudinal Clinical Study
The AIG study is a multicenter bioengineering partnership and longitudinal cohort study sponsored by the National Eye Institute ( ClinicalTrials.gov identifier: NCT01314326 ). The data analyzed in this article came from participants in the perimetric glaucoma (PG) arm of the AIG Study. These participants were enrolled at the Bascom Palmer Eye Institute, University of Miami; the Doheny Eye Institute (then affiliated with University of Southern California); and the University of Pittsburgh Medical Center Eye Institute. The Institutional Review Board (IRB) of each participating university approved the study protocol. The study was in agreement with the provisions of the Declaration of Helsinki. Informed consent was obtained from all subjects using the consent forms approved by the IRBs of the participating institutions. The study was in accordance with the Health Insurance Portability and Accountability Act of 1996 (HIPAA) privacy and security regulations.
Eyes enrolled in the PG group had glaucomatous optic neuropathy as evidenced by diffuse or localized thinning of the neuroretinal rim or NFL defect on fundus examination, and corresponding repeatable abnormal standard automated perimetry (SAP) defects with glaucoma hemifield test (GHT) or pattern standard deviation (PSD, P < .05) outside normal limits.
All study participants underwent a baseline examination consisting of a complete ophthalmic examination with VF and advanced glaucoma imaging (optical coherence tomography [OCT], confocal scanning laser ophthalmoscopy, and scanning laser polarimetry) and had follow-up visits with repeat testing every 6 months. During the follow-up period, each patient was treated at the discretion of the attending physician. The study design and baseline participant characteristics have been previously published and the manual of procedures can be found at www.aigstudy.net .
Visual Field Progression Detection
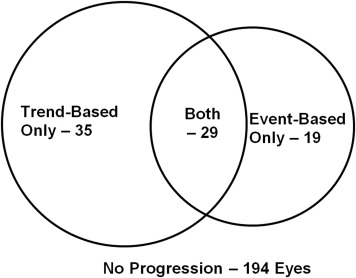
Two methods of VF progression detection were adopted: (1) event-based progression analysis, and (2) trend-based progression analysis.
Event-based visual field progression was determined using Guided Progression Analysis (GPA; Humphrey Field Analyzer; software version 4.2; Carl Zeiss Meditec Inc, Dublin, California, USA). GPA uses statistical criteria designed for the Early Manifest Glaucoma Trial and compares the sensitivity values of individual test locations on follow-up visual fields to the sensitivity values of the same locations on an average of 2 baseline examinations. An automated analysis identifies the locations that show change greater than the expected variability (at the 95% significance level). Event-based progression was defined as a significant change detected in ≥3 test locations, and repeated at the same locations in 3 consecutive follow-up examinations, categorized by the GPA software as “Likely Progression.”
Trend-based visual field progression was defined as a significant ( P < .05) negative slope in the annual rate of change in the visual field index (VFI). The VFI is a calculated index allocated to each visual field that determines the level of abnormality of the field. The VFI uses the pattern deviation (PD) probability map to identify the test locations that are considered either normal and scored as 100%, or absolute defect and scored as 0%. The remaining test locations with relative loss on PD plot are scored in percentage based on their total deviation (TD) value and age-corrected normal threshold. The occurrence of Trend-based Visual Field Progression was defined as the first follow-up visit reaching a significant ( P < .05) negative VFI slope over time. VF progression endpoint was reached when either type of progression was observed.
Fourier-domain Optical Coherence Tomography
Participants were scanned every 6 months with a commercial FDOCT system (RTVue-100; Optovue Inc, Fremont, California, USA). During each visit, participants had 3 ganglion cell complex (GCC) and ONH scans. In the baseline visit, an extra 3D disc scan was also obtained to register ONH scans of same participant in all visits.
Raw data from all AIGS clinical centers were de-identified and transferred to the Casey Eye Institute OCT Reading Center. Certified graders used RTVue software version 6.12 to analyze the data and generate disc, NFL, and GCC structural parameters. Scans were excluded if they had low signal strength, cropping artifact, or failed segmentation. Any ONH scan with a signal strength index (SSI) less than 37 and GCC scan less than 42 were excluded for analysis. Measurements from qualified scans in the same visit were averaged.
Macular GCC parameters were measured using GCC scans. The macular GCC scan covered a 7 × 7-mm-square area, centered 0.75 mm temporal to the fovea, which is designed to improve the coverage of the temporal macula. The macular GCC thickness was defined as the combination of NFL, GCL, and inner plexiform layer. The RTvue software derived a 6-mm-diameter GCC thickness map centered 0.75 mm temporal to the fovea ( Figure 1 ). Based on the map, overall and superior and inferior hemisphere averages of GCC were obtained. Two special pattern analysis parameters were also obtained: (1) the global loss volume (GLV), which measures all negative deviation values normalized by the overall map area; and (2) the focal loss volume (FLV), which measures the negative deviation values in areas of significant focal loss in the foveal region.
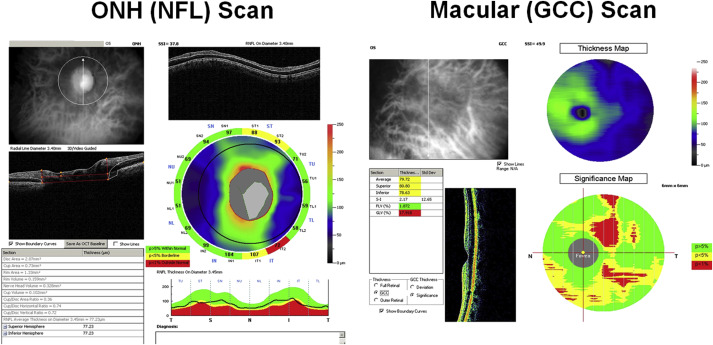
Parameters for NFL were measured using ONH scans. The ONH scan covered a 4.9-mm round area centered at the optic disc. It consisted of concentric (1.3–4.9 mm diameter) scans and radial scans (3.4 mm length). The ONH scans were automatically registered with the baseline 3D disc scan. The 3D disc scan also provided the disc margin information. The NFL thickness profile at 3.4 mm diameter was resampled on the NFL map recentered according to the detected optic disc center ( Figure 1 , Left). Based on the profile, overall and superior and inferior quadrant averages of NFL thickness were obtained using the RTVue software. Pattern analysis was applied to the NFL thickness profile using custom software described in a previous publication. The NFL pattern analysis is analogous to the RTVue GCC pattern analysis that generates the GLV and FLV parameters, but is based on the NFL profile instead of the GCC map.
Parameters for optic disc were also measured using ONH scans. The ONH scan was processed using RTVue software to delineate cup and disc boundaries ( Figure 1 ). The horizontal cup-to-disc ratio (CDR) is the ratio of the diameter of the cup portion with the total diameter of the optic disc in horizontal direction. The vertical CDR is the ratio in vertical direction. The CDR of area is the ratio of cup area and disc areas.
In summary, the acquired measurements using FDOCT included (1) the overall and superior and inferior hemisphere averages of the GCC thickness map, (2) the overall and superior and inferior quadrant averages of the NFL thickness profiles, (3) CDR and rim area, (4) FLV and GLV of GCC thickness map, and (5) FLV and GLV of NFL thickness profile.
Statistical Analysis
Statistical analysis was performed using SAS software version 9.2 (SAS Inc, Cary, North Carolina, USA) to detect progressive structural loss and VF progression in PG patients. All tests were 2-sided and a P value of <.05 was considered significant. The average of 3 high-quality OCT measurements that met the inclusion criteria was used for the statistical analyses. Analysis of variance (ANOVA) was used to compare means for continuous variables and χ 2 test for the categorical variables. When applicable, the general estimating equation (GEE) method was used to adjust for correlation between 2 eyes of the same patient.
The primary analysis used Cox regression, which is suitable for time-to-event data. The participants had to have at least 3 follow-up visits in addition to the baseline visit to be eligible for inclusion in the analysis. For each of the covariates in the analysis, we provided a hazard ratio (HR) estimate and the corresponding P value. We also provided the area under the receiver operating curve (AUC) for the covariate to compare its relative predictive accuracy for glaucomatous progression.
For NFL and GCC parameters, normal, borderline (bottom 1–5 percentile of normal population), and abnormal (below bottom 1 percentile) classifications were provided by the RTVue device based on the normative database compiled by Optovue. These classifications are shown in yellow (borderline), red (abnormal), and green (normal) on the RTVue printout ( Figure 1 ). For these categorical covariates, Kaplan-Meier survival curves were produced, and log-rank tests were used to compare risks among categories.
Because many participants had both eyes enrolled in this study, we used a robust sandwich covariance estimation method in the Cox regression to adjust for this potential correlation.
All of the potential covariates were evaluated to build an optimal multivariate Cox regression model through a combination of manual elimination and automatic stepwise selection processes. When the optimal combination of the covariates was determined, the linear form was transformed through a logistic function. The resulting value, which ranged from 0 to 1, was defined as the Glaucoma Composite Progression Index (GCPI). A GCPI closer to 1 implied a higher risk of progression.
Results
Characteristics of Participants: Progressors and Nonprogressors
Out of 277 PG eyes of 188 participants, there were 194 nonprogressor eyes (age 62.2 ± 10.1 years, followed 4.0 ± 1.6 years) from 132 patients and 83 progressor eyes (age 63.8 ± 8.3 years, followed 3.8 ± 1.6 years) from 66 patients ( P = .61). Out of 5901 total follow-up scans, 289 (4.9%) GCC scans and 307 (5.2%) NFL scans were excluded owing to poor signal strength; and 203 (3.4%) GCC and 243 (4.1%) NFL scans were excluded owing to cropping artifacts or failed segmentation. More progressors were identified using trend-based analysis rather than event-based analysis ( Figure 2 ). Baseline IOP was slightly lower in progressors, although the difference was not significant ( Table 1 ). The average IOP during the follow-up period was similar ( P = .13) between nonprogressors and progressors (14.1 ± 3.2 mm Hg vs 13.5 ± 2.7 mm Hg). The peak IOP during the follow-up period was similar ( P = .28) between nonprogressors and progressors (16.9 ± 4.6 mm Hg vs 16.3 ± 3.9 mm Hg). The IOP range during the follow-up period was also similar ( P = .74) between nonprogressors and progressors (5.1 ± 4.2 mm Hg vs 5.3 ± 3.8 mm Hg). Central corneal thickness (CCT), baseline mean deviation (MD), PSD, and VFI were not significantly different between nonprogressors and progressors ( P > .05). The age distribution, sex, and number of patients with African origin, diabetes, systemic hypertension, and family history of glaucoma were similar between nonprogressor and progressor eyes ( Table 1 ).
| Nonprogressors 194 Eyes | Progressors 83 Eyes | P Value | |
|---|---|---|---|
| Age (y) | 62.23 ± 10.08 | 63.75 ± 8.27 | .61 |
| Female | 116 (59.8%) | 49 (59.0%) | .91 |
| African origin | 20 (10.3%) | 8 (9.6%) | .31 |
| Systemic hypertension | 72 (37.1%) | 31 (37.3%) | .97 |
| Diabetes mellitus | 20 (10.3%) | 11 (13.3%) | .48 |
| Family history of glaucoma | 79 (40.7%) | 44 (53.0%) | .61 |
| # Eye drops used | 1.4 ± 1.2 | 1.5 ± 1.1 | .42 |
| Central corneal thickness (μm) | 549 ± 37 | 535 ± 35 | .12 |
| IOP at baseline (mm Hg) | 14.6 ± 4.7 | 13.5 ± 3.6 | .16 |
| VF mean deviation (db) | −4.76 ± 5.13 | −4.99 ± 4.21 | .97 |
| VF pattern standard deviation (db) | 5.36 ± 4.02 | 6.61 ± 4.39 | .20 |
| VFI (%) | 87.9 ± 15.0 | 86.8 ± 12.5 | .92 |
| Follow-up time (y) a | 3.8 ± 2.2 | 3.7 ± 1.9 | .72 |
| Fourier-Domain Optical Coherence Tomography Parameters | |||
| Rim area (mm 2 ) | 0.80 ± 0.38 | 0.69 ± 0.31 | .01 |
| CDR, vertical | 0.80 ± 0.16 | 0.85 ± 0.13 | .02 |
| CDR, horizontal | 0.84 ± 0.15 | 0.85 ± 0.17 | .54 |
| CDR, area | 0.60 ± 0.19 | 0.63 ± 0.19 | .27 |
| NFL overall (μm) | 81.4 ± 12.5 | 78.5 ± 10.7 | .19 |
| NFL inferior Q (μm) | 94.8 ± 19.9 | 88.8 ± 16.3 | .15 |
| NFL superior Q (μm) | 97.6 ± 18.7 | 95.2 ± 18.3 | .20 |
| NFL-GLV (%) | 20.24 ± 10.66 | 22.79 ± 8.74 | .21 |
| NFL-FLV (%) | 6.79 ± 4.64 | 8.84 ± 4.53 | .01 |
| GCC overall (μm) | 83.9 ± 11.1 | 81.5 ± 9.0 | .38 |
| GCC inferior H (μm) | 81.9 ± 12.9 | 78.1 ± 11.5 | .10 |
| GCC superior H (μm) | 85.8 ± 11.7 | 84.3 ± 10.2 | .74 |
| GCC-GLV (%) | 12.91 ± 9.46 | 15.2 ± 7.7 | .24 |
| GCC-FLV (%) | 4.75 ± 4.16 | 6.61 ± 4.36 | .01 |
a Follow-up time is calculated over the entire follow-up for the participant.
Among the baseline FDOCT measurements, the following variables were significantly different between progressors and nonprogressors: rim area, vertical CDR, NFL-FLV and GCC-FLV ( Table 1 ). The following variables were not significantly different between progressors and nonprogressors: horizontal CDR, NFL overall thickness, NFL inferior and superior quadrant thickness, NFL-GLV, GCC overall thickness, GCC inferior and superior hemisphere thickness, and GCC-GLV. According to univariate Cox regression analyses ( Table 2 ), significant baseline risk factors for VF progression include CCT, VF PSD, NFL inferior quadrant thickness, NFL-FLV, GCC overall thickness, GCC inferior hemisphere thickness, GCC-GLV, and GCC-FLV. The following baseline factors were not statistically significant: IOP, VFI, rim area, CDRs, NFL overall thickness, NFL superior quadrant thickness, NFL- GLV, GCC overall thickness, and GCC superior hemisphere thickness. The following variables are of borderline statistical significance: VF MD ( P = .08) and NFL-GLV ( P = .07). Among the significant risk factors, GCC-FLV is the strongest predictor, with AUC = 0.632. NFL-FLV is the second-strongest, with AUC = 0.631, almost identical to GCC-FLV.
| Unit | HR | P Value | AUC | |
|---|---|---|---|---|
| Central corneal thickness (μm) | 20 μm thinner | 1.14 | .012 | 0.621 |
| VF PSD (dB) | 1 db higher | 1.06 | .013 | 0.587 |
| Fourier-Domain Optical Coherence Tomography Parameters | ||||
| NFL inferior quadrant (μm) | 10 μm thinner | 1.15 | .020 | 0.585 |
| NFL-FLV (%) | 5% higher | 1.46 | .002 | 0.631 |
| GCC overall (μm) | 10 μm thinner | 1.29 | .013 | 0.576 |
| GCC inferior hemisphere (μm) | 10 μm thinner | 1.26 | .006 | 0.590 |
| GCC-GLV (%) | 5% higher | 1.18 | .003 | 0.597 |
| GCC-FLV (%) | 5% higher | 1.50 | <.001 | 0.632 |
Although continuous parameters provide the fullest information, clinicians find it easiest to interpret the classifications of normal, borderline, and abnormal that are simple and highlighted in color in the device printout. Therefore, we calculated hazard ratios for these OCT classifications ( Table 3 ). GCC-FLV was again the strongest predictor of VF progression. Eyes with abnormal GCC-FLV at the baseline had more than 3 times the hazard of significant VF progression compared with those with normal GCC-FLV.
| Classification | Number of Eyes (%) | Hazard Ratio | P Value | |
|---|---|---|---|---|
| NFL inferior quadrant (μm) | Borderline | 28 (10.1%) | 1.18 | .33 |
| Abnormal | 86 (31.1%) | 1.25 | .04 | |
| NFL-FLV % | Borderline | 55 (19.9%) | 1.50 | .17 |
| Abnormal | 108 (39.0%) | 2.07 | .007 | |
| GCC overall | Borderline | 59 (21.3%) | 1.39 | .27 |
| Abnormal | 107 (38.6%) | 1.86 | .02 | |
| GCC inferior hemisphere | Borderline | 37 (13.4%) | 1.52 | .21 |
| Abnormal | 135 (48.7%) | 1.88 | .007 | |
| GCC-GLV % | Borderline | 63 (22.7%) | 2.05 | .04 |
| Abnormal | 123 (46.2%) | 2.31 | .003 | |
| GCC-FLV % | Borderline | 34 (12.3%) | 2.69 | .007 |
| Abnormal | 149 (53.8%) | 3.07 | <.0001 |
We also calculated the slope of VFI change over time according to GCC-FLV classification at baseline ( Table 4 ). Eyes with normal GCC-FLV at the baseline had, on average, no change in VFI over time. Eyes with borderline or abnormal GCC-FLV at baseline had significantly faster VFI decline. The slope of VFI deterioration was on average twice as fast for those with abnormal GCC-FLV at baseline, compared with those with borderline values.
| Baseline GCC-FLV | VFI Slope |
|---|---|
| Normal | −0.03% ± 1.27% (n = 64) |
| Borderline | −0.20% ± 1.03% (n = 25) |
| Abnormal | −0.43% ± 1.56% (n = 109) |
Stay updated, free articles. Join our Telegram channel

Full access? Get Clinical Tree


