Purpose
To quantify the temporal properties of the acquired vitelliform lesion (AVL) life cycle, define the clinical characteristics of choroidal neovascularization (NV) in this setting, and determine the predictors of long-term visual outcomes.
Design
Retrospective cohort study.
Methods
Clinical and imaging data from 199 eyes of 124 consecutive patients with AVLs associated with age-related macular degeneration (AMD) and adult-onset foveomacular vitelliform dystrophy (AOFVD) were analyzed. Volumetric calculations of vitelliform material were determined using spectral-domain optical coherence tomography and the temporal properties of the AVL life cycle were quantified. The clinical characteristics of NV were assessed, as were the predictors of final best-corrected visual acuity (BCVA) and change in BCVA.
Results
Mean age was 79.2 ± 12.1 years. AVLs grew and collapsed at approximately the same rate ( P = .275). Fifteen eyes (7.5%) developed NV, of which all were type 1. In 13 of these eyes, NV occurred during the collapse phase of the AVL life cycle, after the peak AVL volume was reached. The risk of NV ( P = .006) and the decline in BCVA ( P = .001) were both significantly greater among eyes with AMD. Foveal atrophy was the characteristic most significantly associated with final BCVA and change in BCVA from baseline (both P < .0005). The development of NV was not predictive of long-term visual outcomes (all P = .216).
Conclusions
Complications associated with AVLs typically occur during the collapse phase of the AVL life cycle. Visual outcomes and risk of NV are related to the underlying disease associated with AVLs.
Acquired vitelliform lesions (AVLs) are infrequent manifestations of dystrophic, degenerative, paraneoplastic, toxic, and vitreoretinal interface disorders involving the macula. They represent the accumulation of lipofuscin, melanolipofuscin, melanosomes, and outer segment debris in the subretinal space, between the retinal pigment epithelium (RPE) and photoreceptor layer. Because AVLs are predominantly composed of pigmented granules of RPE origin, previous authors have speculated that they denote a specific RPE stress response to an unclarified insult.
Choroidal neovascularization (NV) and foveal atrophy are important causes of visual morbidity in the setting of AVLs. Our current understanding of these complications during the natural course of AVLs has to a large extent been derived from studies on adult-onset foveomacular vitelliform dystrophy (AOFVD). However, AVLs are also associated with prevalent conditions such as age-related macular degeneration (AMD), and it is unknown if phenotypic features specific to each disease, such as drusen and choroidal abnormalities, differentially modulate the risk of developing atrophy and NV. Recently, we performed a direct clinicopathologic correlation of multimodal imaging, including spectral-domain optical coherence tomography (SDOCT), of a patient with an AVL complicated by type 1 NV. In another study, we used ex vivo SDOCT and histology of a donor eye with vitelliform material and hyperreflective intraretinal foci to establish RPE participation in these processes. By defining anatomic correlates for reflectivity signatures for vitelliform contents and neovascular associations of AVL, these 2 reports provided a basis to study the natural history of AVLs in patient populations using SDOCT.
The natural course of AVLs is characterized by a period of growth followed by resorption. However, it is unclear if the risk of neovascular complications throughout the AVL life cycle is uniform. Resolving the timeline of NV complications in the setting of AVLs has major relevance for patient education, for determining the frequency of patient review, for refining management paradigms, and ultimately for understanding the pathophysiology of AVLs. In this report, properties of the AVL life cycle are quantitatively defined. The clinical characteristics of NV in eyes with AVLs and the risk factors for this complication are also determined. Finally, the significant predictors of visual outcome in eyes with AVLs are reported. Comparisons between AOFVD and AMD also demonstrate that visual outcomes and complications are specific to the underlying disease associated with AVLs.
Methods
This study complied with the Health Insurance Portability and Accountability Act of 1996 and followed the tenets of the Declaration of Helsinki. The institutional review board of the Manhattan Eye, Ear and Throat Hospital/Northshore Long Island Jewish Hospital approved this retrospective review.
Subjects
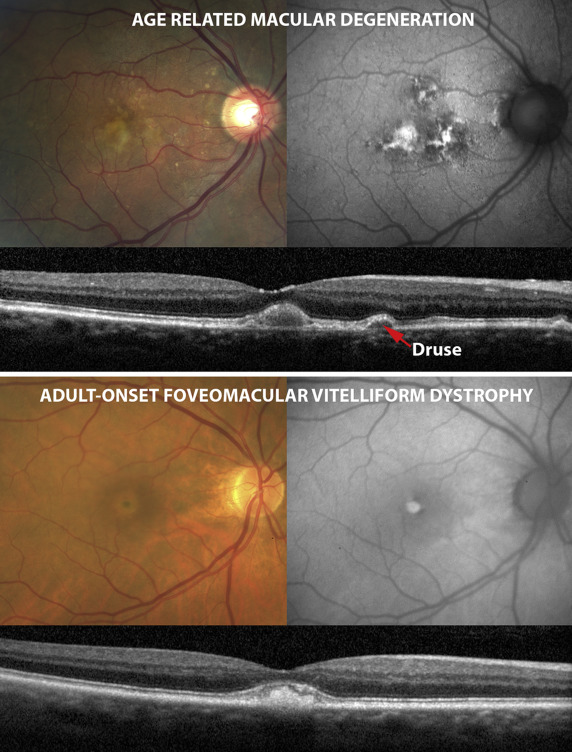
Consecutive patients seen between July 2011 and July 2015 at the Vitreous Retina Macula Consultants of New York with more than 6 months of follow-up were included in this study. Patients were selected in a retrospective manner using the billing records of 2 retina specialists (L.A.Y. and K.B.F.). The search terms “age-related macular degeneration,” “adult onset foveomacular vitelliform dystrophy,” “pattern dystrophy,” “acquired vitelliform disease,” and “vitelliform” were used to identify potential subjects. Medical records and multimodal imaging data for each patient were reviewed and suitable patients with AVL and a diagnosis of AMD or AOFVD were included in this study. Only patients seen 2 or more times and with AVLs involving the macula were included. The definitions used to ensure consistencies in phenotypic characterization of subjects were as follows ( Figure 1 ):
- •
Acquired vitelliform lesion: The ophthalmoscopic and SDOCT diagnoses of vitelliform material were based on the presence of yellowish deposits in the subretinal space and hyperreflective material above the RPE band, respectively. On fundus autofluorescence (FAF) imaging, vitelliform material was defined by areas of hyperautofluorescence that correlated with the sites where vitelliform material was seen on color fundus and SDOCT imaging.
- •
Age-related macular degeneration: This diagnosis was based on the revised clinical classification of AMD. Cases of cuticular drusen with RPE abnormalities were also included in this group.
- •
Adult-onset foveomacular vitelliform dystrophy (Pattern dystrophy [group 1 type]): These eyes were classified using the definition previously proposed by Gass and by Freund and associates. Eyes in this group were characterized by AVLs in the absence of other funduscopic abnormalities.
Subjects with a history of tumors or inflammatory or infectious conditions that may have accounted for neurosensory detachment and subjects with a known family history of Best macular dystrophy and geographic atrophy at baseline were excluded.
Clinical Imaging
All eyes in this study were evaluated using the Spectralis SDOCT (Heidelberg Engineering, Heidelberg, Germany). A raster scan protocol centered at the fovea (range 20 × 25 degrees to 30 × 20 degrees) was used. Eye tracking and image registration functions were enabled for most image acquisitions. All eyes were also imaged with color photography using the Topcon TRC-50XF fundus camera (Topcon Medical Systems, Paramus, New Jersey, USA). Fundus autofluorescence images were obtained using the Spectralis HRA + OCT (Heidelberg Engineering) or the Topcon TRC-50XF fundus camera. Many eyes were also imaged with fluorescein angiography (FA) during the course of their follow-up, using 1 or more of 3 instruments (Optos 200Tx [Optos, Dunfermline, Scotland, United Kingdom], Topcon TRC-50XF fundus camera, or Heidelberg Spectralis HRA+OCT).
Data Collection and Image Analysis
Information about ocular history, patient demographics, and disease course was obtained from patient records. Best-corrected visual acuity (BCVA) from the first and final visits was also recorded.
The occurrence of NV in each eye was determined using ophthalmoscopy, SDOCT, and, in most eyes, fluorescein angiography. Ophthalmoscopic features used to support the diagnosis of NV included the occurrence of retinal exudation, hemorrhage, edema, and/or new pigment epithelial detachment. SDOCT criteria included the occurrence of subretinal fluid, intraretinal fluid, subretinal hyperreflective material, and/or new pigment epithelial detachment. Indications used by the investigators for the performance of FA included new-onset visual symptoms such as a decrease in visual acuity or metamorphopsia. Clinical examination findings that also prompted the performance of FA included new retinal hemorrhages, macular edema, or pigment epithelial detachment that was not present on previous visits. New findings on SDOCT, such as intraretinal fluid, subretinal fluid, and pigment epithelial detachment, also prompted investigation with FA. Angiographic features of NV included leakage and stippled hyperfluorescence in the late frames of the FA. Neovascularization was categorized as type 1, 2, or 3 based on the Gass-Freund anatomic classification of neovascular lesions. The timing of NV with respect to the AVL life cycle (as described below) was also recorded.
The following additional quantitative/semi-quantitative determinations were made using multimodal imaging data:
- •
Presence of foveal atrophy at the final visit: Foveal atrophy was defined as an area of outer retinal, RPE, and choriocapillaris loss as seen on color, FAF, and SDOCT imaging.
- •
Subfoveal choroidal thickness: Measured at the final visit using SDOCT and defined as the distance between the RPE and Bruch membrane (BrM) complex and the choroid and scleral border under the fovea.
- •
Occurrence of a split in the RPE–basal lamina (BL) –BrM band (RBB band) on SDOCT: In the normal macula the fourth outer retinal hyperreflective band is known to be composed of RPE and BrM. It also includes the RPE-BL, which is normally thin. In AMD, the RPE-BL thickens into basal laminar deposits. Further, a potential space between the RPE-BL and BrM can fill with basal linear deposits, neovessels, fluid, blood, or cells. Either can result in a relatively hyporeflective band that splits the hyperreflective RBB band. In this study, SDOCT volume scans for each subject were evaluated in a masked fashion for a split RBB band. When a split RBB is present in eyes that developed NV, the time point at which the split RBB was first observed was also recorded.
Quantitative Analysis of the Acquired Vitelliform Lesion Life Cycle
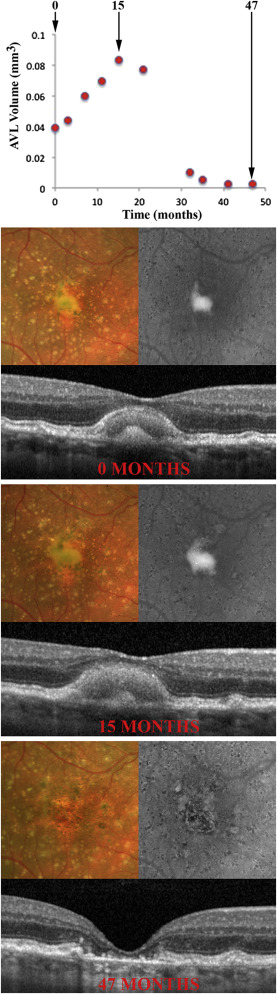
The temporal course of AVLs was quantitatively evaluated by graphing vitelliform volume as a function of time ( Figures 2 and 3 ). Only those eyes that observably demonstrated AVL growth and resorption during the period of follow-up and that were also imaged with SDOCT at an interval of ≤6 months were used in this analysis. Vitelliform volume at each visit was determined by applying the Cavalieri principle of stereologic analysis to SDOCT volumetric data using the following steps:
- (1)
The area between the RBB band and ellipsoid zone for each slice in the AVL volume scan was calculated using manual planimetry.
- (2)
The volume between 2 adjacent OCT slices (herein called a segment) was then determined using the equation:
where: Vol = Volume of vitelliform material within segment bounded by OCT slice number x and x +1
d = distance between adjacent slices in μm
A = area between the RBB band and ellipsoid zone in μm 2
x = OCT slice number.
- (3)
Total vitelliform volume was calculated by summing the volumes of individual segments. The number of segments in the OCT volume was (n − 1) where n = total number of slices that spanned the AVL. Plots of vitelliform volume vs time were then generated.
For eyes complicated by NV, these plots were used to determine if NV occurred during the period of AVL growth or resorption.
Statistical Analysis
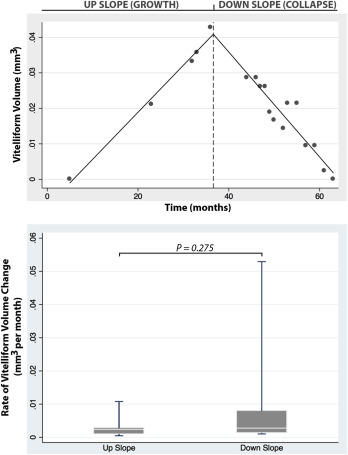
Data were analyzed with Stata 14.0 (StataCorp LP, College Station, Texas, USA). Piecewise linear regression analysis was performed on plots depicting vitelliform volume as a function of time. The points of significant slope changes, herein referred to as the “breakpoint” of the AVL life cycle, were identified. The absolute value of the gradient of the slopes on either side of the breakpoint, representing the rate of vitelliform volume growth and rate of vitelliform resorption, respectively, were compared using a paired t test.
Linear regression analysis was used to determine if the underlying diagnosis (AMD or AOFVD) was predictive of the development of NV in eyes with AVL, and whether subfoveal choroidal thickness, the occurrence of NV, or the presence of foveal atrophy at the final clinic visit was associated with BCVA at the final clinic visit or “change in BCVA” (difference between baseline and final visit, expressed as logMAR). The t test was used to compare BCVA at baseline and final visits in eyes that did not develop NV and those that did. Significance was defined as P ≤ .05. Results in this manuscript are presented as mean ± standard deviation.
Results
General
A total of 613 medical records were reviewed; of these, 199 eyes from 124 patients met the inclusion criteria. The cohort comprised 72 female subjects, 52 male subjects, 97 right eyes, and 102 left eyes. There were 104 eyes with AMD and 95 eyes with AOFVD. A total of 126 eyes (63.3%) were imaged at least once with FA during their disease course. Mean number of B-scans per OCT volume for the cohort was 27.9 ± 13.4 (median, 19; range, 14–97) and mean number of A-scans was 12.8 ± 5.6 (median, 12; range, 1–43).
Mean age of subjects at initial (baseline) visit was 79.2 ± 12.1 years (range, 44.0–95.1 years). Mean duration of follow-up was 85.7 ± 72.0 months (range, 6.2–450.1 months). Mean BCVA at baseline visit was 0.27 ± 0.28 logMAR (range, 0.0–1.9 logMAR; mean Snellen equivalent approximately 20/20 to 20/1600) and mean BCVA at final visit was 0.47 ± 0.40 logMAR (range, 0.0–2.0 logMAR; mean Snellen equivalent approximately 20/20 to 20/2000). Overall, BCVA worsened between baseline and final visits (+0.20 ± 0.35; range, −0.90 to +1.43, P < .001). Mean subfoveal choroidal thickness at the final visit was 215.4 ± 106.1 μm (range, 38–661 μm) and foveal atrophy was present in 66 eyes (33.2%) at the final visit. Demographic and clinical features for each disease group are summarized in the Table . There was no significant difference between the groups in terms of laterality of disease ( P = .47) or duration of follow-up ( P = .67).
| AMD | AOFVD | |
|---|---|---|
| Subjects | 63 | 61 |
| Number of eyes | 104 | 95 |
| Female subjects (%) | 37 (58.7%) | 35 (57.4%) |
| Right eye (%) | 54 (51.9%) | 43 (45.3%) |
| Mean age (y) | 81.9 ± 9.6 | 76.6 ± 13.7 |
| Initial BCVA (logMAR) | 0.32 ± 0.31 | 0.23 ± 0.23 |
| Final BCVA (logMAR) | 0.60 ± 0.43 | 0.31 ± 0.25 |
| Choroidal NV development (%) | 13 (12.4%) | 2 (2.1%) |
| Duration of follow-up (mo) | 80.4 ± 57.1 | 84.9 ± 85.9 |
| Subfoveal choroidal thickness (μm) | 201.9 ± 92.8 | 229.6 ± 116.9 |
| Foveal atrophy (%) | 46 (43.8%) | 20 (21.3%) |
Eleven eyes (5.5%) in the cohort had primary open-angle glaucoma and 2 eyes (1.0%) previously suffered a branch retinal vein occlusion with return of BCVA to 20/20 prior to the development of the AVL. Sixty-eight eyes (34.2%) were pseudophakic and 3 (1.5%) had previously undergone peripheral laser retinopexy for retinal tear. Refractive surgical procedures had previously been performed in 2 eyes (radial keratotomy in 1 eye and laser-assisted in situ keratomileusis in the other).
Temporal Properties of the Acquired Vitelliform Lesion Life Cycle
Temporal changes in vitelliform volume were studied in 12 eyes (7 eyes with AMD and 5 eyes with AOFVD), all of which were not complicated by NV. Comparisons of the demographic and clinical features between this group and the entire cohort are summarized in the Supplemental Table (Supplemental Material available at AJO.com ). Mean age of subjects at initial (baseline) visit was 77.2 ± 10.6 years (range, 62.0–92.0 years). Mean number of SDOCT macular scans per eye used for vitelliform volume plots was 12.8 ± 3.5 (range, 7–18). Mean period of time over which vitelliform volume changes were studied was 58.2 ± 20.7 months (range, 26–94 months). Mean BCVA at baseline visit was 0.33 ± 0.14 logMAR (range, 0.18–0.48 logMAR; Snellen equivalent approximately 20/30 to 20/60) and mean BCVA at final visit was 0.74 ± 0.50 logMAR (range, 0.3–1.8 logMAR; Snellen equivalent approximately 20/40 to 20/1300). Mean subfoveal choroidal thickness at the final visit was 190.3 ± 109.7 μm (range, 49.0–375.0 μm) and foveal atrophy was present in 6 eyes (50.0%) at the final visit.
A typical plot of vitelliform volume as a function of time is provided in Figure 2 . In all cases the life cycle of AVLs was biphasic, characterized by a growth phase and a resorption phase. Piecewise linear regression analysis identified a breakpoint where the slope changed significantly between periods of growth and resorption ( Figure 3 ). The mean absolute gradient of the slope during AVL growth (0.003 ± 0.003 mm 3 /month; range, 0.00048–0.01079 mm 3 /month) was not significantly different ( P = .275; Figure 3 ) from the mean absolute gradient of the slope during AVL resorption (0.008 ± 0.015 mm 3 /month; range, 0.0529–0.00099 mm 3 /month). The mean period of time from baseline visit to the breakpoint of the AVL life cycle was 27.6±13.2 months (range, 8–49 months).
Choroidal Neovascularization
The clinical course of 15 eyes (7.5%) of 15 patients (8 male and 7 female) was complicated by NV. This cohort comprised 13 eyes with AMD and 2 eyes with AOFVD. Mean age at time of diagnosis of NV was 79.5 ± 11.4 years (range, 60.9–94.1 years). All eyes that developed NV were treated with intravitreal anti–vascular endothelial growth factor therapy. Mean visual acuity at the last visit in this group was 0.62 ± 0.37 (mean Snellen equivalent approximately 20/80). At the last visit, 67% of eyes (10/15) demonstrated foveal atrophy, 40% (6/15) demonstrated intraretinal fluid, and 60% (9/15) demonstrated a pigment epithelial detachment on SDOCT.
In 13 of 14 cases (93%), NV occurred during the resorption phase of the AVL life cycle—that is, after the peak AVL volume had been reached. Specifically, in 10 of 14 cases (71%), complete AVL resorption was noted at the time of NV ( Figure 4 ). NV developed during the AVL growth phase in only 1 of 14 eyes ( Figure 4 ). In 1 eye there were insufficient imaging data to determine if NV occurred during the growth or resorption phase of the AVL cycle.


