Purpose
To describe a new automated quantitative technique for displaying and analyzing macular vascular perfusion using optical coherence tomography angiography (OCT-A) and to determine a normative data set, which might be used as reference in identifying progressive changes due to different retinal vascular diseases.
Design
Reliability study.
Methods
A retrospective review of 47 eyes of 47 consecutive healthy subjects imaged with a spectral-domain OCT-A device was performed in a single institution. Full-spectrum amplitude-decorrelation angiography generated OCT angiograms of the retinal superficial and deep capillary plexuses. A fully automated custom-built software was used to provide quantitative data on the foveal avascular zone (FAZ) features and the total vascular and avascular surfaces. A comparative analysis between central macular thickness (and volume) and FAZ metrics was performed. Repeatability and reproducibility were also assessed in order to establish the feasibility and reliability of the method.
Results
The comparative analysis between the superficial capillary plexus and the deep capillary plexus revealed a statistically significant difference ( P < .05) in terms of FAZ perimeter, surface, and major axis and a not statistically significant difference ( P > .05) when considering total vascular and avascular surfaces. A linear correlation was demonstrated between central macular thickness (and volume) and the FAZ surface. Coefficients of repeatability and reproducibility were less than 0.4, thus demonstrating high intraobserver repeatability and interobserver reproducibility for all the examined data.
Conclusions
A quantitative approach on retinal vascular perfusion, which is visible on Spectralis OCT angiography, may offer an objective and reliable method for monitoring disease progression in several retinal vascular diseases.
The retinal vascular system provides almost all the metabolic needs, such as transporting oxygen and nourishment and controlling immune responses, for the inner retinal layers. The human arterial and venous network spreads across the retina with 3 distinct layers of vessels and capillaries, including the radial peripapillary capillary plexus, the superficial (inner) capillary plexus, and the deep (outer) capillary plexus. The 3 plexuses of retinal vasculature inhabit the nerve fiber layer (radial peripapillary capillary plexus), the ganglion cell layer (GCL) (superficial capillary plexus [SCP]), and the inner nuclear layer (INL) (deep capillary plexus [DCp]).
In the center of the macular area, a capillary-free zone is present, which is known as the foveal avascular zone (FAZ). The normal human FAZ with a fully developed fovea is circular on its en face view and it encircles the foveal depression. FAZ borders are defined from the perifoveal capillary arcade, which consists of a ring of interconnected capillaries, formed by the superficial and deep vascular plexuses at the margin of the fovea.
The fovea centralis of the human provides high-resolution vision, and significant capillary dropout from this region, owing to several retinal vascular diseases, may cause severe visual loss. For this reason the perifoveal capillary network and FAZ have been studied in vitro and in vivo, using various methods, including histologic techniques, high-contrast entoptic view, fluorescein angiography (FA), and high-resolution imaging tools, such as adaptive optics and confocal scanning laser ophthalmoscopy.
FA has long been considered the method of choice for imaging the retinal perfusion and diagnosing vascular diseases, since its introduction in the 1960s; although fluorescein angiographic images of the retina corresponded well to the anatomic arrangement of the superficial retinal vessels, the deeper retinal capillaries were not visualized in the angiogram.
A novel diagnostic technique, optical coherence tomography angiography (OCT-A), allows a depth-resolved visualization of the retinal and choroidal microvasculature. OCT-A is based on the concept that in a static eye, the only moving structure in the ocular fundus is the blood flowing in the vessels. A contrast is generated by differentiating between moving cells in the vasculature and the static surrounding tissue. By calculating the decorrelation of the signal amplitude from repeated consecutive B-scans in the same section, a contrast is generated between static and nonstatic tissue, resulting in a vascular decorrelation signal that enables the visualization of 3-dimensional retinal and choroidal vascular structure. OCT-A does not require administration of an intravenous dye, such as fluorescein or indocyanine green, thus avoiding potential risks that can result in nausea or other rare adverse events.
Although OCT-A provides the first in vivo detailed information about the radial peripapillary capillary plexus and deep plexus, only an automated quantification of macular perfusion could translate its theoretical usefulness into clinical practice.
In this study, we aimed to describe a new quantitative technique for displaying and analyzing macular vascular perfusion using optical coherence tomography angiography. Moreover, this normative data set might be used as reference in identifying progressive changes due to different retinal vascular diseases, inducing macular nonperfusion and ischemia.
Methods
Study Design
This reliability study was conducted in the Odeon Ophthalmology Center (Paris, France). This study was performed in accordance with the Declaration of Helsinki after approval by the Paris Institutional Ethics Committee. Fully informed written consent was obtained from all study patients prior to scanning with the prototype OCT system.
Study Population
Forty-seven eyes of 47 healthy subjects underwent best-corrected visual acuity (BCVA) testing, slit-lamp biomicroscopy, intraocular pressure measurement, fundus evaluation, and OCT-A between September 2015 and December 2015.
The inclusion criteria were BCVA of 20/20 or better with no history or clinical evidence of retinal disease or systemic illness. Exclusion criteria were any history or clinical evidence of retinal disease, glaucoma, previous ocular surgery or laser photocoagulation, refractive error of 3 diopters or more, and signs of any other chorioretinal disease. Eyes with poor-quality images on OCT-A (quality index lower than 40) owing to poor fixation or media opacities that could confound the analysis were also excluded.
Optical Coherence Tomography Angiography System Setup
The study eyes were evaluated using a Spectralis OCT-A prototype (based on Spectralis OCT2; Heidelberg Engineering, Heidelberg, Germany) that was able to acquire 70 000 A-scans per second with a 3.9-μm axial and 6-μm lateral resolution. This device used a light source of 870 nm with bandwidth of 50 nm and it was coupled with an Automated Real Time (ART) mode, which was able to average the image and reduce the noise. The ocular light power exposure was within the American National Standards Institute safety limit. A full-spectrum amplitude-decorrelation algorithm (FS-ADA) developed by Heidelberg Engineering (Heidelberg, Germany) was applied to a volume scan on a 15 × 10-degree (4.5 × 3 mm approximately) area, which was composed of 261 B-scans (ART mode was set at 35 frames per scan in all OCT-A examinations) at a distance of 11 μm each.
The FS-ADA allowed us to obtain B-scan angiograms with the same lateral and axial resolutions of structural B-scans (6 μm lateral resolution and 3.9 μm axial resolution). A high axial resolution was crucial to distinguish different decorrelated vascular structures at different depths within the short distance included between the inner border of the GCL and the outer border of the INL (where the SCP and DCP are located). The drawback of maintaining a high axial resolution was a reduced signal-to-noise ratio, which could lead to less contrasted images. This phenomenon has been compensated by the use of the ART mode (averaging process of 35 frames per B-scan), although with an increase in terms of acquisition time.
The OCT-A, as previously described, was generated by computing the decorrelation between standard B-scans that were sequentially acquired at the same location. The decorrelation between each acquired B-scan and a second one taken in the same location was computed to obtain an OCT B-scan angiogram. The C-scan (en face) visualization of this OCT-A was automatically derived from the OCT B-scan angiograms mentioned above. The ART mode combined with the narrow distance between 2 consecutive B-scans (11 μm) helped to improve the signal-to-noise ratio. Moreover, the Active Eye Tracking System (TruTrack) of the Spectralis OCT2 prototype, allowing the patient to rest in case of fatigue onset during the examination, provided the best high-resolution C-scan angiogram, even in case of poor fixation or blinking.
This technique uses 2 light beams separately to capture 2 images simultaneously. One beam constantly images and tracks the fundus, acting as a reference, guiding the second beam of light to precisely position the cross-sectional OCT scan. This technology corrects for saccadic movements, enables highly precise and repeatable alignment of OCT and fundus images, and also avoids the need for postacquisition motion correction. In this way several B-scans in the same location may be taken in order to distinguish dynamic blood flow from static tissue, thereby creating a map of all vasculature in which flow is detected.
Each OCT-A was simultaneously obtained along with the corresponding standard OCT B-scan; thus, both retinal/choroidal functional and morphologic images were acquired.
The OCT-A software (Heyex Software Version 1.9.201.0; Heidelberg Engineering, Heidelberg, Germany) provided an automated segmentation algorithm for the retinal and choroidal layers. All the OCT-A angiograms were carefully evaluated in order to detect potential segmentation errors. In case of segmentation errors, an experienced examiner performed a manual correction of the alignment. Variations induced by different segmentation strategies were therefore considered. The OCT-A C-scans, both obtained with the automated and the manual segmentation, were assessed in the automated quantitative analysis. In this way it was possible to determine the potential impact of segmentation errors on FAZ and vessel metrics.
For our purposes, the multiple retinal vascular planes were simplified into 2 main layers as was suggested by Snodderly and associates. The GCL is invested with 1 or more layers of capillaries, and these were termed the SCP ( Figure 1 ). The SCP was imaged by starting with the inner border of the GCL in the macular region to the inner border of the inner plexiform layer (IPL). The INL is ordinarily bracketed by a layer of capillaries on either side: these are the DCP ( Figure 1 ). The inner component of the DCP has sometimes been termed intermediate capillary plexus. According to previously reported studies, the C-scan image was segmented with the inner boundary at the outer IPL and the outer boundary was set at the outer plexiform layer (OPL). Hence the inner (so-called intermediate capillary plexus) and the outer component of the DCP were included in a single section.
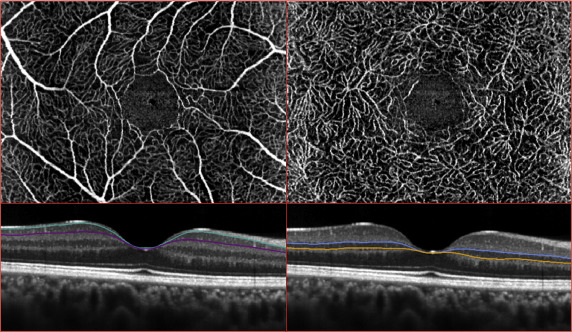
In this study, we evaluated 2 slabs per subject, from the C-scan OCT-A, in the quantitative analysis: the SCP and the DCP.
In order to have a homogeneous sample and to highlight all the decorrelated (actively perfused) structures, the selected images were obtained by the use of a maximum-intensity projection algorithm. In this way the highest-value voxel along a line of sight was used to create the display value and perfused vessels were easily detected during the quantitative assessment.
Moreover the central macular thickness (CMT, defined as the average retinal thickness in the central circular area of 1000 μm diameter) and the central macular volume (CMV, defined as the volume of the retinal tissue in the central circular area of 2000 μm diameter) were evaluated.
Automated Imaging Analysis
Each C-scan OCT angiogram was analyzed by the custom-built software AngiOCTool (Version 4.0) ( Figure 2 ). The color spectrum of all angiograms was rectified to take account of brightness and contrast variations. On an OCT-A image, vessel detection was based both on the exact identification of each decorrelated pixel and on the trajectory taken by contiguous decorrelated pixels. This process allowed to render the vessel thickness and to obtain, with a vector representation, the shape of perfused structures. The FAZ is automatically detected in a similar way by outlining a contour along the vascular rim of the perifoveal capillary arcade in case of SCP, or by connecting decorrelated pixels at a border of a central nonflow area in case of DCP. In case of errors in defining the FAZ, a manual correction of the borders was also allowed.
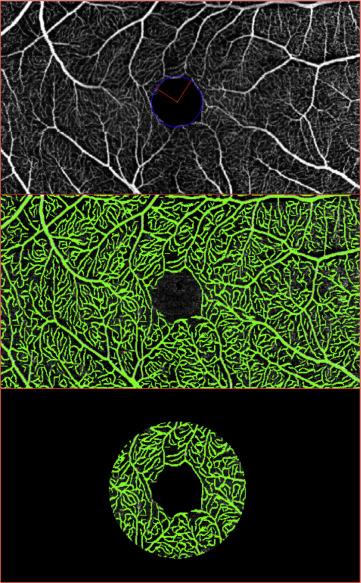
The image analysis provided several quantitative parameters: FAZ metrics (perimeter, surface, major axis, orientation), total vascular surface, and total avascular surface. These values were corrected for magnification variation associated with axial length variation as previously described.
Quantitative data were achieved within a circular area of 2000 μm diameter, centered on the FAZ. The evaluation, performed on a 2-mm-diameter area, was based on the diameter of the physiologic fovea, which is 1.85 mm, and on the relevance of this specific area for the visual function. This approach also reduced the effects of the artifacts at the edge of the C-scan.
The study subjects underwent 2 imaging sessions, performed by the same experienced operator (M.L.), within a single visit; a third session was conducted by a different examiner (F.C.) 7 days later. All scans were reviewed independently by the 2 investigators to ensure correct segmentation and sufficient image quality and these were repeated if deemed inadequate for post hoc analysis. The quantitative analyses were performed by 2 retinal specialists (G.C. and M.L.), who were masked to each other and independently evaluated the images obtained from the OCT-A scans at different time points and in different orders.
Statistical Analysis
Quantitative variables were described by their mean and standard deviation (SD). The Shapiro-Wilk test was used to check whether the sample came from a normally distributed population. The Wilcoxon-Mann-Whitney test was used to compare paired data.
As recommended by Bland and Altman, the coefficient of repeatability was defined as 2 SDs of the differences between pairs of measurements in the same subjects obtained during the same visit by the same observer, divided by the average of the means of each pair of readings. The coefficient of reproducibility was defined as 2 SDs of the difference between measurements obtained from the repetition of the test under different condition (different observer) divided by average response. Bland-Altman plots were also shown ( Figures 3 and 4 ). The Spearman rank correlation coefficient was used to measure the statistical dependence of quantitative variables. A P value of <.05 was considered as statistically significant. All statistical analyses were performed using the SAS System for Windows (release 9.4; SAS Institute Inc, Cary, North Carolina, USA).
Results
Study Population
Forty-seven eyes of 47 healthy subjects were enrolled in the study. The mean subject age was 39 years old (range: 19–66 years). There were 19 male (40.5%) and 28 female subjects (59.5%). The subject race was white in the whole sample. All participants in this study were healthy, with no systemic or ocular disorders, and had best-corrected visual acuity of 20/20. All eyes had normal foveal morphology on B-scan spectral-domain OCT, the mean CMT was 277.45 ± 22.05 μm, and mean CMV (within 2000-μm-diameter central macular area) was 1.01 ± 0.06 mm 3 .
Automated Imaging Analysis Data
The means and standard deviations of the FAZ perimeter, surface, major axis (and its orientation), and the total vascular and avascular surface, both for the superficial and deep capillary plexuses, in each of the 3 scanning sessions (2 performed by the same observer within the same day and the third one performed by a different examiner, 7 days after) are shown in Tables 1 and 2 . The absolute and relative differences between the 3 scanning sessions, for each of the examined parameters, were also shown. None of the examined parameters showed a statistically significant difference between different scanning sessions.
| Session 1 Analysis | Session 2 Analysis | Session 3 Analysis | Δ 1–2 | Δ Relative 1–2 | Δ 1–3 | Δ Relative 1–3 | ||||||||
|---|---|---|---|---|---|---|---|---|---|---|---|---|---|---|
| Mean | SD | Mean | SD | Mean | SD | Mean | SD | Mean | SD | Mean | SD | Mean | SD | |
| FAZ perimeter (μm) | 1856.66 | 369.36 | 1857.15 | 369.14 | 1856.64 | 369.53 | 0.49 | 2.70 | 0.0003 | 0.0017 | −0.02 | 2.89 | 0.0000 | 0.0020 |
| FAZ surface (mm 2 ; [μm 2 ]) | 0.28 [284 935.32] | 0.11 [105 271.54] | 0.29 [285 060.28] | 0.11 [105 281.23] | 0.28 [284 956.32] | 0.11 [105 294.04] | [124.96] | [700.04] | [0.0007] | [0.0035] | [21.00] | [744.58] | [0.0000] | [0.0038] |
| FAZ major axis (μm) | 643.98 | 120.38 | 647.74 | 121.28 | 645.74 | 117.73 | 3.77 | 9.16 | 0.0060 | 0.0137 | 1.77 | 15.59 | 0.0043 | 0.0255 |
| FAZ orientation (°) | 81.34 | 44.00 | 78.64 | 45.43 | 83.96 | 45.47 | −2.70 | 35.41 | 0.0713 | 0.7608 | 2.62 | 38.98 | 0.4201 | 2.4298 |
| Vascular surface (mm 2 ; [μm 2 ]) | 0.87 [874 684.21] | 0.06 [60 530.19] | 0.87 [874 292.43] | 0.06 [60 074.03] | 0.87 [874 426.40] | 0.06 [60 334.52] | [−391.79] | [2432.87] | [−0.0004] | [0.0027] | [−257.81] | [1669.37] | [−0.0003] | [0.0019] |
| Avascular surface (mm 2 ; [μm 2 ]) | 1.98 [1 981 972.34] | 0.10 [101 354.27] | 1.98 [1 982 239.26] | 0.10 [101 472.77] | 1.98 [1 982 215.57] | 0.10 [101 576.58] | [266.91] | [2485.86] | [0.0001] | [0.0013] | [243.23] | [1825.07] | [0.0001] | [0.0009] |
| Vascular density (%) | 27.84 | 1.93 | 27.83 | 1.91 | 27.83 | 1.92 | ||||||||
Stay updated, free articles. Join our Telegram channel

Full access? Get Clinical Tree


