Purpose
To study the change in spherical equivalent and other ocular parameters 1 year after stopping the administration of atropine.
Design
Prospective randomized double-masked clinical trial.
Methods
We assigned 400 myopic children, 6 to 12 years of age, to receive atropine 0.5%, 0.1% or 0.01% for 24 months, after which medication was stopped. Parents and children gave informed consent to participate in the research. Children were reviewed at 26, 32 and 36 months, and changes in cycloplegic spherical equivalent (SE), axial length (AL), visual acuity, pupil size, and accommodation were assessed.
Results
Of the children, 356 (89%) entered into the washout phase. At entry, there was no significant difference in age, gender, SE, or AL among the children in the various atropine groups. Over the following 12 months, myopic progression was greater in the 0.5% eyes (−0.87 ± 0.52 D), compared to the 0.1% (−0.68 ± 0.45 D) and 0.01% eyes (−0.28 ± 0.33 D, P < 0.001). AL growth was also greater in the 0.5% (0.35 ± 0.20 mm) and 0.1% (0.33 ± 0.18 mm) eyes, compared to the 0.01% eyes (0.19 ± 0.13 mm, P < 0.001). Pupil size and near visual acuity returned to pre-atropine levels in all groups, but accommodation at 36 months was less in the 0.5% eyes (13.24 ± 2.72 D) compared to the 0.1% (14.45 ± 2.61 D) and 0.01% eyes (14.04 ± 2.90 D, P < 0.001). The overall increase in SE over the entire 36 months in the 0.5%, 0.1% and 0.01% groups was −1.15 ± 0.81 D, −1.04 ± 0.83 D and −0.72 ± 0.72 D, respectively ( P < 0.001).
Conclusion
There was a myopic rebound after atropine was stopped, and it was greater in eyes that had received 0.5% and 0.1% atropine. The 0.01% atropine effect, however, was more modulated and sustained.
Atropine has been shown in several studies to slow myopia progression in children. In the Atropine Treatment of Myopia trials (ATOM1 and ATOM2), atropine 1.0%, 0.5%, 0.1%, and 0.01% slowed myopia progression by 80%, 75%, 70%, and 60%, respectively, over the first 24 months compared to placebo-treated eyes. The mean changes in spherical equivalents were −0.28 ± −0.69; −0.30 ± 0.60; −0.38 ± 0.60; and −0.49 ± 0.63 diopters (D), respectively, compared to −1.20 ± 0.69 D in placebo-treated eyes. However, in the ATOM1 study, when atropine 1.0% was stopped, there was a rebound in myopia of −1.14 ± 0.80 D in those eyes, so that the overall change in spherical equivalent (SE) in atropine-treated eyes was −1.37 ± 0.78 D compared to −1.56 ± 0.89 D in placebo-treated eyes at 36 months.
We report here the phase 2 results of our ATOM2 study. The aim of phase 2 was to assess changes in SE, axial length (AL), pupil size, accommodation, and visual acuity in eyes treated with atropine 0.01%, 0.1% and 0.5% after cessation of medication immediately following phase 1 of our ATOM2 study.
Methods
The results described are based on a 12-month washout period after the phase 1 stage of the ATOM2 study, a randomized double-masked control study. In phase 1 of this study, 400 children (aged 6 to 12 years) with myopia ≥2.0 D, astigmatism of <1.50 D and documented myopic progression of ≥0.50 D over the past year were randomized to daily 0.01%, 0.1% or 0.5% atropine in a 1:2:2 ratio in 6 gender and age strata to ensure an equal gender-age balance among the groups. Study investigators, parents and children were all masked to the dosage of atropine assigned throughout the entire 5-year study period. The study was conducted according to the tenets of the Declaration of Helsinki. Ethics approval was obtained from the Singapore Eye Research Institute Review Board, and the study was registered with the ClinicalTrial.gov website (registration no: NTC00371124). Parents and children gave informed consent to participate in the research.
Methods used in this first phase are described in detail elsewhere. Briefly, children were reviewed at 4, 8, 12, 16, 20, and 24 months. In phase 2, the washout phase, children were reviewed at 26, 32 and 36 months. At each visit, best-corrected visual acuity for distance and near, accommodation, pupil size under mesopic and photopic conditions, cycloplegic autorefraction, and ALs were measured. Distance vision was assessed using the Early Treatment Diabetic Retinopathy study chart and recorded as a logarithm of the minimum angle of resolution (logMAR). Near vision was tested using a reduced logMAR chart at 40 cm. Accommodation was measured using a Royal Air Force near-point rule with accommodation amplitude calculated as the inverse of the near point of accommodation. Mesopic and photopic pupil sizes were measured using the Procyon 3000 pupillometer (Lion House, London, UK) and the neuroptic pupillometer (Neuroptics, Irvine, CA, USA) under 4 and 300 lux illumination, respectively.
Cycloplegia was achieved with 3 drops of cyclopentolate 1% (Cyclogyl; Alcon-Convreur, Rijkswerg, Belgium) administered at 5-minute intervals. Cycloplegic auto-refraction was then determined, 30 minutes after the last drop, using the Canon RK-F1 autorefractor (Canon, Tochigiken, Japan). Five readings, all of which were ≤0.50 D apart, were averaged, and SE was calculated as sphere plus half cylinder power. AL was measured using the Zeiss IOLMaster (Carl Zeiss Meditec, Dublin, CA, USA). Five AL readings, all of which were <0.05 mm apart, were averaged.
Statistical Analysis
All analyses were based on the intention-to-treat principle and were performed using the statistical software Stata (v 10.1; Stata, College Station, TX, USA). The demographic information, such as age and gender, was reported at the beginning of the washout period (ie, the second annual visit). The mean and the standard deviation (SD) were summarized according to the atropine-dosage group for continuous variables, and analysis of variance (ANOVA) was used to test the mean difference among atropine groups. For the categorical variables, the number and the proportion were summarized by atropine group, and the Fisher exact test was used to test for the difference in proportion among atropine groups.
For the measured ocular parameters, the intraclass correlation between 2 eyes was examined for the screening visit (pre-atropine) or the baseline visit (after having taken atropine for 2 weeks), the second annual visit, the 26-month visit, the 32-month visit, and the 36-month visit. With the measurements of both eyes pooled together, the mean and the SD of the ocular parameters were reported at these visits for each atropine-dosage group. When comparing the effect across atropine groups, the measurements from both eyes were pooled in a combined analysis using the Huber-White robust standard errors, in order to allow for the correlation between eyes within each person. The corresponding P value was reported for the global null hypothesis of no difference among atropine groups. For spherical equivalent and AL, the changes from the baseline visit or the second annual visit to the 36-month visit were studied similarly. In addition, for each atropine group, the change in spherical equivalent and the change in axial length were plotted over visits until the 36-month visit.
Results
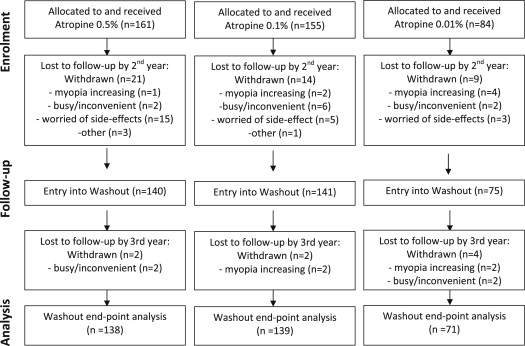
We studied 356 children (89%) who entered into the phase 2 washout phase of the ATOM2 study, with 75, 141 and 140 children in the 0.01%, 0.1% and 0.5% atropine groups, respectively ( Fig. 1 ). At the 24-month visit, there was no significant difference in age, gender, SE, or AL in the children in each group ( Table 1 ).
| ICC | Atropine 0.01% | Atropine 0.1% | Atropine 0.5% | P value | |
|---|---|---|---|---|---|
| Age at 24 months (yr), mean (SD) | – | 11.65 (1.44) | 11.68 (1.52) | 11.73 (1.53) | 0.9368 |
| Female, n (%) | – | 36 (48.00) | 67 (47.52) | 67 (47.86) | 1.000 a |
| Spherical equivalent (SE) (D) | Mean (SD) | Mean (SD) | Mean (SD) | ||
| Baseline | 0.93 | −4.47 (1.50) | −4.49 (1.45) | −4.33 (1.83) | 0.6704 |
| 24 months | 0.90 | −5.10 (1.51) | −4.85 (1.29) | −4.70 (1.70) | 0.2027 |
| 26 months | 0.91 | −5.14 (1.50) | −5.00 (1.29) | −4.97 (1.69) | 0.7214 |
| 32 months | 0.91 | −5.31 (1.57) | −5.36 (1.32) | −5.42 (1.74) | 0.8852 |
| 36 months | 0.91 | −5.32 (1.55) | −5.53 (1.34) | −5.57 (1.74) | 0.5088 |
| Change of SE (D) | |||||
| 24 to 36 months | 0.82 | −0.28 (0.33) | −0.68 (0.45) | −0.87 (0.52) | <0.0001 |
| Baseline to 36 months | 0.87 | −0.72 (0.72) | −1.04 (0.83) | −1.15 (0.81) | 0.0002 |
| Axial length (AL) (mm) | |||||
| Baseline | 0.96 | 25.17 (0.98) | 25.13 (0.83) | 25.14 (0.92) | 0.9352 |
| 24 months | 0.95 | 25.68 (1.01) | 25.39 (0.82) | 25.43 (0.97) | 0.0821 |
| 26 months | 0.95 | 25.71 (1.01) | 25.46 (0.82) | 25.50 (0.98) | 0.1602 |
| 32 months | 0.95 | 25.81 (1.05) | 25.62 (0.84) | 25.67 (0.99) | 0.4054 |
| 36 months | 0.95 | 25.84 (1.05) | 25.71 (0.85) | 25.77 (1.00) | 0.6498 |
| Change in AL ( mm) | |||||
| 24 to 36 months | 0.86 | 0.19 (0.13) | 0.33 (0.18) | 0.35 (0.20) | <0.0001 |
| Baseline to 36 months | 0.89 | 0.58 (0.38) | 0.60 (0.38) | 0.61 (0.35) | 0.7871 |
Analysis showed that 44 children (11%) were lost to follow-up by the 24-month visit. These children were found to have similar ages (9.7 ± 1.5 vs 9.7 ± 1.9 years, P = 0.99); similar ALs (25.01 ± 0.97 vs 25.18 ± 1.59 mm, P = 0.264); and similar spherical equivalents at baseline (−3.89 ± 1.82 vs −4.48 ± 1.59 D, P = 0.052) to those still in the study. By 36 months, 52 children (13%) had been lost to follow-up (15.5%, 10.3% and 14.3% in the 0.01%, 0.1% and 0.5% groups, respectively). These children had similar ages and ALs at baseline but had lower levels of myopia (−3.89 ± 1.76 vs −4.49 ± 1.59D, P = 0.037) at baseline.
Change in Spherical Equivalent and Axial Length
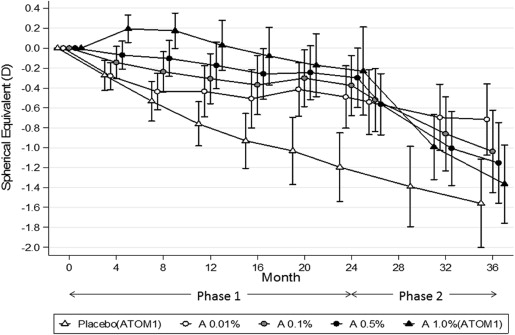
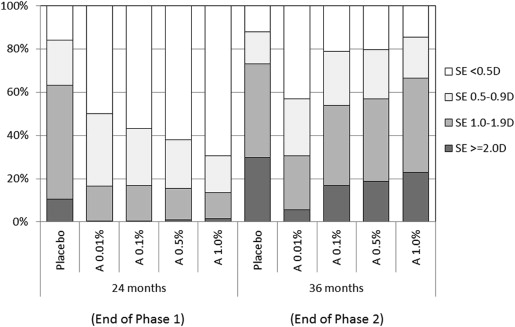
On cessation of atropine, a myopic rebound was noted in all 3 groups that was statistically greater in 0.5% eyes (−0.87 ± 0.52 D) than in 0.1% (−0.68 ± 0.45 D) and 0.01% (−0.28 ± 0.33D) eyes ( P < 0.001) ( Table 1 ; Fig. 2 ). The increase was greater in the first 8 months and slowed over the next 4 months. This resulted in overall progression over the 36-month period being significantly less in the 0.01% eyes (−0.72 ± 0.72 D) than in the 0.1% (−1.04 ± 0.83 D) and 0.5% eyes (−1.15 ± 0.81 D) ( Table 1 , Fig. 2 ). A larger proportion of children in the higher dose atropine groups also had greater increases in myopia between 24 and 36 months compared to the 0.01% group ( Fig. 3 ).
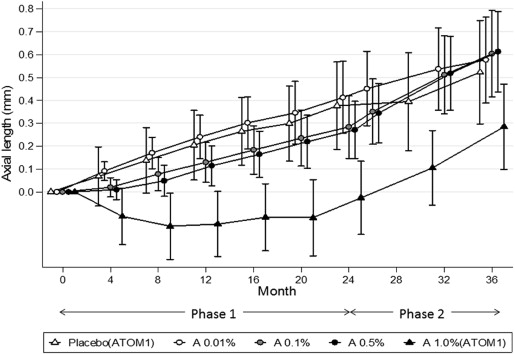
With regard to AL, during the phase 2 period, there was a significantly greater increase in AL in the 0.5% (0.35 mm) and 0.1% eyes (0.33 mm) compared to the 0.01% (0.19 mm) eyes ( P < 0.0001) ( Table 1 ). However, the overall change from baseline to 36 months was similar in all groups ( P = 0.787) ( Fig. 4 ).
Change in Pupil Size, Accommodation and Distance/Near Vision
Photopic and mesopic pupil sizes were much larger in the 0.1% and 0.5% groups compared to the 0.01% group at 24 months (end of phase 1). In phase 2, upon cessation of atropine, there was a reduction in pupil size in all groups, with recovery being quicker in the 0.01% eyes. There was no difference in pupil size among groups at 36 months, but the pupil sizes were slightly smaller (photopic, 0.37 mm; mesopic, 0.22 mm) than those noted at the first screening visit ( P < 0.001, for both photopic and mesopic) in all 3 groups.
Recovery of accommodation also occurred in all groups but was again quicker in the 0.01% eyes (26 months) than in the 0.1% and 0.5% eyes (32 months). At 36 months, however, accommodation in the 0.5% eyes was still significantly less than that in the 0.1% and 0.01% eyes ( P < 0.001). Accommodation in all groups at 36 months was also −2.56 D less than that recorded at screening visit 3 years earlier ( P < 0.001).
Distance logMAR visual acuity remained good throughout the first phase and continued to remain unchanged through the washout period in all 3 groups ( Table 2 ). Near logMAR visual acuity was reduced in the 0.1% and 0.5% eyes at 24 months but had recovered quickly and completely by 26 months in all 3 groups.
| ICC | Atropine 0.01% mean (SD) | Atropine 0.1% mean (SD) | Atropine 0.5% mean (SD) | P value | |
|---|---|---|---|---|---|
| Pupil size (mesopic) (mm) | |||||
| Screening (pre-atropine) | 0.64 | 4.66 (0.71) | 4.58 (0.69) | 4.58 (0.68) | 0.6353 |
| 24 months | 0.93 | 5.50 (0.80) | 6.89 (0.99) | 7.76 (1.10) | <0.0001 |
| 26 months | 0.81 | 4.39 (0.65) | 4.49 (0.81) | 4.62 (0.78) | 0.0507 |
| 32 months | 0.76 | 4.33 (0.79) | 4.20 (0.64) | 4.29 (0.67) | 0.3177 |
| 36 months | 0.81 | 4.19 (0.74) | 4.20 (0.72) | 4.23 (0.64) | 0.8894 |
| Pupil size (photopic) (mm) | |||||
| Screening (pre-atropine) | 0.94 | 3.90 (0.57) | 3.94 (0.63) | 4.03 (0.66) | 0.2117 |
| 24 months | 0.96 | 5.07 (0.92) | 6.66 (1.07) | 7.55 (1.20) | <0.0001 |
| 26 months | 0.95 | 3.91 (0.74) | 4.00 (0.67) | 4.16 (0.67) | 0.0245 |
| 32 months | 0.96 | 3.85 (0.70) | 3.83 (0.76) | 3.90 (0.64) | 0.6453 |
| 36 months | 0.94 | 3.76 (0.59) | 3.69 (0.55) | 3.75 (0.58) | 0.6089 |
| Accommodation (D) | |||||
| Screening (pre-atropine) | 0.86 | 16.17 (3.38) | 16.83 (3.00) | 15.81 (3.43) | 0.0128 |
| 24 months | 0.95 | 11.78 (3.20) | 6.81 (3.38) | 4.10 (2.60) | <0.0001 |
| 26 months | 0.91 | 14.65 (3.19) | 13.85 (3.41) | 12.42 (3.52) | <0.0001 |
| 32 months | 0.90 | 14.48 (3.10) | 14.25 (2.88) | 13.50 (3.23) | 0.0401 |
| 36 months | 0.91 | 14.04 (2.90) | 14.45 (2.60) | 13.24 (2.72) | 0.0006 |
| Distance logMAR visual acuity | |||||
| Screening (pre-atropine) | 0.72 | 0.02 (0.05) | 0.01 (0.06) | 0.02 (0.06) | 0.3872 |
| 24 months | 0.76 | 0.00 (0.06) | 0.01 (0.05) | 0.01 (0.06) | 0.2468 |
| 26 months | 0.71 | −0.01 (0.05) | 0.00 (0.06) | 0.01 (0.05) | 0.1499 |
| 32 months | 0.73 | −0.01 (0.05) | 0.00 (0.06) | 0.01 (0.06) | 0.0300 |
| 36 months | 0.67 | −0.01 (0.05) | −0.01 (0.05) | 0.00 (0.05) | 0.3822 |
| Near logMAR visual acuity | |||||
| Screening (pre-atropine) | 0.66 | 0.04 (0.09) | 0.05 (0.08) | 0.04 (0.07) | 0.5648 |
| 24 months | 0.74 | 0.02 (0.07) | 0.11 (0.17) | 0.29 (0.18) | <0.0001 |
| 26 months | 0.83 | −0.02 (0.07) | 0.00 (0.08) | 0.02 (0.08) | 0.0004 |
| 32 months | 0.72 | −0.01 (0.05) | −0.01 (0.06) | −0.01 (0.07) | 0.8660 |
| 36 months | 0.74 | −0.01 (0.05) | −0.02 (0.06) | −0.01 (0.06) | 0.3947 |
Stay updated, free articles. Join our Telegram channel

Full access? Get Clinical Tree


