Purpose
To investigate the relationship between known risk factors for age-related macular degeneration (AMD) progression and foveolar choroidal circulation in eyes with nonexudative AMD.
Design
Cross-sectional study of nonexudative AMD.
Methods
Laser Doppler flowmetry measurements of relative choroidal blood velocity, choroidal blood volume (ChBVol), and choroidal blood flow (ChBFlow) were obtained in the center of the fovea of 273 study eyes of 204 AMD patients investigated at the Scheie Eye Institute, University of Pennsylvania Medical School. All study eyes had visual acuity of 20/40 or better, good fixation, no other intraocular pathologic features, and no evidence of choroidal neovascularization. RPE hypertrophy was determined from color fundus photographs by trained masked graders at the Scheie Image Reading Center. Correlation analysis and multivariate linear regression analysis with adjustments for significant covariates were carried out.
Results
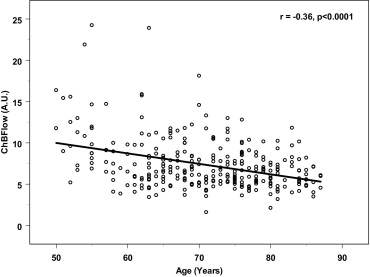
A significant inverse correlation was observed between age and ChBFlow ( r = −0.36; P < .0001), and ChBVol ( r = −0.28; P < .0001), but not for choroidal blood velocity. A significant inverse correlation was observed between spherical equivalent and ChBFlow ( r = −0.21; P = .006) and ChBVol ( r = −0.14; P = .04), but not for choroidal blood velocity. ChBFlow and ChBVol were significantly lower in patients with a history of hypertension ( P ≤ .003) and in eyes with retinal pigment epithelium hypertrophy ( P ≤ .04), respectively.
Conclusions
All the above-described risk factors for AMD development and progression are associated with decreased choroidal circulatory parameters, suggesting that decreases in choroidal circulatory parameters may be involved in the development of AMD.
Age-related macular degeneration (AMD) is the leading cause of severe visual impairment and blindness among the elderly worldwide and in developed countries. In the United States, 1.75 million people are affected by AMD, and its incidence increases with age. By the year 2020, an estimated of 2.95 million people are expected to be affected by AMD. AMD is a multifactorial disease that involves a complex interaction of metabolic and functional changes and risk factors that affect the progression of the disease and its response to various treatment methods.
The risk factors for AMD can be categorized as demographic, environmental, and genetic. The strongest risk factor associated with the development and progression of AMD is increasing age; all population-based studies confirm that the incidence, prevalence, and progression of AMD increase with advancing age. Another established risk factor is cigarette smoking; numerous case-control studies, cohort studies, and cross-sectional studies have found a statistically significant association between smoking and the development and progression of AMD.
The association between AMD and systemic hypertension (SHTN) also has been investigated. Some studies have showed that SHTN is a strong risk factor for AMD and choroidal neovascularization, whereas other studies have failed to demonstrate statistically significant associations. History of kidney disease, hyperopia, retinal pigment epithelium (RPE) abnormalities, light iris color, and female gender have been shown to be associated with AMD or choroidal neovascularization (CNV) in different studies.
Previous cross-sectional studies performed in our laboratory suggested that foveolar choroidal blood flow decreases progressively with increasing severity of AMD. In addition, a longitudinal study has reported that lower baseline choroidal blood flow parameters are associated with future development of CNV and decrease in vision. Furthermore, decreases in choroidal circulatory parameters were detected before the development of CNV. All these findings have suggested a role for circulatory abnormalities in the development and progression of AMD. In an attempt to elucidate this role further, we investigated the relationship between the above-mentioned risk factors for AMD and foveolar choroidal circulation.
Methods
We included in the study AMD patients examined at Scheie Eye Institute, Department of Ophthalmology, University of Pennsylvania, who were 50 years of age or older. All subjects were informed about the study and were asked to sign appropriate consent forms before the enrollment. All study eyes had visual acuity of 20/40 or better and had no evidence of CNV. A visual acuity of 20/40 or better was required to ensure appropriate fixation for optimal foveolar blood flow measurements. All subjects had clear ocular media, pupillary dilatation of 5 mm or more, steady fixation, and intraocular pressure of less than 21 mm Hg in the study eyes. Patients with intraocular pathologic features or history of intraocular disease other than AMD, as well as patients with diabetes mellitus, were excluded from the study.
A structured questionnaire was used to obtain information on age; gender; race; history of smoking; medical history, including history of SHTN, cardiovascular disease, and kidney disease; and ocular history, including eye color and family history of AMD. All subjects underwent a complete ocular examination, including visual acuity, applanation tonometry, and slit-lamp biomicroscopy. After pupillary dilatation with tropicamide 1% (Alcon, Fort Worth, Texas, USA) and phenylephrine hydrochloride 10% (Sanofi Winthrop, New York, New York, USA), a fundus examination was performed by an ophthalmologist, and stereo fundus photography of the disc and macula were obtained by a trained photographer.
Laser Doppler flowmetry measurements (Oculix Instrument, Huntingdon Valley, Pennsylvania, USA) of the choroidal circulation were performed in the center of the foveola to assess relative choroidal blood velocity, choroidal blood volume, and choroidal blood flow. These parameters mainly represent choriocapillaris flow. Details about the method used have been described in previous publications. Subjects were seated in front of the laser Doppler flowmetry camera in a darkened room and were asked to fixate for 3 periods of 30 seconds on the aiming laser beam. A 200-μm diameter diode laser beam (670 μm) with an intensity of 20 mW at the cornea was delivered through a fundus camera (model TRC; Topcon, Tokyo, Japan). To enable the observation of the position of the laser on the foveola, light with a retinal irradiance of approximately 0.03 mW/cm 2 and a wavelength of 570 nm constantly illuminated the posterior retina (30 degrees in diameter). Choroidal blood velocity and choroidal blood volume were obtained independently with the laser Doppler flowmetry instrument. Choroidal blood velocity was proportional to the mean velocity of the red blood cells within the volume sampled by the laser light, and choroidal blood volume was proportional to the number of red blood cells in the measured sample. Choroidal blood flow was calculated by the instrument according to the formula: Choroidal blood flow = Constant × Choroidal blood velocity × Choroidal blood volume. Choroidal blood velocity, choroidal blood volume, and choroidal blood flow are all shown in arbitrary units (A.U.).
Immediately after blood flow measurements, while subjects were still seated, brachial artery systolic and diastolic blood pressures were determined by sphygmomanometry (Accutorr 1A; Datascope, Paramus, New Jersey, USA) using a standardized protocol. Intraocular pressure then was measured by Goldmann applanation tonometry. The mean of brachial artery pressure (BPm) was calculated according to the formula: BPm = diastolic blood pressure (BPd) + 1/3 (systolic blood pressure (BPs) − BPd).
Analysis of the blood flow data was performed by a masked observer using software specifically developed for the analysis of Doppler signals from ocular tissues. Only parts of the recordings that showed stable circulatory parameters were selected for analysis. An average of approximately 12 seconds of measurements for each study eye was analyzed. We calculated a coefficient of variability (CV) for each study eye derived from 3 subsequent measurements to assess the reproducibility of the blood flow data. CV was calculated by the formula: CV = (SD/mean) × 100%, where SD represents standard deviation from 3 replicated measurements. The mean CV was 12.8% (SD, 8.4%) for choroidal blood volume, 8.7% (SD, 6.8%) for choroidal blood velocity, and 9.9% (SD, 6.4%) for choroidal blood flow.
An average of the 3 measurements for each choroidal circulatory parameter was calculated and was used in data analysis. Correlation analysis and multivariate linear regression analysis with adjustment for significant covariates were carried out. The association between each blood flow parameter and a specific risk factor first was tested separately by a univariate analysis. Risk factors with a P value < .10 from univariate analysis were included in the multivariate regression analysis, which was simplified further by including only the significant risk factors with P < .05. The association of circulatory parameters with each of the studied risk factors was assessed by using the generalized estimating equations approach to linear regression to adjust for the correlation between eyes of the same patient. Calculations were executed by using PROC GENMOD (SAS version 9.1; SAS Institute, Cary, North Carolina, USA), and an exchangeable working correlation structure was used to describe the correlation in circulatory measurements between paired eyes of each patient.
Fundus photographs were graded in a masked fashion at the Scheie Image Reading Center at the University of Pennsylvania by a trained grader (E.R.M.). Gradings of drusen characteristics and RPE hypertrophic changes in the study eyes were performed according to the Complications of Age-Related Macular Degeneration Prevention Trial protocol.
Results
A total of 269 nonexudative AMD eyes from 204 participants were included in this study. Participant ages ranged from 50 to 87 years (mean, 71 years; SD, 8.9 years). One hundred ninety-six (96.1%) were white, 6 were black, 1 was Asian, and 1 was Hispanic. One hundred fourteen (55.9%) participants were female. Thirteen participants (6.4%) were current smokers at the time of laser Doppler flowmetry measurement. A history of SHTN was present in 91 (44.6%) study participants; 126 (61.8%) participants had a history of cardiac disease, and 18 (8.8%) participants had a history of kidney disease. RPE hypertrophy was observed in 157 (58.4%) study eyes ( Table 1 ).
| Risk Factors | No. and Distribution (%) of Study Patients or Eyes | ChBVol | ChBVel | ChBFlow | |||
|---|---|---|---|---|---|---|---|
| Mean (SE) a | P Value | Mean (SE) a | P Value | Mean (SE) a | P Value | ||
| Age range (years) | .03 | 0.91 | .002 | ||||
| 50 to 60 | 22 (10.8) | 0.29 (0.02) | 0.39 (0.02) | 9.58 (0.76) | |||
| 61 to 70 | 63 (30.9) | 0.24 (0.01) | 0.38 (0.01) | 7.65 (0.44) | |||
| 71 to 80 | 86 (42.2) | 0.21 (0.01) | 0.38 (0.01) | 6.90 (0.28) | |||
| 80+ | 33 (16.2) | 0.21 (0.01) | 0.38 (0.01) | 6.30 (0.38) | |||
| Gender | .40 | 0.45 | .87 | ||||
| Male | 90 (44.1) | 0.23 (0.01) | 0.38 (0.01) | 7.33 (0.29) | |||
| Female | 114 (55.9) | 0.24 (0.01) | 0.38 (0.01) | 7.40 (0.33) | |||
| Eye color | .51 | 0.43 | .80 | ||||
| Blue | 65 (31.9) | 0.22 (0.01) | 0.39 (0.01) | 7.01 (0.28) | |||
| Brown | 71 (34.8) | 0.24 (0.01) | 0.37 (0.01) | 7.55 (0.39) | |||
| Hazel | 41 (20.1) | 0.23 (0.02) | 0.38 (0.03) | 7.54 (0.53) | |||
| Green | 20 (9.8) | 0.24 (0.02) | 0.38 (0.01) | 7.30 (0.69) | |||
| Gray/unknown | 7 (3.4) | 0.24 (0.05) | 0.37 (0.02) | 7.96 (1.88) | |||
| Current smoking | .08 | 0.11 | .39 | ||||
| No | 191 (93.6) | 0.23 (0.01) | 0.38 (0.01) | 7.32 (0.23) | |||
| Yes | 13 (6.4) | 0.27 (0.02) | 0.36 (0.01) | 7.97 (0.69) | |||
| Systemic hypertension | .009 | 0.48 | .005 | ||||
| No | 112 (54.9) | 0.25 (0.01) | 0.38 (0.01) | 7.86 (0.31) | |||
| Yes | 91 (44.6) | 0.21 (0.01) | 0.38 (0.01) | 6.67 (0.27) | |||
| Cardiac disease | .80 | 0.55 | .44 | ||||
| No | 78 (38.2) | 0.23 (0.01) | 0.38 (0.01) | 7.56 (0.34) | |||
| Yes | 126 (61.8) | 0.23 (0.01) | 0.38 (0.01) | 7.23 (0.28) | |||
| Kidney disease | .09 | 0.41 | .15 | ||||
| No | 186 (91.2) | 0.24 (0.01) | 0.38 (0.01) | 7.44 (0.23) | |||
| Yes | 18 (8.8) | 0.20 (0.02) | 0.39 (0.01) | 6.58 (0.52) | |||
| Systolic BP (mm Hg) | — | −0.0002 (0.0003) | .53 | 0.0005 (0.0002) | 0.047 | 0.003 (0.01) | .77 |
| Diastolic BP (mm Hg) | — | −0.0001 (0.0005) | .84 | 0.0014 (0.0004) | 0.001 | 0.02 (0.02) | .16 |
| Mean BP (mm Hg) | — | −0.0002 (0.0004) | .65 | 0.0008 (0.0004) | 0.04 | 0.01 (0.01) | .31 |
| RPE hypertrophy | .02 | 0.62 | .03 | ||||
| No | 112 (41.6) | 0.25 (0.01) | 0.38 (0.01) | 7.98 (0.39) | |||
| Yes | 157 (58.4) | 0.22 (0.01) | 0.39 (0.01) | 6.91 (0.29) | |||
| Mean (SD) of risk factor | |||||||
| Systolic BP (mm Hg; as continuous) | 136 (21.6) | −0.0002 (0.0003) | .53 | 0.0005 (0.0002) | 0.047 | 0.00 (0.01) | .77 |
| Diastolic BP (mm Hg; as continuous) | 74 (12.2) | −0.0001 (0.0005) | .84 | 0.0014 (0.0004) | 0.001 | 0.0 (0.02) | .16 |
| Mean BP (mm Hg; as continuous) | 95 (14.0) | −0.0002 (0.0004) | .65 | 0.0008 (0.0004) | 0.04 | 0.01 (0.01) | .31 |
| Spherical equivalent (D; as continuous) | 0.51 (2.06) | −0.007 (0.003) | .04 | −0.004 (0.003) | 0.16 | −0.31 (0.11) | .006 |
a ChBFlow, ChBVel, and ChBVol are shown in arbitrary units (A.U.).
A statistically significant association was observed between the risk factors: age, SHTN, spherical equivalent or RPE hypertrophy, and choroidal blood volume or choroidal blood flow ( Table 1 ; Figures 1 through 6 ). No significant associations were detected between the above risk factors and choroidal blood velocity ( Table 1 ).
Stay updated, free articles. Join our Telegram channel

Full access? Get Clinical Tree


