Purpose
To investigate the progression of vascular lesions of polypoidal choroidal vasculopathy (PCV) as viewed with indocyanine green angiography and the visual prognosis of these eyes.
Design
Retrospective case study.
Methods
We reviewed retrospectively the medical records of 88 consecutive patients (88 eyes) with PCV who had been examined with indocyanine green angiography for more than 2 years.
Results
Depending on the initial area of the vascular lesion, eyes were divided into smaller PCV (baseline area of lesion being < 1 disc area [DA], n = 22) and larger PCV (baseline area of lesion being ≥ 1 DA, n = 66). In larger PCV, the mean area of the lesion progressed significantly from 6.49 ± 8.96 mm 2 to 16.27 ± 14.19 mm 2 ( P < .0001) with marked deterioration of visual acuity ( P < .0001) during follow-up. In contrast, smaller PCV often showed minimal progression of the lesion, only limited exudative change, and the eyes maintained their initially good vision to the final visit. Smaller PCV lesions rarely progressed to extensive PCV lesions. Severe vision-threatening complications (ie, suprachoroidal hemorrhage, vitreous hemorrhage, and tears of the retinal pigment epithelium) were seen only in eyes with larger PCV, and in studying single nucleotide polymorphisms A69S of ARMS2 genes, there was a significant difference in T allele frequency between individuals with smaller PCV and those with larger PCV (20.2% vs 79.8%; P = .0235).
Conclusions
PCV with small vascular lesions shows minimal progression and no vision-threatening complications, and these eyes often maintain good visual acuity for a long time.
Polypoidal choroidal vasculopathy (PCV) first was described as a new clinical entity with a unique form of choroidal vascular abnormality and is characterized by a branching vascular network that terminates in polypoidal lesions seen by indocyanine green angiography. Initially, vascular components of PCV are reported to be seen predominantly in a peripapillary location, but macular PCV and peripheral PCV since have been reported. Yannuzzi and associates expanded the clinical spectrum of this disease and established the current understanding of PCV. Today, macular PCV is more common in Asian populations and seems to be the condition most clinically significant. To date, however, the pathogenesis of PCV is not understood fully, and it is still controversial whether it originates from an abnormality of the inner choroidal vessels or if it is a variant of choroidal neovascularization (CNV).
PCV is accompanied often by recurrent serosanguineous detachments of the retinal pigment epithelium and neurosensory retina, and sometimes results in massive hemorrhagic complications with a sudden loss of vision. Although the extent of visual disturbance in PCV varies, it generally is thought that the visual prognosis of PCV is better than that of exudative age-related macular degeneration (AMD). In a previous report by Uyama and associates, approximately half of the patients with PCV had a favorable visual outcome (better than 20/30) after being followed-up for more than 2 years. In PCV, other vision-threatening complications, such as type 2 CNV, disciform scar, or cystoid macular edema, are reported to be uncommon.
Clinically, the size of the vascular lesions in PCV varies. We sometimes see cases of PCV with a large lesion that show a poor response to the treatment and show progression of the lesion, resulting in poor visual prognosis. Tateiwa and associates reported that PCV with a large vascular network that extends beyond the vascular arcade is not uncommon, so we may speculate that vascular lesions of originally small PCV extend over time and result in these large PCV. Clinically, however, we rarely see this type of progression. PCV cases with a small lesion often show minimal exudative change and no progression of the lesion and can maintain good visual function for a long time. Even with an exudative change, small PCV often show a favorable response to treatment. Okubo and associates reported that a reddish-orange nodule alone, or that multiple reddish-orange nodules with a small subretinal hemorrhage, is a sign of a potentially benign clinical course, so the clinical course of small and large PCV may be different.
To study the progression of vascular lesions in PCV, it is essential to perform repeated indocyanine green angiography, because most vascular lesions of PCV are located beneath the retinal pigment epithelium. So far, however, there is little information on the long-term observation of the vascular components of PCV. In the study described herein, we investigated progression of the vascular lesion of PCV using indocyanine green angiography and visual prognosis of affected eyes. Based on our findings, we report a new classification of PCV and the expected complications and visual prognosis of these 2 types of PCV.
Methods
For this observational case study, we reviewed retrospectively the medical records of 88 consecutive patients (88 eyes) with symptomatic PCV who initially visited the Macula Service of the Department of Ophthalmology at Kyoto University Hospital between January 2004 and October 2007 and who had been examined with both fluorescein and indocyanine green angiography for more than 2 years after their initial visit. When both eyes were diagnosed as having PCV, 1 eye was selected randomly for inclusion in the current study.
The diagnosis of PCV was based on indocyanine green angiography, which shows a branching vascular network that terminates in polypoidal swelling. The polypoidal lesion can be a single polyp or a cluster of multiple polyps. In most cases, the reddish-orange nodule that had been seen by the ophthalmoscopic examination corresponded to the polypoidal lesion. Eyes with other macular abnormalities (ie, AMD, pathologic myopia, idiopathic CNV, presumed ocular histoplasmosis, angioid streaks, and other secondary CNV) were excluded from the current study. Eyes that were treated previously with focal laser photocoagulation, photodynamic therapy (PDT), vitrectomy, radiation therapy, or anti–vascular endothelial growth factor (VEGF) therapy also were excluded from the present study.
At the initial visit, all patients underwent a comprehensive ophthalmologic examination, including measurement of best-corrected visual acuity (VA), determination of intraocular pressure, indirect ophthalmoscopy, slit-lamp biomicroscopy with a contact lens, and optical coherence tomography (OCT). After fundus photographs were obtained, fluorescein and indocyanine green angiography were performed on each patient using a confocal laser scanning system (HRA-2; Heidelberg Engineering, Dossenheim, Germany). In all patients, VA measurement and OCT examination were performed at each follow-up visit. At follow-up visits, angiography was performed if necessary, although all patients in the current study were examined with angiography several times during follow-up. In the study described herein, the angiograms obtained at the initial visit were compared with the final angiograms.
In the current study, greatest linear dimension and area of the lesion were determined based on the indocyanine green angiography, using the software built into the HRA-2 machine. Greatest linear dimension included the entire PCV vascular lesion, including polypoidal lesion, branching vascular network vessels, and any type 2 CNV. The area of the vascular lesion was measured manually with the software that came with the HRA-2. The pigment epithelial detachment, without underlying vascular components, was not included in measurement of the greatest linear dimension and area of the lesion. In the current study, 1 optic disc area (DA) is equal to 2.54 mm 2 , on the basis of 1 optic disc diameter being equal to 1.8 mm. Based on the area of the lesion at the initial visit, we classified the eyes into either the smaller PCV group (baseline area of lesion < 1 DA) or the larger PCV group (baseline area of lesion ≥ 1 DA) to compare the clinical course of the 2 groups.
We also compared the initial OCT measurement and VA with values obtained at the final visit. To compare the difference in VA, VA measured with a Landolt chart was converted to logarithm of the minimal angle of resolution units. Using OCT images, we obtained 2 measurements (foveal thickness and thickness of the neurosensory retina in the fovea) with a caliper that was built into the software of the OCT machine. Foveal thickness was defined as the distance between the vitreoretinal interface and the retinal pigment epithelium; thickness of the neurosensory retina was defined as the distance between the vitreoretinal interface and the tip the outer segment of the inner and outer segments of the photoreceptors.
We genotyped the major AMD- and PCV-associated single nucleotide polymorphism (SNP), rs10490924 (A69S), of ARMS2. Genomic deoxyribonucleic acid was prepared from leukocytes of peripheral blood using a deoxyribonucleic acid extraction kit (QuickGene-610L; Fujifilm, Minato, Tokyo, Japan). The SNPs were genotyped using Taqman SNP assays with the ABI PRISM 7700 system (Applied Biosystems, Foster City, California, USA) according to the manufacturer’s instructions.
Statistical analysis was performed using software designed for this purpose (StatView version 5.0; SAS Institute, Cary, North Carolina, USA). A P value of less than .05 was considered to be statistically significant.
Results
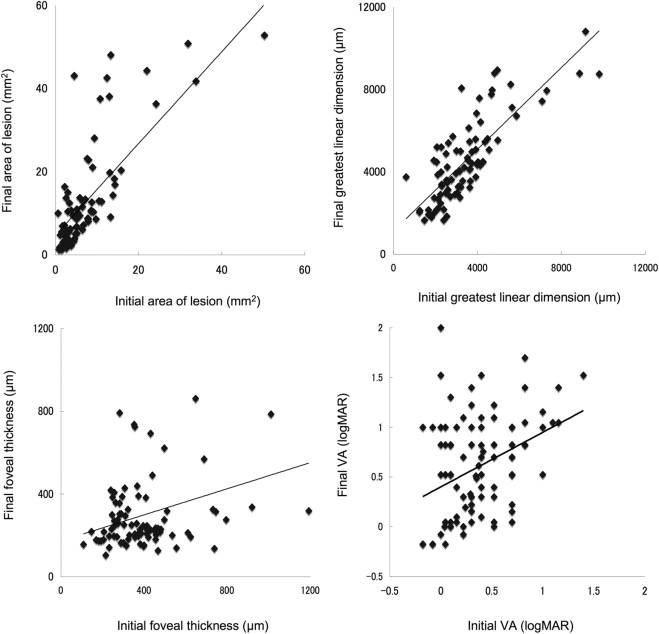
In the current study, 88 eyes of 88 patients (60 men and 28 women) with PCV, ranging in age from 50 to 86 years (mean ± standard deviation, 70.4 ± 7.5 years), were examined. The follow-up period ranged from 29 to 61 months (mean ± standard deviation, 46.4 ± 8.6 months), and duration from the initial angiogram to the last ranged from 24 to 60 months (mean ± standard deviation, 39.3 ± 9.4 months). All patients were examined with fluorescein and indocyanine green angiography repeatedly during follow-up, ranging from 2 to 11 times (mean ± standard deviation, 4.9 ± 2.0 times). Table 1 shows the characteristics of patients eligible for inclusion in this study. The mean ± standard deviation baseline VA (logarithm of the minimal angle of resolution) was 0.37 ± 0.34. The mean ± standard deviation initial area of the lesion and greatest linear dimension was 7.75 ± 9.78 mm 2 and 3412 ± 1647 μm, respectively. Figure 1 shows the relationship between area of the lesion, greatest linear dimension, foveal thickness, and VA at initial visit and final examination. Initial area of the lesion ( R = 0.801; P < .0001) and initial greatest linear dimension ( R = 0.805; P < .0001) showed a close correlation with final measurements.
| Total (n = 88) | Smaller Polypoidal Choroidal Vasculopathy (n = 22) | Larger Polypoidal Choroidal Vasculopathy (n = 66) | P Value | |
|---|---|---|---|---|
| Gender (women/men) | 28/60 | 8/14 | 20/46 | .5971 |
| Age (yrs) | 70.4 ± 7.5 | 68.2 ± 6.9 | 70.8 ± 7.7 | .3257 |
| Hypertension | 38 | 11 | 27 | .4560 |
| Smoking | 14 | 4 | 10 | .7365 |
| Location of lesions (macular/peripapillary/peripheral) | 79/8/1 | 22/0/0 | 57/8/1 | .1881 |
| Duration of symptoms (mos) | 8.0 ± 11.9 | 7.0 ± 9.5 | 8.3 ± 12.6 | .6484 |
| Initial conditions | ||||
| Best-corrected visual acuity (logMAR) | 0.37 ± 0.34 | 0.24 ± 0.29 | 0.42 ± 0.35 | .0383 |
| Area of lesion (mm 2 ) | 7.75 ± 9.78 | 1.68 ± 0.53 | 9.79 ± 10.55 | .0006 |
| Greatest linear dimension (μm) | 3412 ± 1647 | 1901 ± 464 | 3915 ± 1591 | <.0001 |
| Foveal thickness (μm) | 403.5 ± 189.9 | 377.6 ± 175.4 | 412.2 ± 195.0 | .4628 |
| Thickness of neurosensory retina in the fovea (μm) | 196.5 ± 83.8 | 209.1 ± 98.5 | 192.4 ± 78.6 | .4204 |
| Follow-up period (months) | 46.4 ± 8.1 | 44.5 ± 6.7 | 47.0 ± 8.4 | .2020 |
| Treatment | ||||
| Photodynamic therapy | 69 | 16 | 53 | .3055 |
| (Times of treatments) | 1.9 ± 1.1 | 1.5 ± 0.7 | 2.1 ± 1.2 | .0875 |
| Anti-VEGF therapy | 40 | 6 | 34 | .0480 |
| (Times of treatments) | 2.9 ± 2.5 | 3.8 ± 3.7 | 2.7 ± 2.2 | .3155 |
| Pars plana vitrectomy | 4 | 0 | 4 | .2372 |
| Cataract surgery | 8 | 3 | 5 | .2554 |
| Final conditions | ||||
| Best-corrected visual acuity (logMAR) | 0.62 ± 0.51 | 0.19 ± 0.33 | 0.76 ± 0.49 | <.0001 |
| Area of lesion (mm 2 ) | 13.24 ± 13.47 | 4.13 ± 3.59 | 16.27 ± 14.19 | .0002 |
| Greatest linear dimension (μm) | 4511 ± 2030 | 2761 ± 900 | 5095 ± 1967 | <.0001 |
| Foveal thickness (μm) | 299.7 ± 189.5 | 235.3 ± 65.1 | 321.2 ± 211.7 | .0651 |
| Thickness of neurosensory retina in the fovea (μm) | 197.1 ± 168.1 | 153.3 ± 38.4 | 211.7 ± 191.1 | .1597 |
| Changes during follow-up | ||||
| Best-corrected visual acuity (logMAR) | 0.24 ± 0.51 | −0.05 ± 0.36 | 0.34 ± 0.51 | .0015 |
| Area of lesion (mm 2 ) | 5.48 ± 8.13 | 2.45 ± 3.53 | 6.49 ± 8.96 | .0429 |
| Greatest linear dimension (μm) | 1100 ± 1204 | 860 ± 933 | 1180 ± 1278 | .2838 |
| Foveal thickness (μm) | −103.8 ± 221.9 | −142.3 ± 163.6 | −91.0 ± 237.8 | .3500 |
| Thickness of neurosensory retina in the fovea (μm) | 0.6 ± 168.0 | −55.8 ± 103.3 | 19.3 ± 181.4 | .0691 |
PCV vascular lesion at the initial visit varied in size, ranging from 0.64 to 63.82 mm 2 . Depending on the initial area of the lesion, we divided the eyes with PCV into 2 groups—the smaller PCV group (baseline area of lesion, < 1 DA; n = 22) and the larger PCV group (baseline area of lesion, ≥ 1 DA; n = 66; Figure 2 ). The mean area ± standard deviation of the lesion initially was 1.68 ± 0.53 mm 2 in the smaller PCV group and 9.79 ± 10.55 mm 2 in the larger PCV group. There were no significant differences in gender, age, or duration of symptoms between groups ( P = .5971, P = .3257, and P = .6484, respectively). In addition, there were no differences in the foveal thickness ( P = .4628) or thickness of the neurosensory retina in the fovea ( P = .4204) at the initial visit. However, the mean initial VA ± standard deviation was significantly better in eyes with smaller PCV (0.24 ± 0.39) than in eyes with larger PCV (0.42 ± 0.35, P = .0383).
During the follow-up period, 64 eyes were treated initially with PDT, and 9 were treated initially with anti-VEGF therapy. Despite these treatments, some eyes with larger PCV showed extension of the vascular component with an exudative change. The mean area of the lesion ± standard deviation in larger PCV progressed significantly from 9.79 ± 10.55 mm 2 to 16.27 ± 14.19 mm 2 at the final examination ( P < .0001; Figure 3 ). Furthermore, mean ± standard deviation VA in these eyes deteriorated significantly 0.42 ± 0.35 to 0.76 ± 0.49 at the final examination ( P < .0001). In contrast, eyes with smaller PCV lesions often showed minimal progression of the lesion and limited exudative change, and smaller PCV lesions rarely progressed to extensive PCV lesions ( Figure 4 ). However, even in eyes with smaller PCV, the mean lesion size increased during the follow-up period ( P = .0037). In smaller PCV, mean ± standard deviation change in the area of the lesion and final area of the lesion were 2.45 ± 3.53 mm 2 and 4.13 ± 3.59 mm 2 , respectively, which were significantly less than those of the larger PCV ( P = .0429 and P = .0002, respectively). In addition, eyes with the smaller PCV showed no decrease in VA (−0.05 ± 0.36; P = .5492) and maintained initial VA to the final visit; mean changes in VA were significantly better in smaller PCV than were those in larger PCV ( P = .0015).
Table 2 shows the ocular manifestations and complications seen during follow-up in eyes with smaller or larger PCV. Of the 88 eyes included, 7 (7.6%) showed suprachoroidal hemorrhage and 8 (8.7%) showed vitreous hemorrhage ( Figure 5 ), all of which were seen in eyes with larger PCV; no eyes with smaller PCV showed severe complications ( P = .1111 and P = .0868). Indeed, in eyes with smaller PCV, even the relatively small amount of subretinal hemorrhage noted (> 1 DA) was seen less frequently than in eyes with larger PCV ( P = .0157). In addition, other ocular manifestations associated with severe visual disturbance were seen more often in eyes with larger PCV. Type 2 CNV, subretinal fibrosis, and cystoid macular edema were seen more frequently in eyes with larger PCV ( P = .0030, P = .0533, and P = .0266). Of the 88 eyes included in this study, 41 (46.6%) showed a serosanguineous pigment epithelial detachment (area, > 1 DA). Again, a pigment epithelial detachment was seen more frequently in eyes with larger PCV than in those with smaller PCV ( P = .0096). Of the 88 eyes of our patients, 8 (8.7%) showed a tear of the retinal pigment epithelium. All of these occurred in eyes with larger PCV; no eyes with smaller PCV showed a tear ( P = .0868).
| Total (n = 88) | Smaller Polypoidal Choroidal Vasculopathy (n = 22) | Larger Polypoidal Choroidal Vasculopathy (n = 66) | P Value | |
|---|---|---|---|---|
| Suprachoroidal hemorrhage | 7 | 0 | 7 | .1113 |
| Vitreous hemorrhage | 8 | 0 | 8 | .0868 |
| Recurrence | 56 | 11 | 44 | .1620 |
| Type 2 choroidal neovascularization | 26 | 1 | 25 | .0030 |
| Fibrosis | 31 | 4 | 27 | .0533 |
| Serous retinal detachment | 81 | 20 | 65 | .0899 |
| Subretinal hemorrhage (> 1 DA) | 55 | 9 | 46 | .0157 |
| Cystoid macula edema | 42 | 6 | 36 | .0266 |
| Pigment epithelial detachment (> 1 DA) | 41 | 5 | 36 | .0096 |
| Tear of retinal pigment epithelium | 8 | 0 | 8 | .0868 |
Stay updated, free articles. Join our Telegram channel

Full access? Get Clinical Tree


