Purpose
To measure average retinal nerve fiber layer (RNFL) thicknesses in healthy, full-term neonates.
Design
Descriptive research to develop normative data.
Methods
Healthy infants born between 37 and 42 weeks postmenstrual age were imaged with hand-held spectral-domain optical coherence tomography. A custom script segmented the RNFL; the fovea and optic nerve center were manually selected. A second script measured the average RNFL thickness along the papillomacular bundle, defined as the arc from −15 degrees to +15 degrees on the axis from the optic nerve to fovea, with radii of 1.1, 1.3, 1.5, and 1.7 mm from the center of the optic disc. Shapiro-Wilk W tests assessed these measurements for normality to determine the age-appropriate radial distance for subsequent analyses. Average RNFL thicknesses for four temporal 45-degree sectors (superior temporal, temporal superior, temporal inferior, and inferior temporal) and the temporal quadrant were calculated and compared to demographic parameters for all infants.
Results
Fifty full-term infants were adequately imaged for RNFL analysis. RNFL thicknesses at 1.5 mm radial distance from the optic nerve were the most normally distributed. While there was a trend toward greater mean superior temporal RNFL thickness for both black and Hispanic vs white infants (128 ± 27 μm, 124 ± 30 μm, and 100 ± 19 μm, respectively, P = .04 for both comparisons), there were no other significant differences noted in RNFL thicknesses by race, sex, gestational age, or birth weight.
Conclusions
We present RNFL thickness measurements for healthy, full-term infants that may serve as normative data for future analyses.
The retinal nerve fiber layer (RNFL) consists of ganglion cell axons that course at the inner surface of the neurosensory retina and, after converging as the optic nerve, extend to the lateral geniculate nucleus of the brain. Spectral-domain optical coherence tomography (SD OCT) imaging provides in vivo visualization of this central nervous system (CNS) tract and allows quantification of ganglion cell axonal loss by segmentation. Peripapillary RNFL measurements were originally used to assess optic nerve axonal integrity in glaucomatous vs normal adults’ eyes. These measures were later adapted to children in order to improve diagnosis and monitoring of optic neuropathies unique to the pediatric population. While normative data of RNFL thicknesses exists for school-age children, these data are lacking during the neonatal period (PubMed Mesh search terms: nerve fiber layer AND infant), while the immature optic nerves are still growing and undergoing myelination.
Portable hand-held SD OCT allows for bedside cross-sectional assessment of the retina and optic nerve in nontraditional environments including the nursery. Our understanding of perinatal eye development and maturation has improved by comparing posterior segment microanatomy observed on SD OCT in preterm infants to that of full-term infants imaged in the nursery and further relating microanatomic abnormalities to ophthalmologic and systemic pathology. In particular, analysis of SD OCT images allows for reproducible quantification of optic nerve head parameters as an estimate of ganglion cell axonal integrity in both full-term and age-matched preterm infants. Retinal nerve fiver layer thickness has previously been measured in young children with optic pathway gliomas while they were sedated for magnetic resonance imaging using a hand-held SD OCT system and were demonstrated to be reproducible. The present study’s purpose was to reproducibly quantify RNFL thickness in full-term neonates and thereby to provide normative data for future analyses.
Methods
The current analysis is descriptive research to develop normative data as part of a larger, prospective study of retinal and optic nerve development that was approved by the Duke University institutional review board and adheres to the Health Insurance Portability and Accountability Act and all tenets of the Declaration of Helsinki. All infants were enrolled and imaged from August 2010 through May 2011 with parent or legal guardian written informed consent to participate in this research study. Infants were eligible if born at or after 37 weeks postmenstrual age and before 43 weeks postmenstrual age with no known medical conditions and deemed clinically stable by the pediatric care team to undergo SD OCT imaging. All infants were imaged following clinical examination, which included dilated fundus examination using indirect ophthalmoscopy. SD OCT imaging was performed according to an age-specific protocol described by Maldonado and associates and Cabrera and associates using a portable, hand-held SD OCT system (either an early research system or the Envisu 2200; Bioptigen, Inc., Research Triangle Park, North Carolina, USA) approaching the eyes over the forehead of the supine infant. Demographic information was collected from medical records, including gestational age, birth weight, sex, and parent-reported race.
One eye per infant was randomly selected for inclusion in the study; the fellow eye was considered for analysis if the primary eye did not have an adequate SD OCT scan for RNFL analysis. The best vertical SD OCT volume scan that contained the optic disc and macula was selected for each infant. Criteria considered when selecting the best scan included: focus, alignment, tilt, and the ability to differentiate retinal layers. Scans were excluded if there was eye movement that caused skipping or lags between B-scans, if there was inadequate visualization of the center of the optic disc, or if the axis between the center of the optic nerve and fovea could not be determined. All SD OCT scans were converted to tagged image file format, and were registered with ImageJ v 1.43r (National Institutes of Health, Bethesda, Maryland, USA).
Several custom MATLAB scripts (Mathworks, Inc, Natick, Massachusetts, USA) were used for quantitative analysis. Graders were masked to all demographic information other than age at imaging. The SD OCT images were captured using a hand-held device on neonates in the supine position who could not fixate on a central target. Thus, the organizing axis from the foveal center to the optic nerve head determined the direction of the image frame. This is an adaptation of the method described by He and associates and Chauhan and Burgoyne for measurements of the optic nerve and peripapillary structures in adults. Two certified pediatric SD OCT graders (A.L.R. and D. T.-V.) used Duke OCT Retinal Analysis Program v 60.2, an automatic segmentation program based on graph theory and dynamic programming, to mark the center of the optic disc as well as the fovea on each infant’s pertinent B-scan; if the fovea was not visualized, the midpoint between the superior and inferior arcades was marked as the axis of the fovea. Graders determined the center of the optic disc by centering a 2-mm-radius annulus on the optic disc using Duke OCT Retinal Analysis Program. A MATLAB script read the marked coordinates of the center of the optic disc and fovea and created an organizing axis between the two for each volume. After Duke OCT Retinal Analysis Program segmented the superior and inferior borders of the RNFL for each volume, graders manually corrected any segmentation requiring adjustment ( Figure 1 , Left). The 2 segmentation lines were set at the same height for any portion of a B-scan that was of too poor quality for segmentation in order to measure a thickness of zero.
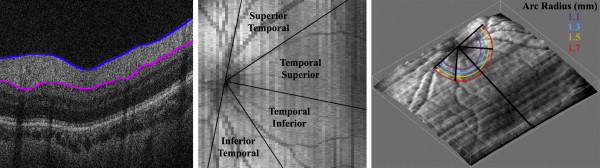
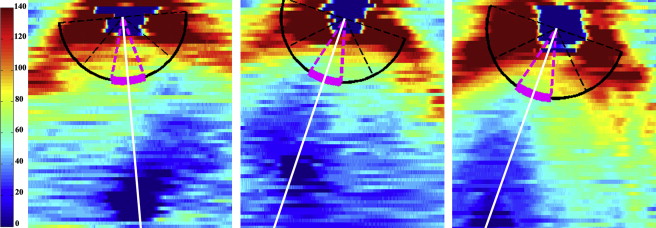
The graphic user interface could then measure the average RNFL thickness at an arc of any set distance from the optic nerve to the fovea ( Figure 2 ). The program considered only RNFL thicknesses greater than 5 μm, allowing portions of the arc that were unable to be segmented to be excluded from the average thickness calculations. The arc only measured the retina temporal to the optic nerve; nasal retina was not imaged as it is technically more difficult to image and more time consuming on a nonsedated full-term newborn. This arc could then be divided into sectors to provide regional average RNFL thicknesses. The temporal macula was divided into 4 45-degree arcs, considered from superior to inferior, the superior temporal, temporal superior, temporal inferior, and inferior temporal sectors ( Figure 1 , Middle). The temporal superior and temporal inferior arcs were also assessed together as the 90 degree temporal quadrant. The user could set a minimum threshold of percent of the arc adequately segmented in order for each quadrant’s thickness to be calculated if this data availability threshold was met. The minimum threshold for the current analysis was chosen as 90% segmentation. For example, 90% of an eye’s superior temporal sector must be segmented in order to calculate the average RNFL thickness within this sector; infants who have a thickness of 5 μm or less for 11% or more of this sector would not be included in the analysis. In addition, the average RNFL thickness was calculated for the papillomacular bundle (PMB), defined as the 30-degree arc from −15 degrees to +15 degrees on the axis from the optic nerve to fovea ( Figure 2 ) and also referred to as the 9 o’clock hour for right eyes and 3 o’clock hour for left eyes.
Adult RNFL analyses typically measure average RNFL thicknesses at a radius of 1.70–1.75 mm from the center of the optic nerve. Because the infant eye is still growing and has a smaller distance from the center of the optic nerve to the fovea, the optimal distance for RNFL measurements in neonates is unknown. The average RNFL thickness at the PMB for each infant was calculated at arcs with radii of 1.1, 1.3, 1.5, and 1.7 mm from the center of the optic disc ( Figure 1 , Right). The distributions of these RNFL thicknesses for all infants at each arc distance were assessed for normality to determine the optimal distance for subsequent analyses. The mean RNFL thickness at 1.7 mm from the optic nerve center for each geographic sector was also computed to allow comparisons to the pediatric literature.
Once this distance was determined, the average RNFL thickness along the PMB arc was compared by sex, race, and eye side as well as analyzed by gestational age and birth weight. The average RNFL within the superior temporal, temporal superior, temporal inferior, and inferior temporal sectors as well as the temporal quadrant were then compared by race. Any infants that were part of a previous study that measured optic nerve parameters observed on SD OCT had their optic nerve vertical cup-to-disc ratio compared to their average RNFL thickness measurement.
Intrauser, interuser, and intravisit reproducibility of average PMB thickness were assessed to validate this novel method of neonatal RNFL thickness measurement. Intrauser reproducibility was assessed by 1 user (A.L.R.) on the same scan of the same eye from the same visit while interuser reproducibility was assessed between 2 users (A.L.R. and D. T.-V.) on the same scan of the same eye from the same visit; intravisit reproducibility was performed by 1 user (A.L.R.) on 2 scans of the same eye from the same visit. All reproducibility segmentation correction and marking of the fovea and optic nerve center was performed while masked to the prior reading. Intrauser and interuser reproducibility of average RNFL thickness at the PMB considered 20 randomly selected infants. All infants who had 2 separate scans in the same eye of adequate quality for analysis obtained from the same imaging session were considered for intravisit reproducibility. All reproducibility scans had optic nerves and foveae remarked and were resegmented with new segmentation correction performed.
Statistical analysis was performed using JMP Pro v 11 (SAS Institute Inc, Cary, North Carolina, USA). P values were considered statistically significant if less than .05. Normality of average RNFL distributions in the full-term cohort was assessed by Shapiro-Wilk W tests where a P < .05 rejects the null hypothesis that the distribution is normal. The difference in mean RNFL thickness at the PMB at different distances from the optic nerve center was assessed with an analysis of variance test. The relationships between average RNFL thickness along the PMB arc and sex were assessed by a 2-tailed t test, and average RNFL thickness along the PMB arc was compared between races by a Kruskal-Wallis test. The average RNFL within the superior temporal, temporal superior, temporal inferior, and inferior temporal sectors as well as the temporal quadrant were compared by race with the Kruskal-Wallis test and then between racial groups by the Tukey-Kramer method. Bonferroni correction for comparisons of RNFL thickness by fundus sector between races required a P value less than .01 to demonstrate statistical significance. Additionally, the relationship between average RNFL thickness along the PMB arc and gestational age and birth weight were assessed by linear regression. The relationship between optic nerve vertical cup diameter, vertical disc diameter, and vertical cup-to-disc and average RNFL thickness along the PMB arc was assessed by linear regression using previously described full-term optic nerve parameters. Intrauser, interuser, and intravisit reproducibility of average RNFL thickness at the PMB were summarized by the intraclass correlation coefficient (ICC).
Results
Demographics
A total of 57 full-term infants were enrolled in the study; 1 infant was withdrawn prior to SD OCT imaging. Of the 56 full-term infants who underwent SD OCT imaging, 50 full-term infants had at least 1 adequate SD OCT for RNFL analysis. A total of 45 of the full-term infants included in the current study had their optic nerve parameters, but not their RNFL, measured in a previous report. The mean ± standard deviation (SD) gestational age and birth weight of all infants was 39.2 ± 1.1 weeks postmenstrual age and 3356 ± 458 g, respectively. The cohort of 50 full-term infants included 22 male subjects (44%); 12 (24%) were black, 20 (40%) Hispanic, and 18 (36%) white.
Distance From Optic Nerve for Retinal Nerve Fiber Layer Measurements
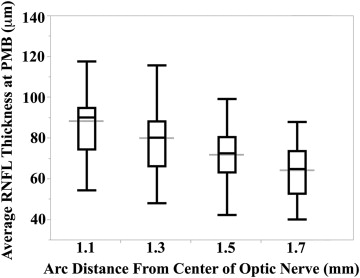
All 50 full-term infants had 100% of their RNFL segmented at a distance of 1.5 and 1.7 mm from the center of the optic nerve; while 2 infants did not have at least 90% of their respective RNFL segmented at the PMB, one with inadequate segmentation at a distance of 1.1 mm and the other at 1.3 mm from the center of the optic nerve, the remaining 49 infants had 100% of their RNFLs measured at these arc distances. The mean ± SD average ( P value for Shapiro-Wilk W test of normality) RNFL thicknesses for all full-term infants assessed at 1.1, 1.3, 1.5, and 1.7 mm distances from the center of the optic nerve at the PMB were 88 ± 17 μm ( P = .11), 80 ± 17 μm ( P = .22), 72 ± 13 μm ( P = .60), and 64 ± 12 μm ( P = .34), respectively ( Figure 3 ). The mean RNFL at the PMB decreased significantly when measured further away from the optic nerve ( P < .001). All subsequent analyses involve thicknesses measured along the PMB arc at a distance of 1.5 mm from the center of the optic nerve because this distance had the most normally distributed average RNFL thicknesses and the literature suggests that a distance of 1.5 mm from the center of the optic nerve in newborns is proportional to the 1.7 mm distance considered for adults.
Average Sectoral Retinal Nerve Fiber Layer Thicknesses
The mean ± SD average RNFL thicknesses for all full-term infants assessed at a distance of 1.5 mm from the optic nerve center along the PMB and the superior temporal, temporal superior, temporal inferior, inferior temporal, and temporal sectors were 72 ± 13 μm, 117 ± 28 μm, 81 ± 20 μm, 85 ± 20 μm, 118 ± 29 μm, and 83 ± 16 μm, respectively. There was no significant difference in average RNFL thickness along the PMB arc at 1.5 mm from the center of the optic nerve between male (69 ± 14 μm) and female infants (73 ± 13 μm, P = .31) or between black (74 ± 15 μm), Hispanic (74 ± 13 μm, P = 0.16), and white (67 ± 11 μm) infants. Additionally, there was no relationship between average RNFL thickness along the PMB arc at 1.5 mm distance and gestational age (R 2 < 0.01, P = .70) or birth weight (R 2 = 0.01, P = .46) in this full-term cohort. There was a trend toward greater average superior temporal RNFL thickness for black (128 ± 27 μm, P = .04) as well as Hispanic (124 ± 30 μm, P = .04) compared to white infants (100 ± 19 μm); there was no difference in the average RNFL thicknesses for the temporal superior, temporal inferior, and inferior temporal sectors or the temporal quadrant when comparing races ( Table 1 ). There was no relationship between average RNFL thickness along the PMB arc at a distance of 1.5 mm and optic nerve vertical cup diameter (R 2 < 0.01, P = .53), vertical disc diameter (R 2 = 0.02, P = .32), or vertical cup-to-disc ratio (R 2 = 0.04, P = .22) in this healthy full-term cohort.
| Superior Temporal | Temporal Superior | Temporal Inferior | Inferior Temporal | Temporal | |||||||||||
|---|---|---|---|---|---|---|---|---|---|---|---|---|---|---|---|
| N | RNFL, μm | P Value a | N | RNFL, μm | P Value a | N | RNFL, μm | P Value a | N | RNFL, μm | P Value a | N | RNFL, μm | P Value a | |
| Mean (SD) | Mean (SD) | Mean (SD) | Mean (SD) | Mean (SD) | |||||||||||
| Race | .04 | .41 | .24 | .28 | .26 | ||||||||||
| Black | 10 | 128 (27) | 12 | 79 (18) | 12 | 90 (20) | 9 | 124 (16) | 12 | 85 (16) | |||||
| Hispanic | 18 | 124 (30) | 19 | 85 (22) | 19 | 87 (22) | 16 | 123 (33) | 19 | 86 (16) | |||||
| White | 13 | 100 (19) | 17 | 78 (19) | 18 | 79 (19) | 15 | 109 (30) | 17 | 79 (14) | |||||
Stay updated, free articles. Join our Telegram channel

Full access? Get Clinical Tree


