Purpose
To assess morphologic changes associated with retinal flecks in fundus flavimaculatus using spectral-domain optical coherence tomography (SD-OCT).
Design
Observational case series.
Methods
Simultaneous recordings of SD-OCT and confocal scanning laser ophthalmoscope (cSLO) fundus autofluorescence images were obtained in fundus flavimaculatus patients. Morphologic aspects of the retinal flecks were analyzed and classified.
Results
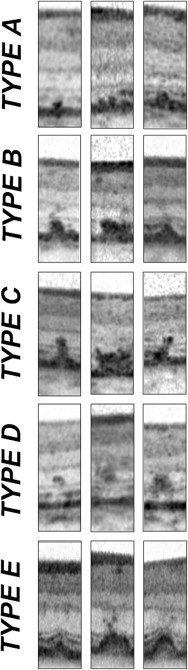
Thirty-one eyes of 17 consecutive patients (8 male, 9 female; mean age 47.9 ± 17.1 years) were included for analysis. SD-OCT revealed 5 distinct types of lesions. Group A lesions were limited to the outer segment (OS) of the photoreceptors, the retinal pigment epithelium (RPE) interdigitations, and the RPE/Bruch membrane complex. Group B showed a protrusion of the hyper-reflective material through the interface of inner segment (IS)/OS of the photoreceptors up to the external limiting membrane. A further protrusion of the hyper-reflective material into the outer nuclear layer was seen in group C lesions. Group D lesions were characterized by an accumulation of the hyper-reflective material limited to the outer nuclear layer. Type E lesions can be described as drusen-like retinal pigment detachments. No significant correlation between the different types of flecks and visual acuity was observed ( P > .05).
Conclusions
SD-OCT allows one to distinguish at least 5 different types of lesions associated with retinal flecks in fundus flavimaculatus. The ability to characterize the different types of flecks and to analyze the photoreceptor layers surrounding these lesions suggests that SD-OCT might have a potential clinical role in the evaluation and follow-up of the structural changes in fundus flavimaculatus.
Fundus flavimaculatus is a rare inherited retinal dystrophy, characterized by retinal flecks and subsequent macular atrophy. Fundus flavimaculatus and Stargardt disease share a similar phenotype and are both linked with mutations in the ABCA4 gene. Fundus flavimaculatus begins at the end of the second decade or later and has a slower progressive course than Stargardt disease.
Typical morphologic features of the early-stage fundus flavimaculatus are the yellowish-white well-defined deposits, the so-called retinal “flecks.” The severity of the fundus lesion in terms of distribution and number of flecks is often not concomitant with the alteration in the visual acuity. Later, a central retinal atrophy appears and extends to varying degrees through the different retinal layers of the posterior pole, and leads to a significant decrease of visual acuity. As the central atrophy progresses, it becomes increasingly difficult to distinguish the flecks on fundus examination. Furthermore, the flecks, which are clearly revealed by fundus autofluorescence as hyper-autofluorescent during the early stages of the disease, appear hypo-autofluorescent in fundus autofluorescence at the end-stage disease, suggesting a turnover from material accumulation until complete resorption and cell death.
In 1909 Karl Stargardt already raised the question of the localization of the flecks in the retina, and this question is still not completely elucidated. Unfortunately, few contributively anatomo-pathologic studies exist. High-definition optical coherence tomography (OCT) devices recently developed allow detailed in vivo visualization of intraretinal structures, such as retinal pigment epithelium (RPE) as well as inner segment (IS) and outer segment (OS) of the photoreceptor layer. The aim of this study was to analyze the different morphologic aspects of retinal flecks in fundus flavimaculatus, as well as to investigate the structural integrity of both the photoreceptor layer and the RPE layer adjacent to retinal flecks, using high-definition spectral-domain optical coherence tomography (Spectralis HRA SD-OCT; Heidelberg Engineering, Heidelberg, Germany).
Methods
Seventeen consecutive patients of Caucasian origin with fundus flavimaculatus were examined. Nine women and 8 men were enrolled in this study. Criteria for inclusion were: 1) age at onset (visual impairment) >18 years old; 2) evidence of hypo-autofluorescence from areas of macular atrophy, associated or not with retinal flecks; 3) presence of hyper-autofluorescent retinal flecks, associated or not with areas of macular atrophy; and 4) diagnosis of dark choroid on fluorescein angiography (FA). Eyes presenting with any associated macular diseases or complication, such as myopia > −8 diopters (D), angioid streaks, confluent drusen and epiretinal membrane, or choroidal neovascularization, were excluded from this study. All patients underwent a complete ophthalmologic examination, including assessment of best-corrected visual acuity (BCVA) measured at 4 m with standard ETDRS, fundus biomicroscopy, color photography, and red-free frame of the fundus (Canon 60 fundus camera; Cannon, Tokyo, Japan; Topcon TRC-50 retinal camera; Topcon, Tokyo, Japan).
Simultaneous recordings of SD-OCT and confocal scanning laser ophthalmoscope (cSLO) fundus autofluorescence images were obtained with a combined imaging system. The cSLO system provides fundus autofluorescence imaging (excitation wavelength, 488 nm; barrier filter, 500 nm), as well as infrared reflectance (IR; 820 nm) and blue (488 nm) reflectance imaging. The size of the field of view was 30 degrees × 30 degrees. Image acquisition was performed in high-resolution mode, with a speed of 9 images/second. Fundus images are digitized in frames of 768 × 768 pixels with a resolution of approximately 11 μm per pixel. The SD-OCT runs simultaneously with the cSLO imaging system, using a second, independent pair of scanning mirrors. The wavelength of the SD-OCT imaging system is 870 nm. Optical resolution is approximately 7 μm in depth and 14 μm transversely. Acquisition speed is 40 000 A-scans per second. The scan depth is 1.8 mm. Each A-scan consists of 512 pixels, providing a digital depth resolution of 3.5 μm per pixel. Live B-scans can be acquired and observed simultaneously with a cSLO reference image that can be a confocal infrared or blue reflectance image, an autofluorescence image, or an angiography image. A minimum of 6 scans per eye were performed. Flecks were classified by their appearance on SD-OCT scans, in relation to their localization at the level of the RPE interdigitations, at the RPE/Bruch membrane complex, and from the interface of IS and OS up to the outer nuclear layer. The different SD-OCT lesions, corresponding to the retinal flecks, were then classified with respect to their appearance on fundus autofluorescence, as absent (degree 0), gray (degree 1), or white (degree 2).
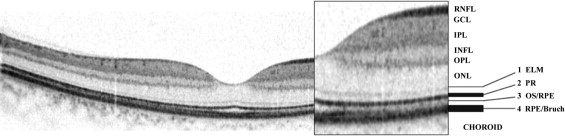
The SD-OCT scan of a normal retina shows distinct bands that are supposed to correlate with the anatomic layers of the human retina ( Figure 1 ). The accurate labeling and the histologic-anatomic equivalent corresponding to the observed bands is still controversial, particularly in regard to the reflective bands in the outer retina. A possible morphologic correlation of the first hyper-reflective band ( Figure 1 , band 1) is the external limiting membrane (ELM). The second band ( Figure 1 , band 2) could reflect the interface of the inner and outer segments of the photoreceptor layer, the third band ( Figure 1 , band 3) is assumed to correspond to the OS/RPE interdigitation, and the fourth band ( Figure 1 , band 4) might represent the RPE/Bruch membrane complex.
Statistical calculations were performed with the Mann-Whitney test for repeated-measures analysis of variance to assess the influence of transverse central (foveal) IS/OS interface loss, as well as type of lesion in the SD-OCT images, on BCVA converted to the logarithm of the minimal angle of resolution (logMAR). The chosen level of statistical significance was P < .05.
Results
A total of 31 eyes of 17 patients (8 male, 9 female) were included for analysis. Three eyes were excluded because of the presence of choroidal neovascularization. The mean age of the patients was 47.9 (± 17.1) years and mean BCVA was 20/40 (ranging from 20/20 to 20/250; Table 1 ). Retinal flecks were extremely polymorphous, pyramid-like or round-shaped, fusiform spear-like or pisciform, and of different size. On fundus examination and fundus autofluorescence these lesions were either perimacular or diffusely distributed.
| Patient | Gender | Age (Years) | Eye | BCVA | Lesions | Central Atrophy | Fundus Distibution of the Flecks | |||||
|---|---|---|---|---|---|---|---|---|---|---|---|---|
| A | B | C | D | E | Diffuse | Perimacular | ||||||
| 1 | M | 23 | R | 20/40 | x | x | x | — | x | x | x | — |
| L | 20/50 | x | x | x | — | x | x | x | — | |||
| 2 | M | 33 | R | 20/25 | x | x | — | x | — | — | — | x |
| L | 20/20 | x | x | — | x | — | — | — | x | |||
| 3 | F | 41 | R | 20/32 | x | x | x | x | x | x | x | — |
| L | 20/50 | x | x | x | x | x | x | x | ||||
| 4 | F | 43 | R | 20/40 | x | x | x | — | — | x | x | — |
| 5 | M | 52 | R | 20/25 | x | x | x | — | x | — | x | — |
| L | 20/63 | x | x | x | — | — | x | x | — | |||
| 6 | M | 41 | R | 20/160 | x | x | x | x | — | x | — | x |
| L | 20/200 | x | x | x | x | — | x | — | x | |||
| 7 | F | 68 | R | 20/200 | x | x | x | — | x | x | x | — |
| L | 20/200 | x | x | x | — | x | x | x | — | |||
| 8 | F | 42 | R | 20/32 | x | x | x | — | — | x | x | — |
| L | 20/25 | x | x | x | — | — | — | x | — | |||
| 9 | F | 39 | R | 20/20 | x | x | x | x | — | — | — | x |
| L | 20/25 | x | x | x | x | — | — | — | x | |||
| 10 | M | 59 | R | 20/200 | x | x | x | x | — | x | x | — |
| L | 20/50 | x | x | x | x | — | x | x | — | |||
| 11 | F | 50 | R | 20/20 | x | x | x | x | — | — | — | x |
| L | 20/20 | x | x | x | x | — | — | — | x | |||
| 12 | F | 70 | R | 20/25 | x | x | x | x | — | — | x | — |
| L | 20/32 | x | x | x | x | — | — | x | — | |||
| 13 | F | 79 | R | 20/32 | x | x | x | — | x | — | x | — |
| 14 | F | 22 | R | 20/100 | x | x | — | x | — | x | x | — |
| L | 20/80 | x | x | — | x | — | x | x | — | |||
| 15 | M | 43 | R | 20/25 | x | x | — | — | — | — | — | x |
| L | 20/50 | x | x | — | — | — | x | — | x | |||
| 16 | M | 35 | R | 20/32 | x | x | x | — | — | x | — | x |
| L | 20/100 | x | x | x | — | — | x | — | x | |||
| 17 | M | 75 | L | 20/100 | x | x | x | x | x | x | — | x |
Five different types of lesions have been highlighted by SD-OCT and categorized into groups A, B, C, D, and E ( Table 2 ).
| Classification | Localization | Percentage of Presence in the Study Eyes |
|---|---|---|
| A | Accumulation of hyper-reflective material at the level of the outer segments of the photoreceptors, the retinal pigment epithelium (RPE) interdigitations, and the RPE/Bruch membrane complex | 100% |
| B | A + increased accumulation of material, expanding through the interface of the inner and outer segments of the photoreceptors up to the external limiting membrane | 100% |
| C | A + B + protrusion of hyper-reflective material into the outer nuclear layer | 81% |
| D | Accumulation of hyper-reflective material limited strictly to the outer nuclear layer | 55% |
| E | Drusen-like pigment epithelium detachments | 29% |
Group A could be described as an accumulation of hyper-reflective material in the OS, the RPE interdigitations, and the RPE/Bruch membrane complex ( Figure 2 ). Group A lesions demonstrated varying extents and shapes of accumulation of hyper-reflective material, but still limited to the OS of the photoreceptors. This type of lesion was found in 31 of 31 eyes ( Figure 2 ). Concerning the fundus autofluorescence, all of these lesions appeared as hyper-autofluorescent at degree 1 (gray).