Purpose
To examine choroidal thickness and area in healthy eyes using spectral-domain optical coherence tomography (SD-OCT).
Design
Retrospective, observational case series.
Methods
Thirty-four eyes (34 subjects), with no retinal or choroidal disease, underwent high-definition raster scanning using SD-OCT with frame enhancement software. Choroidal thickness was measured from the posterior edge of the retinal pigment epithelium to the choroid/sclera junction at 500-μm intervals up to 2500 μm temporal and nasal to the fovea. The central 1-mm area of the choroid was also measured, along with foveal thickness of the retina. All measurements were performed by 2 independent observers. Statistical analysis was used to correlate inter-observer findings, choroidal thickness and area measurements with age, and choroidal thickness with retinal foveal thickness.
Results
The 34 subjects had a mean age of 51.1 years. Reliable measurements of choroidal thickness were obtainable in 74% of eyes examined. Choroidal thickness and area measurements had strong inter-observer correlation (r = 0.92, P < .0001 and r = 0.93, P < .0001 respectively). Area had a moderate negative correlation with age (r = −0.62, P < .0001) that was comparable to the correlation between mean subfoveal choroidal thickness and age (r = −0.61, P < .0001). Retinal and choroidal thickness were found to be poorly correlated (r = −0.23, P = .18). Mean choroidal thickness showed a pattern of thinnest choroid nasally, thickening in the subfoveal region, and then thinning again temporally. Mean subfoveal choroidal thickness was found to be 272 μm (SD, ± 81 μm).
Conclusions
Choroidal thickness can be measured using SD-OCT high-definition raster scans in the majority of eyes. Choroidal thickness across the macula demonstrates a thin choroid nasally, thickest subfoveally, and again thinner temporally, and a trend toward decreasing choroidal thickness with age.
The introduction of optical coherence tomography (OCT) into clinical practice has changed ophthalmology, and with progression of new technology, the ability to obtain a true, noninvasive “optical biopsy” of the posterior segment is almost achievable. With advancements in OCT image processing software, more refined details of the posterior segment can be appreciated and characterized in vivo. The choroid plays a vital role in the pathophysiology of many diseases affecting the retina, but adequate visualization of the choroid using OCT has not been possible until recently. Spaide and associates recently reported the successful examination and measurement of choroidal thickness in normal and pathologic states using the Heidelberg Spectralis (Heidelberg Engineering, Heidelberg, Germany) OCT instrument. The Spectralis offers eye tracking technology and the capability to capture up to 100 B-scans in the same position for OCT signal averaging and enhancement. Furthermore, Spaide demonstrated the ability of the spectral-domain (SD) OCT systems to show an inverted OCT image by moving the device close to the patients’ eye. Since spectral-domain detection has highest sensitivity near zero delay and sensitivity decreases for larger delays, by inverting the OCT image, the choroid is closer to the zero-delay line, providing enhanced sensitivity and increased imaging depth. OCT imaging with longer wavelengths at 1060 nm (compared to 800 nm used in commercial OCT systems) has also been shown to increase signal penetration into the choroid and optic nerve head. Ikuno and associates have recently characterized normal choroidal thickness in Japanese subjects using a 1060 nm–based light source. The aim of this study was to evaluate another commercially available spectral-domain device, Cirrus HD-OCT (Carl Zeiss Meditec Inc, Dublin, California, USA) to see if its new software, which permits acquisition of 20 B-scans simultaneously in a single raster line scan, would allow accurate measurement of choroidal thickness and area in normal eyes using previously proposed measurement techniques.
The SD Cirrus HD-OCT light source is centered on 800 nm wavelength, achieving 5 μm axial resolution in tissue. Previously, the full thickness of the choroid could not be seen in most eyes because of scattering and insufficient light penetration beyond the retinal pigment epithelium (RPE), as well as signal strength roll-off distal to the zero-delay line. Selective pixel profiling available in the newest version 4.5 software generates a high-definition 1-line raster image from 20 B-scans taken at a single location. This processing software is comparable to frame averaging, but is unique in that images are generated by evaluating all of the pixel data to reduce noise and construct the best possible image. Decreased signal strength posterior to the RPE is compensated by this image enhancement software, which enables visualization of the border where choroidal tissue meets sclera and allows choroidal thickness measurements to be performed.
Methods
A retrospective analysis was performed on 34 eyes of 34 normal patients, who underwent high-definition 1-line raster scanning at the New England Eye Center, Tufts Medical Center, Boston, Massachusetts, between November 23, 2009 and December 21, 2009. Medical chart review was done to identify patients with no retinal or choroidal pathology. Patients with a myopic refractive error of greater than −6.0 diopters were excluded from this study. Cirrus HD-OCT scans were obtained from patients as part of a comprehensive dilated ophthalmologic examination, as well as from undilated healthy volunteers with no visual complaints or history of ocular pathology.
The 1-line raster is a 6-mm line consisting of 4096 A-scans. The images were taken in the usual manner and were not inverted to bring the choroid in closer proximity to the zero-delay line, as image inversion using the Cirrus software results in a low-resolution, pixilated image. To be included in this study, images had to be at least 6 out of 10 in intensity and taken as close to the fovea as possible, by choosing to image the thinnest point of the macula, with the understanding that slight differences in positioning could affect the measured thicknesses. One eye per patient was selected for measurements. If images from both eyes met inclusion criteria, then the eye in which the choroid/sclera border could be most clearly visualized was selected. Of the 34 eyes, 13 right eyes and 21 left eyes were measured in this study. Using the Cirrus linear measurement tool, 2 independent observers measured choroidal thickness perpendicularly from the outer edge of the hyper-reflective RPE to the inner sclera at 500-μm intervals temporal and nasal from the fovea, up to 2500 μm ( Figure 1 ). Furthermore, the central foveal thickness was also measured at this time in order to determine the correlation between retinal thickness and choroidal thickness.
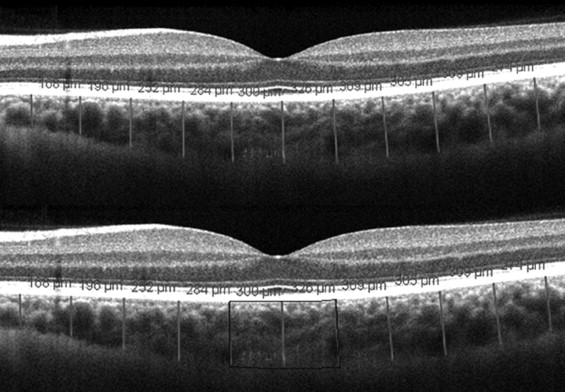
Additionally, the area of the choroid in the central 1-mm region, 500 μm temporal and nasal to the fovea, was also measured on all images ( Figure 1 ). The 1-line raster images were exported to publicly available research analysis software, ImageJ ( http://rsbweb.nih.gov/ij/ ). In order to generate measurements equivalent to Cirrus software, the scale was set by drawing a line over a line of a known distance, adjusting the pixel aspect ratio to 0.5, and setting global measurements in micrometers. The area of interest was then outlined and calculated in square micrometers (μm 2 ). Two independent observers measured the same area on all normal scans in order to correlate findings.
A Pearson correlation was applied to choroidal thickness and area with respect to age and central foveal thickness compared to choroidal thickness. A P value of <.01 was considered statistically significant. All statistics were calculated using SPSS software (Version 17.0 for Windows; SPSS Inc, Chicago, Illinois, USA).
Results
The group of 34 subjects consisted of 17 men and 17 women, with an average age of 51.1 years (range, 22 to 78 years). Nine out of 34 were undilated volunteers. All eyes had normal foveal contour with no retinal pathology and no abnormalities of the choroid. The delineation between choroid and sclera could be visualized easily to permit reliable thickness measurements to be performed in 34 out of 46 (74%) of the images evaluated in this study. Of the 12 normal eyes in which choroidal thickness could not be measured, 2 eyes were undilated and 10 eyes were dilated. Considering the 10 dilated eyes in which measurements could not be obtained, 6 eyes had 1-2+ nuclear sclerotic cataracts and 2 had a posterior chamber intraocular lens.
In these 34 eyes, choroidal thickness measurements had strong inter-observer correlation overall (r = 0.92, P < .0001) and at each of the 11 measurement locations ( Table ). Average thickness of the choroid beneath the fovea was 272 μm (SD, ± 81 μm).
| Location (mm From Fovea) | Mean Choroidal Thickness (μm) | Inter-Observer Correlation (r) | P Value |
|---|---|---|---|
| Temporal (2.5) | 218 | 0.88 | <.0001 |
| Temporal (2.0) | 237 | 0.89 | <.0001 |
| Temporal (1.5) | 248 | 0.90 | <.0001 |
| Temporal (1.0) | 256 | 0.88 | <.0001 |
| Temporal (0.5) | 264 | 0.94 | <.0001 |
| Fovea (0) | 272 | 0.92 | <.0001 |
| Nasal (0.5) | 261 | 0.92 | <.0001 |
| Nasal (1.0) | 248 | 0.90 | <.0001 |
| Nasal (1.5) | 217 | 0.91 | <.0001 |
| Nasal (2.0) | 186 | 0.95 | <.0001 |
| Nasal (2.5) | 157 | 0.94 | <.0001 |
Stay updated, free articles. Join our Telegram channel

Full access? Get Clinical Tree


