Purpose
To quantify retinal photoreceptor density using adaptive optics (AO) imaging and correlate it with retinal tomography, fundus autofluorescence, and retinal sensitivity overlying lesions in various white dot syndromes (WDS).
Design
Prospective cross-sectional study.
Methods
setting : Stanley M. Truhlsen Eye Institute, University of Nebraska Medical Center, Omaha, Nebraska, USA. study population : Thirty-five lesions of WDS from 12 patients (19 eyes; mean age: 54.4 ± 15.8 years; 9 female) were analyzed. intervention : Macular lesions (≤3 regions of interest/eye), at 2 fixed eccentric loci, were imaged using AO, spectral-domain optical coherence tomography, and fundus autofluorescence. In this study, lesions were defined as active if there was presence of hyperautofluorescence within the lesions. Photoreceptor density was calculated after manual correction and adjustment for axial length. Retinal sensitivity was assessed using microperimetry and correlated with photoreceptor density using Spearman rank correlation test. outcome measures : Mean retinal sensitivity and photoreceptor density at the WDS lesions.
Results
Mean photoreceptor density was 7331 ± 4628 cones/mm 2 overlying 16 active lesions and 6546 ± 3775 cones/mm 2 overlying 19 inactive lesions ( P = .896). Mean retinal sensitivity (9.37 ± 5.34 dB) showed modest correlation with photoreceptor density (ρ = 0.42, P = .03). Retinal sensitivity over lesions with intact inner segment-outer segment (IS-OS) junction was 13.35 ± 3.75 dB and 6.33 ± 4.31 dB over lesions with disrupted IS-OS junction ( P = .005).
Conclusions
AO imaging may allow high-resolution analysis of photoreceptor loss among lesions in WDS. Such microstructural changes may correlate with functional loss.
Conventionally referred to as choroidopathies , white dot syndromes (WDS) such as serpiginous choroiditis, punctate inner choroidopathy, multifocal choroiditis, and multiple evanescent white dot syndrome (MEWDS), to name a few, are characteristically associated with significant retinal photoreceptor damage. To date, evidence of such photoreceptor damage has been obtained either from studying the responses obtained using electroretinogram (ERG) or from visualization of disruptions in the photoreceptor inner segment-outer segment (IS-OS) junction with spectral-domain optical coherence tomography (SD OCT). The exact histologic characteristics of these lesions have not yet been established.
There is a paucity of histologic data supporting the hypothesis that retinal photoreceptor damage may be an important pathogenetic step in the natural history of WDS. On the other hand, development of newer imaging techniques such as adaptive optics (AO) imaging allows noninvasive structural analysis of retinal photoreceptors. AO imaging compensates for the optical aberrations of the eye and greatly enhances resolution of the retinal images to the order of 2 μm. Such analyses of photoreceptor mosaic in various other ocular conditions such as age-related macular degeneration and hereditary retinal dystrophies have provided valuable insights into the respective disease pathology. However, there is a lack of information on photoreceptor mosaic over choroiditis lesions in literature.
In the index study, assessment of photoreceptor density over lesions in WDS using AO was performed and correlated to retinal function measured using microperimetry (MP).
Methods
This prospective cross-sectional study was performed at the Retina and Uveitis services of the Stanley M. Truhlsen Eye Institute, University of Nebraska Medical Center (UNMC) (Omaha, Nebraska, USA). Imaging analysis was performed in the Ocular Imaging Research and Reading Center. UNMC Institutional Review Board approval was obtained for the protocol prior to the conduct of the study. Written informed consent was obtained from all the patients enrolled in the study. The study adhered to the tenets of the Declaration of Helsinki and the rules laid down by the Health Insurance Portability and Accountability Act of 1996. Patients diagnosed with WDS enrolled from August 10, 2014 to February 1, 2015 were included in the study.
Study Subjects
Patients with the diagnosis of WDS confirmed by a uveitis specialist, using comprehensive clinical examination and findings on OCT and fluorescein angiography (FA), were included in the study. Lesions of WDS within the perifoveal region were selected for image analysis. A maximum of 3 lesions were chosen from each eye. Eyes with choroidal neovascularization, history of vitrectomy, high myopia (>6 diopters), media opacity, and other concomitant conditions that could potentially have affected the photoreceptors were excluded. Lesions from eyes with pseudophakia, vitreous haze ≥2+ (Standardization of Uveitis Nomenclature scale), and dense cataract resulting in ungradable quality of images were also excluded.
Microperimetry Protocol
In this study, the retinal function was assessed in terms of retinal sensitivity values obtained using MP (Optos SLO microperimetry; Optos, Dunfermline, UK). As the retinal sensitivity can be impacted by other imaging modalities, MP was performed prior to other imaging. MP examinations were performed in a dark room after minimum pupillary dilation of 6 mm. In order to minimize the effect of learning, all the patients included in the study had undergone previous MP examination. Patients with poor central fixation and false-positive responses >25% were excluded from the study. Goldmann size III stimulus for 200 ms with a background illumination of 1.27 cd/m 2 was chosen with a testing strategy of 4-2 with eye tracking activated. This stimulus measures approximately 0.43 degrees in diameter, corresponding to an approximately 150 μm area on the retina. The polar 3 pattern consists of 28 points in 3 concentric rings with diameters of approximately 2.3 degrees, 6.6 degrees, and 11 degrees. Owing to the inadequate resolution of the AO camera within 1–1.5 degrees of the foveal reference fixation point (x = 0 degrees, y = 0 degrees), only those WDS lesions (larger than Goldmann stimulus III, ie, 150 μm) located on the outer 2 rings at the tested points on MP were selected for further imaging in the study.
Adaptive Optics Retinal Imaging Protocol
The lesions of WDS were imaged using the AO imaging rtx1 device (Imagine Eyes, Orsay, France). Adequate pupillary dilation (minimum of 7 mm) was ensured prior to imaging. A compact retinal flood-illumination camera rtx1 AO device was used to obtain en face AO fundus images. This device consists of 2 light sources: a 750 nm superluminescent diode that corrects the optical wavefront aberrations and an 850 nm light-emitting diode that illuminates the retina. This device corrects the ocular aberrations by introducing a variable, geometric optical path difference using “deformable mirrors.” The mirror consists of a reflective faceplate acted on by a set of actuators operated by magnetic force. The rtx1 device has a 52-element device that corrects the wavefront by compensating for aberrations arising from various ocular structures to provide high-quality visualization of individual photoreceptor cells. In our study the rtx1 AO retinal camera was used to obtain images from an average of 40 frames covering a retinal area of approximately 4 × 4 degrees over 4.2 seconds. To ensure good-quality images, the degree of AO correction shown on the camera software panel was checked to be <1 before image acquisition. Lateral resolution achieved by the AO device is on the order of ≤2 μm, thereby allowing adequate visualization of the individual cone receptors. Multiple retinal images were obtained in the areas of interest in order to capture the lesions of WDS in the center of the image. The series of 40 frames obtained using AO were then processed using the manufacturer-provided system software (CK v0.1 and AO Detect v0.1, Imagine Eyes).
Optical Coherence Tomography and Autofluorescence Protocol
The selected lesions were also imaged using SD OCT (Spectralis; Heidelberg Engineering, Heidelberg, Germany), color fundus photography, and fundus autofluorescence (FAF) with an ultra-widefield retinal camera (Optos P200Tx; Optos). For the purpose of the study, the lesions of WDS were defined as active in the presence of hyperautofluorescence on FAF within the lesions. SD OCT was performed using the dense line-scan protocol of the Spectralis OCT with the EDI function activated. The scan protocol consisted of a 20 × 20 degree pattern size with 49 B-scans (distance between the scans: 123 μm; 50 frames averaged per B-scan) in the high-resolution mode. SD OCT images were analyzed to assess the IS-OS junction integrity at the location of the selected choroiditis lesion.
Image Analysis
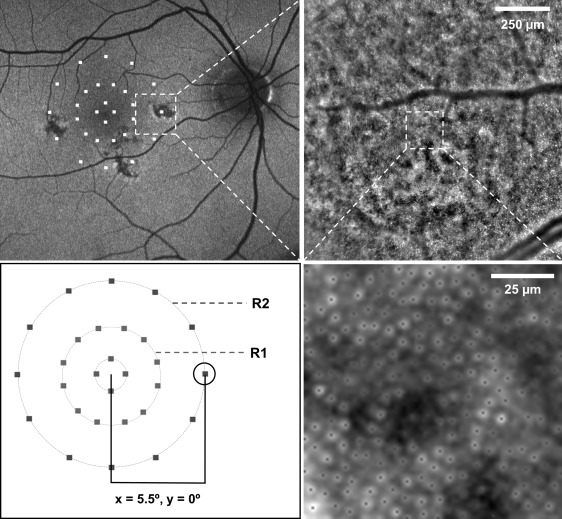
The AO Detect software enables calculation of spatial density and distribution of cone photoreceptors in the area of interest by automatically performing the image-processing algorithm. Cone packing density is calculated as the number of cones counted by the software per square millimeter of the retinal surface (cones/mm 2 ). In order to obtain accurate cone photoreceptor packing density, the image processing software allows correction for the axial length of the eye. The calculation of the size of the retinal image by the software is based on an improvement in the Littmann method described by Bennett and associates. Axial length was calculated for all the patients in the study using IOLMaster (Carl Zeiss Meditec, Dublin, California, USA). After calculation of the axial length, the region of interest (ROI) on the image processing software was selected. A sampling window (ROI) of 100 × 100 μm within the lesion was chosen so that a smaller area of the AO image corresponds to the area of the retina stimulated by the Goldmann size III target. By identifying the x-y coordinates on the AO image, the ROI on the lesion was selected (avoiding blood vessels, if any) so that it approximately correlated topographically to the area of the retina stimulated by a single spot of the MP ( Figure 1 ). The mean photoreceptor packing density and spacing was calculated for each image. Thus, cone measurements were performed at the 2 fixed eccentricities (approximately 3.3 degrees and 5.5 degrees) from the foveal center, corresponding to the outer 2 rings of the MP stimulus pattern.
Manual corrections were applied to the automatic photoreceptor-counting AO Detect software. An independent masked grader performed manual editing to identify missed or overestimated cones by the automatic algorithm using ImageJ (National Institutes of Health, Bethesda, Maryland, USA) (cell counter plugin). For each ROI, the final cone density was calculated after applying manual correction.
Statistical Analysis
For the purpose of data analysis, GraphPad Prism (GraphPad Software Inc, La Jolla, California, USA) version 6.0 was used. Nonparametric tests were used for the data analysis. The mean cone photoreceptor density and spacing was calculated over each lesion. The mean photoreceptor density over active lesions vs inactive lesions as well as lesions with intact vs disrupted IS-OS junction, based on their radial eccentricities, were compared using Mann-Whitney U test. Correlation between the mean photoreceptor density and the retinal sensitivity for both the eccentric loci was assessed using the Spearman rank correlation test. The appearance of the photoreceptor mosaic over the choroiditis lesions on AO imaging was compared to the pattern observed on FAF.
Results
Thirty-five lesions from 19 eyes of 12 patients (3 male and 9 female) were included in the study. The mean age of the patients was 54.4 ± 15.8 years (range: 28–82 years). The diagnoses of the patients included serpiginous choroiditis (2 eyes), birdshot choroidopathy (4 eyes), presumed ocular histoplasmosis syndrome (POHS) (1 eye), punctate inner choroidopathy (8 eyes), and multifocal choroiditis (4 eyes). All the patients with active disease were on treatment with systemic steroids and/or immunosuppressive therapy. The demographic and clinical details of the patients included in the study are specified in Table 1 .
| Number of lesions, (eyes), [patients] | 35, (19), [12] |
| Age (y) mean, (± SD), [range] | 54.4, (± 15.8), [28–82] |
| Sex, no. (%) | |
| Male | 3 (25%) |
| Female | 9 (75%) |
| Mean best-corrected visual acuity, logMAR units (± SD) | 0.17 (± 0.31) |
| Lesion activity, no. (%) a | |
| Active | 16 (45.71%) |
| Inactive | 19 (54.29%) |
| IS-OS junction integrity, no. (%) b | |
| Intact | 14 (40%) |
| Disrupted | 21 (60%) |
| Mean duration of disease, mo (± SD) | 26.75 (± 16.09) |
| Diagnosis, disease (no. of lesions), [%] | Punctate inner choroidopathy (18), [51.43%] |
| Multifocal choroiditis (7), [20%] | |
| Birdshot chorioretinopathy (4), [11.42%] | |
| Presumed ocular histoplasmosis syndrome (3), [8.57%] | |
| Serpiginous choroiditis (3), [8.57%] |
a The lesion activity in this study was assessed based on the presence of hyperautofluorescence within the lesions.
b The IS-OS junction integrity was assessed using optical coherence tomography.
The lesions of WDS were well identified on the AO imaging as areas of photoreceptor irregularity and loss of architecture, corresponding to the findings on color fundus photography and FAF imaging. The size and shape of the lesions varied based on the etiology and correlated well with the appearance on FAF. Color fundus imaging, FAF, and SD OCT imaging of the lesions showed a good correlation with the AO imaging with high-resolution view of the photoreceptor disruption in the affected areas ( Figure 2 ). AO imaging showed better contrast, depicting the affected areas more clearly.
The mean axial length of the studied eyes was 24.18 ± 0.84 mm. Analysis of the cone photoreceptor mosaic revealed absence of visible photoreceptors in 2 AO images (both the lesions were inactive) ( Figure 3 ). The mean photoreceptor packing density in all the lesions taken together was 7563 ± 4552 cones/mm 2 and mean spacing between the photoreceptor cells was 20.79 ± 18.72 μm. Sixteen lesions were classified as active and 19 as inactive based on FAF imaging. The mean photoreceptor packing density overlying 16 active lesions was 7331 ± 4628 cones/mm 2 , whereas the packing density overlying 19 inactive lesions was 6546 ± 3775 cones/mm 2 ( P = .896). The cone spacing over the inactive lesions was 28.92 ± 24.96 μm, whereas it was 13.94 ± 5.84 μm over the active lesions ( P = .03). Cone densities were also calculated at the 2 fixed radial eccentric locations. Nineteen lesions were located on the central ring of the MP (R1) and 16 lesions were located on the outer ring (R2). The mean cone density at R1 was 7143 ± 4690 cones/mm 2 and 6667 ± 3572 cones/mm 2 at R2 ( P = .787) ( Figure 4 ). The comparison of cone densities between active and inactive lesions at these 2 radial eccentric locations are provided in Figure 4 (Top right) ( P = .896 and P = .952 at R1 and R2, respectively).
Stay updated, free articles. Join our Telegram channel

Full access? Get Clinical Tree


