Purpose
To describe and compare the clinical and imaging characteristics of pigment epithelial detachments (PEDs) in age-related macular degeneration (AMD), polypoidal choroidal vasculopathy (PCV), and central serous chorioretinopathy (CSC) as seen in a clinical setting of a tertiary retinal practice.
Design
A perspective supported by clinical and imaging characteristics of a consecutive cohort of patients with strictly defined PEDs.
Results
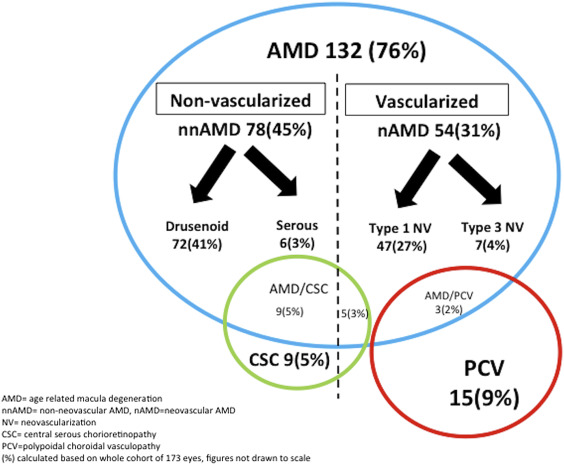
One hundred seventy-four eyes of 113 patients with PEDs were studied with comprehensive clinical retinal examination and multimodal imaging; PEDs were differentiated into nonvascularized and vascularized forms with 3 main underlying etiologies: AMD (76%), PCV (9%), and CSC (3%). AMD was the most common diagnosis, with both nonvascularized PEDs (drusenoid and serous) and vascularized PEDs (type 1 and type 3 neovascularization) associated with drusen and a thin choroid. PCV patients had large, vascularized, peaked PEDs associated with polyps and a variable choroidal thickness, while CSC patients had a thick choroid and predominantly nonvascularized, serous PEDs with an overlying neurosensory detachment. The combined clinical and imaging characteristics form a profile for each PED subtype related to their underlying disease. However, atypical features noted in 11% of patients may complicate the underlying diagnosis.
Conclusion
Typical phenotypic manifestations of PEDs and other features seen with multimodal imaging were associated with specific underlying etiologies. As suggested by our study, identification of these features help clinicians to determine the precise underlying etiology and manage both vascularized PEDs, where evidence-based treatment exists, and nonvascularized PEDs, where current treatment is not supported by convincing evidence.
A pigment epithelial detachment (PED) is defined by an anatomic separation between the basement membrane of the retinal pigment epithelium (RPE) and the inner collagenous layer of the Bruch membrane. The intervening detached cavity may contain a combination of exudate, blood, drusenoid material, and neovascular tissue. PEDs can vary in size, ranging from smaller drusenoid elevations of the RPE to larger exudative or vascularized detachments. In the clinical setting, PEDs are common findings in the fundus caused by myriad macular disorders. The large variety of anatomic and etiologic features associated with PEDs ( Figure 1 ) makes the diagnosis of these patients challenging to comprehensive ophthalmologists and retinal specialists alike. Although PEDs are rarely seen with inflammatory, infiltrative, or oncologic diseases, they are more commonly associated with 3 degenerative diseases ( Figure 1 ), namely non-neovascular and neovascular forms of age-related macular degeneration (AMD), polypoidal choroidal vasculopathy (PCV), and central serous chorioretinopathy (CSC).
Recognition of the specific clinical and imaging features of PEDs can assist the clinician in determining the underlying disease. An accurate diagnosis of the underlying disease can help predict the natural course and serve as a guide for management. Refining the nature of PEDs also provides a framework to guide future research studies. In keeping with these aims, this perspective intends to characterize the nature and frequency of PEDs in a clinical setting of a tertiary retinal practice. Knowledge of the phenotypic clinical characteristics can assist physicians in systematically selecting relevant imaging, in establishing a precise diagnosis, and, ultimately, in enhancing overall management.
Methods
An approved waiver by the Western Institutional Review Board (Olympia, Washington, USA) was obtained based on the observational nature of the study, which only included routine clinical investigation with de-identification of all patients. This study complied with the Health Insurance Portability and Accountability Act of 1996 and follows the tenets of the Declaration of Helsinki. This perspective is based not only on the study of the characteristics of a consecutive series of patients, but also on the author’s observations made over 40 years of experience and additional corroborating reports in the ophthalmic literature.
Study Cohort
A prospective consecutive case series of 174 eyes with PED of 110 patients seen by a single retinal specialist (L.Y.) at a tertiary center from January 2015 to December 2015 was studied. The mean age was 78 years (range, 40–97) and there were 48 male and 62 female patients. This was a cross-sectional study of consecutive patients with PEDs. The diagnosis of the underlying etiology was made on clinical examination combined with the systematic use of multimodal imaging. Figure 1 shows the frequency of PED subtypes with their associated etiology in this series of patients.
Pigment Epithelial Detachment Clinical Definition
A significant PED on spectral-domain optical coherence tomography (SDOCT) was defined using measurements on cross-sectional B-scans ( Figure 2 , Left). To be included in this series, PEDs had to have a minimum greatest linear width (measured from the 2 edges of the PED) of 500 μm, a minimum height (measured from the apex of the PED to the Bruch membrane) of 100 μm, and a minimum cross-sectional area of 0.05 mm 2 . The definition of a “small” PED was a cross-sectional area equal to or smaller than 0.1 mm 2 , whereas a “large PED” had an area larger than 0.1 mm 2 . If there was the presence of 2 adjacent coalescent PEDs, they would be considered as a single lesion if the height of the intervening space was more than 100 μm. Ideally, volume would also be a useful measure, but the Heidelberg SDOCT used to image the patients in our series did not have this automated software capability.
The Systematic Use of Multimodal Imaging in Eyes With Pigment Epithelial Detachment
In this multimodal-imaging era, judicious use of available imaging modalities and accurate interpretation of imaging findings are crucial to study the anatomic nature of PEDs. Multimodal imaging also aids the clinician in making an accurate diagnosis of the underlying disease. Color fundus photographs (TRC 501; Topcon Medical Systems, Tokyo, Japan) in combination with SDOCT (HRA Spectralis; Heidelberg Engineering, Heidelberg, Germany) were used to determine the various anatomic subtypes of the PEDs present in the eyes of our study cohort. A vascularized PED was suspected when blood, hard exudation, or subretinal fluid was detected. Fluorescein angiography (FA) and indocyanine green angiography (ICGA) (TRC 501; Topcon Medical Systems, Tokyo, Japan or HRA Spectralis; Heidelberg Engineering) was then performed to confirm the presence of a vascularized PED and to make the diagnosis of the underlying disease. When the vascularization underneath the PED was unclear on conventional dye angiography, OCT angiography (OCTA, RTVue XR “Avanti”; Optovue, Fremont, California, USA) was performed. A vascularized PED was suspected when there was a positive flow signal underneath the PED on cross-sectional OCTA that corresponded with a distinct tangle of vessels seen on en face OCTA, in the absence of motion and projection artifact. In cases where nonvascularized PEDs had associated subretinal vitelliform detachment, the absence of flow under the PED was also useful to exclude neovascularization and helped differentiate vitelliform detachments from subretinal exudation. A vitelliform detachment could also be confirmed with fundus autofluorescence (FAF) (TRC 501; Topcon Medical Systems: excitation 550 nm with matched barrier filter 665 nm). FAF was also useful to delineate areas of retinal pigment epithelial (RPE) atrophy associated with the PED.
Phenotypic Characteristics of Different Subtypes of Pigment Epithelial Detachments and Associated Features Seen on Multimodal Imaging
Age-Related Macular Degeneration
AMD was the most common underlying etiology in our series of patients with PED (76%), and both nonvascularized and vascularized PEDs can occur ( Figure 1 ). Non-neovascular AMD is commonly the result of drusenoid PEDs; however, less commonly the PEDs in AMD may be predominantly serous in nature ( Figure 1 ).
Non-neovascular Pigment Epithelial Detachments in Age-Related Macular Degeneration
Drusenoid Pigment Epithelial Detachments
Drusenoid PEDs ( Figure 2 , Left) were the most common nonvascularized PED subtype seen in our study cohort, affecting 72 of 174 eyes, 41% of all our cases ( Figure 1 ). Drusenoid PEDs were defined on clinical examination as yellowish white lobular structures that appear on cross-sectional OCT imaging as discrete lobular detachments of the RPE with underlying homogenous, hyperreflective material affecting the central macula. Drusenoid PEDs are associated with high-risk dry AMD, in our study, and were virtually always in white, elderly patients with drusen. Drusen typically enlarge and become coalescent to form drusenoid PEDs ( Figure 2 , Left). Drusenoid PEDs are usually bilateral but asymmetrical. They have scalloped borders owing to the coalescence of smaller lesions, which may eventually form a larger lesion. Compared with other PED subtypes in our series, drusenoid PEDs were usually the smallest ( Table ). Chronic changes on the surface of the drusenoid PEDs included pigmentary changes in a stellate or speckled pattern, as well as subsequent atrophy when there was collapse of the PED. Typically subretinal hemorrhage is conspicuously absent and lipid exudation is rare, and so far there has been no reported case of RPE tears associated with a purely drusenoid PED. Spontaneous resolution is well known to occur, but unfortunately this may be associated with persistent visual decline owing to atrophy.
| Features | AMD | PCV | CSC | |||
|---|---|---|---|---|---|---|
| Nonvascularized | Vascularized | Vascularized | Nonvascularized Serous | |||
| Drusenoid | Serous | Type 1 | Type 3 | |||
| Demographics | Elderly, white | Elderly, white | Elderly, white | Elderly, white | Middle aged, Asian or African | Young, male, hyperopic |
| Shape | Lobular | Larger, convex, steep edges | Irregular, shallow | Apical retinal vessels | Notched or peaked PED | Circular with orange ring |
| Location | Central macula | Central macula | Central macula | Eccentric | Central macula Eccentric | Central macula Eccentric |
| Size of PED (SD) | ||||||
| Mean width, μm | 879 (398) | 2272 (1009) | 1949 (929) | 1592 (1228) | 1954 (1309) | 1169 (385) |
| Mean height, μm | 155 (48) | 463 (231) | 245 (130) | 174 (51) | 537 (178) | 247 (157) |
| Mean area, mm 2 | 0.11 (0.08) | 0.81 (0.57) | 0.32 (0.3) | 0.22 (0.2) | 1.24 (0.77) | 0.22 (0.2) |
| % of large PEDs | 25 | 83 | 83 | 87 | 80 | 67 |
| Choroidal features | Thin | Thin | Thin | Thin | Normal to thick, pachychoroid | Thick, pachychoroid |
| Nature of sub-RPE space | Homogeneous, hyperreflective | Heterogenous, hyporeflective | Heterogeneous, hyperreflective | Variable appearance with stage | Focal, hyperreflective | Homogenous, hyporeflective |
| RPE tears | None | None | Common | Very rarely | Very rarely | Infrequent |
| Drusen | Widespread | Widespread | Common | Common, reticular pseudodrusen | Uncommon | None |
| Hemorrhage | None | None | Subretinal | Small, intraretinal/subretinal | Large, multilayer | None |
| Intraretinal cysts | None | None | Common | Very common | Rare | Rare |
| Vitelliform | Common | Very common | Uncommon | None | None | Common |
| Flow signal on OCTA | No flow | No flow | Flow signal, sub-RPE | Flow signal, intraretinal | Flow at polyp border, sub-RPE | No flow |
Imaging Features
FAF imaging of drusenoid PEDs typically have a homogenous isoautofluorescent or mildly hyperautofluorescent appearance that may be surrounded by a relatively hypoautofluorescent border ( Figure 2 , Left). Focal areas of increased autofluorescence can be seen corresponding to areas of pigmentary changes or lipofuscin deposits. Progressive RPE thinning and atrophy overlying the dome of the PED will appear hypoautofluorescent on FAF ( Figure 2 , Left).
Early-phase FA findings generally show some mild hyperfluorescence, which increases with time and pools into the sub-RPE space in the later stages. Focal hypofluorescence can occur from blockage owing to the overlying pigmentary changes. On ICGA, a drusenoid PED should remain largely hypofluorescent through the whole sequence.
OCT imaging ( Figure 2 , Left) of the drusenoid PEDs show lobular structures with undulating surfaces and an underlying homogenous, moderately hyperreflective signal. Compared with serous PEDs or vascularized PEDs, drusenoid PEDs have a smaller diameter, height, and area. Their borders have a less convex and more gradual contour when compared with other subtypes of PEDs. Pigmentary changes overlying the PED can appear as intraretinal hyperreflective material on OCT. Recent studies show that disruptions in the RPE hyperreflective band preceded the collapse and change in PED volume that most commonly results in RPE atrophy. No intraretinal or subretinal fluid overlying drusenoid PEDs is usually observed. The choroid is thin in these patients, consistent with previous studies.
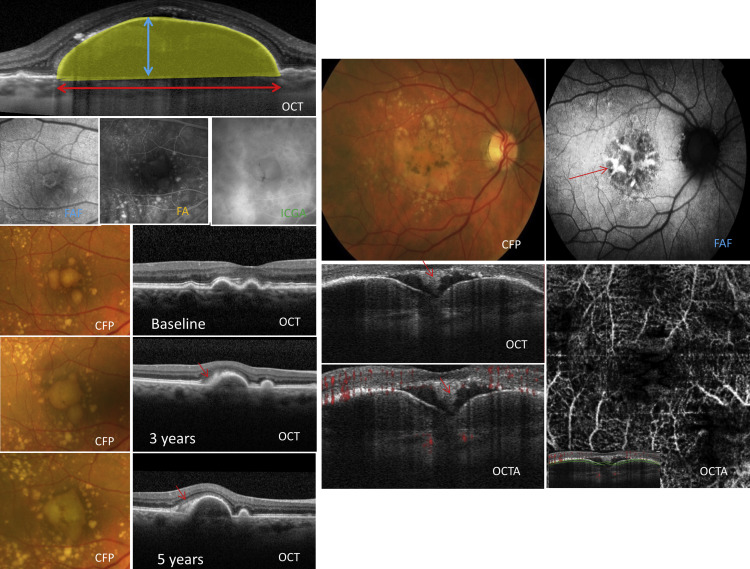
One of the most important features of a drusenoid detachment is the presence of a vitelliform detachment in the subretinal space overlying the PED, occurring in 21% of all drusenoid PEDs in our study ( Figure 2 , Right). Other features of non-neovascular AMD, such as cuticular drusen ( Figure 2 , Right), reticular pseudodrusen, and large drusen, may also be present. The vitelliform reflectance appears as collections of yellowish material seen as hyperreflective subretinal collections on OCT imaging ( Figure 2 , Right). With FAF imaging these vitelliform lesions can be highly hyperautofluorescent ( Figure 2 , Right).
OCTA of a drusenoid PED shows no abnormal choroidal flow beneath the PED on cross-sectional OCTA with the absence of a definite tangle of vessels on en face OCTA. However, artifacts on OCTA caused by movement, vessel projection under the RPE from the more superficial retinal vessels, or unmasking from overlying RPE atrophy can cause false-positive flow signals. PEDs of a greater height are also difficult to image owing to inaccurate segmentation and masking of features beneath the PED.
Serous Pigment Epithelial Detachments
Less commonly in our study, non-neovascular AMD was associated with larger PEDs that have an appearance of both serous and drusenoid components (6 eyes [3%]; Figure 2 , Right). For our study, serous PEDs in AMD were defined on OCT as PEDs with a hyporeflective sub-RPE area that occupied more than 50% of the total area. Most serous PEDs associated with AMD were composed of both drusenoid and serous components and a purely serous PED was rare in these eyes. FAF, FA, and ICGA findings vary according to the serous or drusenoid contents of the PED. OCT showed the appearance of hyporeflective and hyperreflective areas within the PED ( Figure 2 , Right). Vitelliform deposits are very common and are seen in 83% of all eyes with serous PEDs associated with AMD. OCTA confirms a nonvascularized PED, with no signs of abnormal flow underneath the RPE ( Figure 2 , Right).
Neovascular Pigment Epithelial Detachments in Age-Related Macular Degeneration
Based on multimodal imaging, 3 types of neovascularization has been described in AMD: type 1 neovascularization (NV) is choroidal vascular tissue located underneath the RPE and is associated with vascularized PEDs, type 2 NV is choroidal vascular tissue above the RPE, and type 3 is intraretinal NV, also known as retinal angiomatous proliferation (RAP), that may have an underlying PED ( Table ).
Type 1 Neovascularization
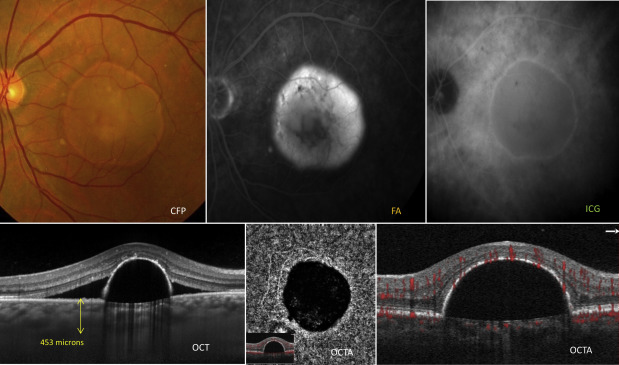
In our cohort of patients, the most common vascularized PED associated with neovascular AMD was type 1 NV (47 eyes [27% of all eyes studied]) ( Figure 3 ). Similarly, as in all AMD subtypes, type 1 NV was more common in elderly, white patients with drusen and a thin choroid. Although theoretically all type 1 NVs are associated with a PED, for the purpose of our study, we only included type 1 NVs with significant PEDs with a minimum size that fulfilled our inclusion criteria. Type 1 NVs associated with a PED can also be referred to as a fibrovascular PED. Type 1 vascularized PEDs are characteristically poorly circumscribed, have irregular margins, and can be associated with chorioretinal folds ( Figure 3 ). Lipids and subretinal or sub-RPE bleeding are other indicative signs of a vascularized PED ( Figure 3 ). On examination, vascularized PEDs can be seen in combination with serous PEDs, or in some cases there may be a lesion with serous and vascularized components. A notch at the edge of an otherwise circular or oval PED is highly suspicious of an underlying vascularization. Complications such as extensive bleeding, fibrovascular scarring, and RPE rips in large PEDs are common features of type 1 NV. Vitelliform lesions are uncommon, seen in only 8.5% of type 1 NV patients with PED in our study. PEDs associated with type 1 NV most commonly affect the central macula and involvement of the peripheral fundus or peripapillary region is uncommon.
Imaging Features
FAF imaging shows similar findings to nonvascularized PEDs and typical hyperautofluorescent bands in areas of pigment clumping. Some eyes had a border of hypoautofluorescence; however, hemorrhagic components on FAF show hypoautofluorescence owing to blockage ( Figure 3 ).
FA shows an irregular pattern of stippled hyperfluorescence that increases in size, with gradual pooling and leakage of the lesion in the late phase of the study ( Figure 3 ). In large PEDs, with both serous and vascularized components, the neovascularization commonly occurs in the notched area and may appear as irregular hyperfluorescence and late leakage. Vascularized PEDs can appear on ICGA as either a “hot spot” of well-defined hyperfluorescence or a large, less well-defined area of hyperfluorescence known as a “plaque.” In the presence of a PED, ICGA allows better delineation of the underlying neovascularization than FA and may be able to differentiate between more active and quiescent lesions.
On OCT imaging, vascularized PEDs have less-defined margins, uneven surfaces, and an irregular shape. A previous study using enhanced depth OCT imaging showed that in about half of these vascularized PEDs, the entire PED cavity was filled with highly hyperreflective material while the other half had heterogeneous collections of serous fluid and hyperreflective material ( Figure 3 ). The hyperreflective material was located on the underside of the surface of the RPE and was likely representative of fibrovascular proliferation that sometimes causes a separation between the Bruch and the RPE membrane on OCT ( Figure 3 ). In some cases the “onion layer sign,” which has been histologically correlated with cholesterol deposition within the vascularized PED, may also be present ( Figure 3 ). The choroid in these patients is usually thin.
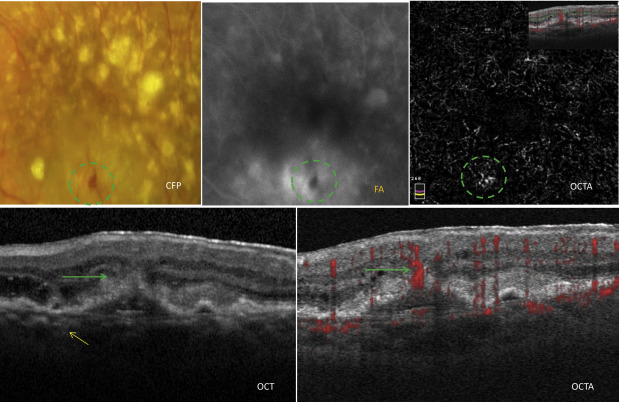
An active type 1 NV ( Figure 3 ) imaged on en face OCTA has been characterized by features such as (1) shape, a well-defined (lacy-wheel or sea-fan shaped) tangle of vessels ( Figure 3 ); (2) branching, numerous tiny capillaries, typical of a recent lesion; (3) the presence of anastomoses and loops; (4) morphology of the vessel termini, assessing the presence of a peripheral arcade; and (5) the presence of a perilesional hypointense halo, considered as regions of choriocapillaris alteration. Flow signals are detected under the PED on cross-sectional OCTA ( Figure 3 ). A previous study on eyes with high risk for type 1 NV showed that in the absence of leakage on dye angiography and structural OCT, up to 6% of eyes had evidence of type 1 NV on OCTA.
Type 2 Neovascularization
Type 2 NV is not usually associated with a PED, but in some cases a type 2 NV may coexist with a type 1 NV PED. No patients with type 2 NV were included in our series.
Type 3 Neovascularization
In our study, a less common form of neovascular AMD was type 3 NV (7 eyes [4%]), also known as RAP. Type 3 NV is characterized by the development of predominantly intraretinal vascularization that can be associated with a vascularized PED in about 86%–93% of cases ( Figure 4 ). In our study, elderly, white patients were the most commonly affected and drusen, in particular reticular pseudodrusen, are commonly present in these eyes. Clinical examination shows smaller intraretinal hemorrhages and predominantly intraretinal fluid in the vicinity of the type 3 NV ( Figure 4 ). The lesion is located in the extrafoveal or perifoveal region, away from the foveal avascular zone, and occasionally a right-angled vessel can be seen. Involvement of the subfoveal avascular zone, peripheral fundus, or peripapillary region is rare. Compared with other types of neovascular AMD, type 3 NVs present with smaller lesions and are more commonly bilateral and associated with RPE atrophy, but less commonly associated with disciform scarring and subretinal fibrosis. Vascularized PEDs associated with type 3 NVs seen in our study were generally slightly smaller compared with PEDs associated with type 1 NV ( Table ). None of our type 3 NV patients in our study had associated vitelliform detachments, and RPE rips are rarely seen in these eyes unless there is the presence of an associated type 1 NV.
Imaging Features
FA imaging of type 3 NV showed early pinpoint leakage with stippled hyperfluorescence in the late stage that can resemble a fibrovascular PED ( Figure 4 ). On both FA and ICGA, in the early frames, the presence of the intraretinal vascular anomalous complex can sometimes be imaged (right-angled vessels). In addition, a “hot spot” seen on ICGA in the late angiographic frames with focal leakage corresponds to the hyperreflective funnel-like structure seen on OCT ( Figure 4 ). Videoangiography (Heidelberg) may allow visualization of the retinal choroidal anastomosis in the early filling stage before the surrounding leakage occurs.
OCT findings in type 3 NV have similar characteristics to other vascularized PEDs, such as an irregular surface and underlying hyperreflective material ( Figure 4 ). In our study cohort, PEDs associated with type 3 NVs were shallower and smaller compared with other vascularized PEDs associated with type 1 NV and PCV. Type 3 lesions were seen as central hyperreflective funnel-like lesions above the PED that join the deep vascular plexus to the inner retinal layers. Progression of the type 3 NV may cause a focal RPE break on the surface of the PED ( Figure 4 ). This intraretinal hyperreflective structure bordered by intraretinal cystic changes forms a “mask”-like lesion on OCT ( Figure 4 ). The choroid is usually thin, and focal areas of atrophy that can be seen on FAF imaging are common.
Cross-sectional OCTA imaging of typical type 3 NV shows the presence of a discrete, linear flow signal that can extend from the deep vascular plexus to the more superficial retinal layers. Progression of type 3 NV can cause extension through the RPE ( Figure 4 ). There was no clear spread of the signal into the surrounding subretinal or sub-RPE space, nor were there definite signs of a retinal choroidal anastomosis in most cases ( Figure 4 ). Corresponding en face OCTA imaging shows the presence of a high-flow tuft of vessels, seen to correspond with the hyperreflective funnel seen on structural OCT and pinpoint leakage points seen on FA ( Figure 4 ).
Polypoidal Choroidal Vasculopathy
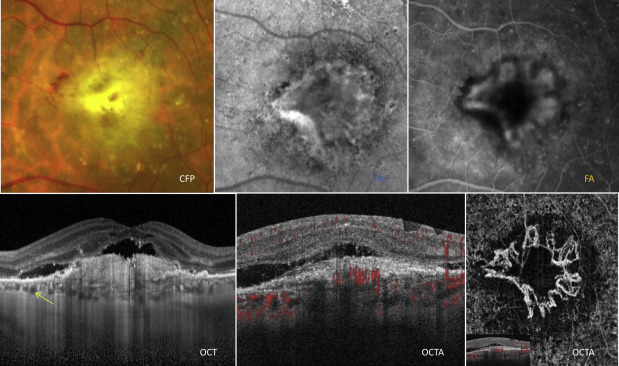
PCV was the second most common disease in our study cohort associated with PEDs and affected 15 eyes of 12 patients (9% of all patients) ( Figure 5 ). PCV was defined as the presence of polypoidal lesions with a branching vascular network (BVN) as seen on multimodal imaging, in particular OCT and ICGA. PCV is typically more common in Asian and African patients who are middle-aged. However, PCV can occur in white patients with large, hemorrhagic, exudative PEDs. In our study, all of our PCV patients were white. Anecdotal observations have suggested PCV may be more common in white patients, who have highly pigmented choroids. Polyps, which may appear as peaked vascularized PEDs, may also be seen adjacent to or within larger serous PEDs. Compared with other PED subtypes in our study cohort, significantly larger, eccentric PEDs were associated with PCV. Apart from the macular region, PEDs associated with PCV were also observed to occur in the peripheral fundus and peripapillary region.
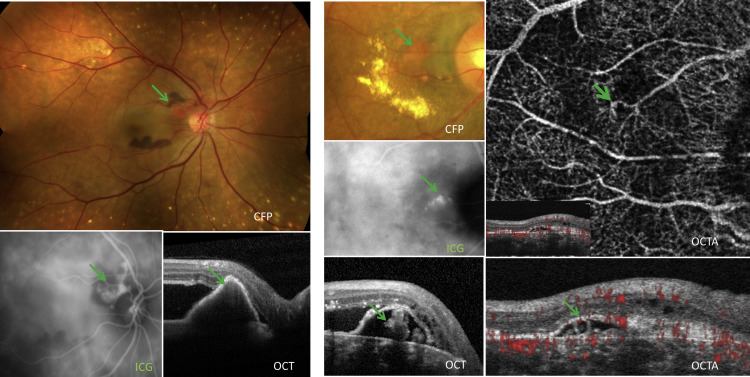
Polyps are characterized by orange aneurysmal dilatations that are seen between the choroid and Bruch membrane ( Figure 5 ). Drusen are uncommon, and features of a thickened choroid with reduced definition of the choroidal vessels on clinical examination may be present. A PCV lesion is frequently associated with multiple large PEDs and the presence of subretinal or sub-RPE blood ( Figure 5 , Left) and lipid exudation ( Figure 5 , Right). In cases where bleeding is extensive, there can be breakthrough bleeding into the vitreous cavity. Similar to the other vascularized PEDs, the PCV is commonly located beneath or at the margin of the elevated RPE ( Figure 5 ). Complications such as RPE rips are very rare in PCV compared to AMD patients (0.65% vs 3.5%) unless there was previous use of thermal or photodynamic laser treatment or there was the presence of large areas of hemorrhage. The explanation for this difference in frequency of rips is uncertain; one proposed theory includes a less adherent vascular tissue to the undersurface of the RPE in the PED resulting in less sub-RPE fibrosis and less mechanical contraction of the vascular tissue in response to treatment.
Imaging Features
FAF findings of PCV show confluent hypoautofluorescence with a surrounding hyperfluorescent ring of the polyp and a granular hypoautofluorescence of the associated BVN. FA is less helpful in PCV diagnosis and features may mimic those of type 1 NV. On the other hand, ICGA is extremely useful to image the polypoidal lesion as well as its associated branching vascular network ( Figure 5 , Left). Several features that can be seen on ICGA are indicative of polyps, such as an early focal hyperfluorescence with a late hyperfluorescent halo and an anterior projection of the polyp from the underlying choroidal circulation, as seen on stereoscopic viewing. Previous studies have described other ICGA features that are associated with more aggressive disease progression and an increased risk of complications, such as polyps with a “cluster of grapes” configuration, a leaking BVN, pulsatility of the polyp or BVN, and large lesions. Choroidal hyperpermeability seen on middle and late phases of ICGA has also been a feature associated with PCV.
Polyps can be visualized on OCT in a few ways: underneath the surface of a large serous PED as a series of round structures (“pearls on string appearance”), as a smaller peaked PED (at the area of the notch) adjacent to a larger serous PED, or as sharp peak-like elevations within a PED with underlying moderate reflectivity ( Figure 5 ). In some cases, the elevated region of neovascularization left a hyporeflective cleft over the Bruch membrane, resulting in a multilayered PED that was described as the “triple-layer sign.” A normal to thick choroid with the presence of large choroidal vessels is noted in these patients. Previous study supports these findings and has shown that the subfoveal choroid in eyes with PCV is thicker (319.92 ± 68.66 μm) when compared to patients with AMD and no polyps (186.62 ± 64.02 μm) and normal controls (241.97 ± 66.37 μm) but thinner when compared to eyes with CSC (367.81 ± 105.56 μm).
On en face OCTA, the BVN was clearly imaged with an appearance comparable with ICGA; however, the polyps were better seen on cross-sectional OCTA compared with en face OCTA. On cross-sectional OCTA, flow signals were seen to surround the polyp edge but the lumen was largely devoid of flow ( Figure 5 , Right). These flow signals were confined to the region between the RPE and underlying Bruch membrane. Eyes with PCV that have extensive edema, exudation, hemorrhage, or large PEDs are challenging to image with OCTA owing to difficulties with segmentation.
Central Serous Chorioretinopathy
CSC was the least common disease in our cohort associated with PEDs and affected 9 eyes of 7 patients (5% of our study cohort). Typically, acute CSC, as seen in 6 eyes, was defined as serous PEDs with areas of neurosensory detachments ( Figure 6 ). Chronic CSC was seen in an additional 3 eyes in our study, defined by the presence a PED, thickened choroid, and pigmentary changes suggestive of a previous CSC, but no neurosensory detachment. CSC occurs more commonly in middle-aged men with hyperopia with no drusen. CSC is commonly associated with nonvascularized, smaller, serous PEDs that are often located in an eccentric position with no associated drusen ( Table ). PEDs are present in 70%–100% of eyes with CSC. Dome-shaped serous PEDs were reported as being more common in acute CSC while shallow, irregular PEDs were more common in chronic CSC. Serous PEDs that contain exudative material are well-circumscribed, circular or oval-shaped structures and may be surrounded by an orange ring ( Figure 6 ). This orange ring may be formed because of the difference in consistency of the serous fluid from the surrounding retina. PEDs associated with CSC were variable in size and were observed to occur most commonly in the macular region and less commonly in the peripheral fundus.