Purpose
To identify reliable criteria based on spectral-domain optical coherence tomography (SD OCT) to monitor disease progression in geographic atrophy attributable to age-related macular degeneration (AMD) compared with lesion size determination based on fundus autofluorescence (FAF).
Design
Prospective longitudinal observational study.
Methods
setting : Institutional. study population : A total of 48 eyes in 24 patients with geographic atrophy. observation procedures : Eyes with geographic atrophy were included and examined at baseline and at months 3, 6, 9, and 12. At each study visit best-corrected visual acuity (BCVA), FAF, and SD OCT imaging were performed. FAF images were analyzed using the region overlay device. Planimetric measurements in SD OCT, including alterations or loss of outer retinal layers and the RPE, as well as choroidal signal enhancement, were performed with the OCT Toolkit. main outcome measures : Areas of interest in patients with geographic atrophy measured from baseline to month 12 by SD OCT compared with the area of atrophy measured by FAF.
Results
Geographic atrophy lesion size increased from 8.88 mm² to 11.22 mm² based on quantitative FAF evaluation. Linear regression analysis demonstrated that results similar to FAF planimetry for determining lesion progression can be obtained by measuring the areas of outer plexiform layer thinning (adjusted R 2 = 0.93), external limiting membrane loss (adjusted R 2 = 0.89), or choroidal signal enhancement ( R 2 = 0.93) by SD OCT.
Conclusions
SD OCT allows morphologic markers of disease progression to be identified in geographic atrophy and may improve understanding of the pathophysiology of atrophic AMD.
Age-related macular degeneration (AMD) is the leading cause of irreversible vision impairment in the elderly population of affluent countries. Drusen and alterations of the retinal pigment epithelium (RPE) are clinical hallmarks of early AMD and increase in patients over 60 years of age. However, vision loss becomes significant in the advanced stage of geographic atrophy, with progressive loss of RPE cells and concomitant degeneration of adjacent neurosensory layers. Despite extensive research into the pathophysiology, diagnosis, and therapy of AMD, solid results through strict monitoring by optical coherence tomography (OCT) have, to date, only been achieved for exudative AMD. Many multicenter clinical studies focusing on new therapeutic strategies in geographic atrophy have recently been initiated, but a diagnostic and therapeutic breakthrough is still needed for this frequent type of AMD. These studies have primarily used fundus autofluorescence (FAF) imaging to evaluate progressive geographic atrophy enlargement and therapeutic benefit. FAF demarcates the lesion borders more precisely than clinical observation or fundus photography because it is based on the optical properties of lipofuscin and photoreceptor degeneration products such as the fluorophore A2E at the level of metabolically active RPE and enhances the contrast between intact (ie, normal fluorescence) and lost (ie, absent fluorescence) RPE. However, based on extensive experience in exudative AMD, OCT has become an established gold-standard diagnostic tool in the management of AMD and is used extensively in clinical practice. It identifies all the morphologic stages of disease progression and has quantitative options for lesion size determination in geographic atrophy using dense raster scanning.
In contrast to FAF, spectral-domain (SD) OCT technology, which allows detailed insight into ultrastructural alterations of retinal and subretinal layers, has not yet been used in a standardized way to monitor disease progression of geographic atrophy in patients with AMD. Furthermore, whereas a strong focus has been set on qualitative morphologic findings in SD OCT, quantitative lesion size measurements have been neglected owing to the paucity of reproducible and relevant criteria defining the lesion area. In a recent cross-sectional study, our study group identified robust and solid SD OCT parameters for measuring the size of atrophic lesions. This previous study aimed to systematically identify and compare parameters that reflect the impact of geographic atrophy lesions on morphologic correlates relevant for macular function, including neurosensory retinal layers, retinal pigment epithelium (RPE), and the area of choroidal signal enhancement (hyper-reflectivity). Disappearance of the external limiting membrane (ELM) and choroidal signal enhancement at the level of the choroid were shown to be the most reliable parameters for quantifying lesion size by SD OCT.
In a further step, the present prospective study aims to provide longitudinal datasets in a relatively short follow-up with frequent study visits to evaluate the ability of SD OCT to detect and monitor discrete changes in lesion size progression equivalent to FAF measurements in patients with geographic atrophy. A comparison of defined morphologic features over time should allow measurements that are relevant for monitoring geographic atrophy disease progression to be distinguished from those that are not relevant. Such a comparison should also provide the basis for useful SD OCT protocols for further trials supported by a reading center, which should in turn offer precise and practical procedures for diagnosis and follow-up in clinical practice, for instance, when new treatments become available.
Methods
Patients for this prospective longitudinal study were recruited by the Department of Ophthalmology at the Medical University of Vienna. The institutional ethics committee of the Medical University of Vienna approved the study. Written informed consent was obtained from each participant before inclusion in the study. The study protocol and procedures followed the tenets of the Declaration of Helsinki. The study is registered at the Ethics Committee in Vienna ( http://ethikkommission.meduniwien.ac.at ). The registration number is EK569/2011.
Inclusion/Exclusion Criteria and Follow-up
Patients were diagnosed and followed prospectively according to a standardized protocol. Inclusion and exclusion criteria were identical to those in the previous study, except that both eyes had to meet all criteria. Patients had to be at least 55 years of age and both eyes had to have a geographic atrophy lesion of at least 1.25 mm 2 . Other inclusion criteria were best-corrected visual acuity (BCVA) ≥20/200 on the primary study eye, no signs of early or late choroidal neovascularization (CNV) detectable by biomicroscopy or SD OCT in either eye (in case of doubt, fluorescein angiography [FA] was performed), no signs or history of any other ocular diseases that might confound assessment of the retina, and no relevant ocular media opacity at the screening visit.
Except for BCVA decrease, study eyes were excluded if 1 of the above exclusion criteria emerged during the 12 months of follow-up.
Study visits were scheduled at baseline and at 3-month intervals. At each visit, patients underwent a complete BCVA examination using the Early Treatment Diabetic Retinopathy Study (ETDRS) charts, slit-lamp biomicroscopy, and ophthalmoscopy, as well as SD OCT and FAF examinations using the Spectralis HRA+OCT (Heidelberg Engineering, Heidelberg, Germany).
Spectral-Domain Optical Coherence Tomography and Fundus Autofluorescence Imaging
Analogous to the baseline study, FAF was performed using a Spectralis HRA+OCT with a frame size of 30 × 30 degrees and a resolution of 768 × 768 pixels in the high-speed mode. The mean intensity image was calculated out of 15 frames after a 7-second video had been recorded in the FAF mode. Brightness and contrast were adjusted manually for every video acquisition at each visit. The follow-up function was used for all visits after the baseline examination.
Two readers certified by the Vienna Reading Center (VRC) ( www.readingcenter.at ) measured geographic atrophy lesion size in FAF in a consensus reading using the region overlay device of the Heidelberg Eye Explorer (Heidelberg Engineering, Heidelberg, Germany). The hypofluorescent area indicating atrophy in FAF (area R) was delineated after enlargement of the intensity image with an external stylus (Wacom Bamboo Pen & Touch; Wacom Technology Corp, Vancouver, Washington, USA). These measurements served as reference values throughout the study.
SD OCT procedures were carried out throughout the follow-up using the Spectralis HRA+OCT system. The study protocol for SD OCT comprised a standard of 49 B-scans per volume scan with 20 × 20 degrees, and each scan was averaged using the ART mode of the Spectralis HRA+OCT device with 30 frames per B-scan. The protocol allowed enlargement of the scan area in eyes with large atrophic areas not displayable in the 20 × 20 degree volume scan. Furthermore, if the acquisition of the standard SD OCT volume scan was not feasible owing to unstable fixation and reduced compliance, the protocol allowed both the number of frames acquired for each B-scan and the number of B-scans in the volume scan to be reduced. Unpublished data from an internal study by the Vienna Reading Center have shown that areas measured by SD OCT are not dependent on B-scan density if the number of B-scans is between 25 and 49 per volume scan. A minimum of 25 B-scans per volume scan with a minimum of 20 frames per B-scan were required. The distances from B-scan to B-scan were registered automatically and exported together with all B-scans, and were used for further analysis by the OCT Toolkit software described in the previous study.
Parameters and Measurements by Spectral-Domain Optical Coherence Tomography
An updated version of the OCT Toolkit was used in this study that allowed planimetric measurements of areas in SD OCT volume stacks and evaluation of lesion progression. The basic structure of the OCT Toolkit remained identical to the version used previously. The program imports xml files generated by the Spectralis Data Export Interface. Using this software, an area of interest in geographic atrophy (eg, loss of RPE or choroidal signal enhancement) can be manually graded in each SD OCT B-scan, and is projected in an en face image. Finally, grading a complete SD OCT volume stack results in a planimetrically measured en face area based on SD OCT cross-sectional images.
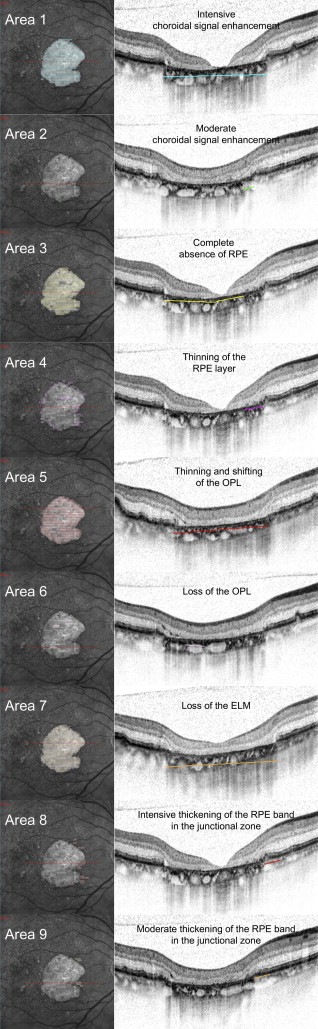
Individual areas of interest graded in SD OCT B-scans included changes at the level of the outer neurosensory retina, alterations of the RPE (thickening or loss), and changes at the level of the choroid ( Figure 1 and Table 1 ).
| Area | Method | Description |
|---|---|---|
| Area 1 | SD OCT | Area of complete choroidal signal enhancement |
| Area 2 | SD OCT | Area of questionable choroidal signal enhancement |
| Area 1/2 | SD OCT | Area of any choroidal signal enhancement |
| Area 3 | SD OCT | Area of complete RPE loss |
| Area 4 | SD OCT | Area of considerable thinning of more than 50% of the healthy RPE layer |
| Area 3/4 | SD OCT | Area of altered RPE |
| Area 5 | SD OCT | Area of thinning and shifting of the outer plexiform layer |
| Area 6 | SD OCT | Area of loss of the outer plexiform layer |
| Area 7 | SD OCT | Area of external limiting membrane loss |
| Area 8 | SD OCT | Area of definitive thickening of the hyper-reflective RPE layer in comparison to normal RPE band |
| Area 9 | SD OCT | Area of questionable thickening of the hyper-reflective RPE layer |
| Area 8/9 | SD OCT | Area of any thickening of the hyper-reflective RPE layer |
| Area R | FAF | Area of absent fundus autofluorescence |
In this study, we focused on distinct and advanced RPE changes detectable by SD OCT. In addition to loss/atrophy, 2 additional features of interest, identified by intensive/moderate thickening of the RPE, which had not been used in our previous grading, were introduced into this study. These areas are assumed to demonstrate morphologic changes at the level of the RPE in the junction zone of a geographic atrophy lesion and may indicate progression of an early pathophysiological process that can be detected early by SD OCT. Furthermore, the grading criterion for the area of questionable loss of the RPE in our previous study was updated to detect moderately altered RPE within the total area in SD OCT.
All other definitions used for retinal layer alteration graded in SD OCT B-scans were those described previously. The planimetric measurements of areas 1–9 were compared with area R, which represents the standard area of geographic atrophy documented by FAF.
Statistical Analysis
The complete dataset was analyzed. The last observation carried forward (LOCF) method was applied to assess monotonicity (see below) and deal with missing observations attributable to skipped visits.
All other statistics were performed on the original data with missing observations omitted. Therefore only real data from actual and graded examinations were compared with each other. Data analysis was executed in an established statistical environment (R version 2.13.0; www.r-project.org ). First-order descriptive statistics were computed to provide simple characterization of the values measured. Based on the descriptive statistics of this study and the results of the baseline study, the potential areas of interest comparable to FAF in measuring the lesion area were determined and analyzed using a linear regression model confirming potential relations between areas of interest in SD OCT and FAF. Using the same statistical model, potential relations between different areas of interest in SD OCT were analyzed.
Kendall coefficients of concordance as well as Pearson correlations were computed to quantify inter-grader reproducibility of the grading of the areas measured by SD OCT.
Finally, calculations using the Mann-Whitney U test were performed to determine if the areas of interest measured in SD OCT followed a monotonic growth, as suggested by the pathophysiology of atrophic AMD. Therefore the baseline data from the SD OCT and FAF measurements of the previous study were analyzed to obtain a measure for typical inter-grader variability for each graded area of interest in SD OCT and FAF. This inter-grader variability was set as the reference for calculations of monotonic growth in the present study. Differences between measurements at subsequent time points were considered statistically significant when they were clearly above this reference variability (Mann-Whitney U test, with P < 5%) and were defined accordingly as either statistically significantly positive or significantly negative if P was <.05. They were defined as nonsignificant if P was ≥.05.
Results
Clinical Progression of Geographic Atrophy Disease
Forty-eight eyes in 24 patients (13 women, 11 men) were included in this prospective study with a follow-up of 12 months. All participants presented with bilateral geographic atrophy and were followed in quarterly intervals using a standardized protocol. Mean BCVA was 58 letters (20/69 Snellen equivalent) at baseline, and declined to 56.5 letters (20/74) at 3 months, 53 (20/87) at 6 months, 52.5 (20/89) at 9 months, and 50.5 letters (20/98) at 12 months. The difference between BCVA at baseline and at the end of follow-up was statistically significant, with P ≤ .004.
Change in Lesion Area by Fundus Autofluorescence
Two readers certified by the VRC graded FAF images from patients with geographic atrophy by a consensus reading. The mean area of absent autofluorescence representing the area of atrophy among the 48 eyes included was 8.88 ± 8.91 mm 2 at baseline, 9.42 ± 9.58 mm 2 at 3 months, 9.97 ± 9.67 mm 2 at 6 months,10.27 ± 9.68 mm 2 at 9 months, and 11.22 ± 10.53 mm 2 at 12 months. The increase in lesion size based on quantitative FAF evaluation was statistically significant by the t test ( P < .0001).
Disease Progression Based on Spectral-Domain Optical Coherence Tomography Parameters
SD OCT volume stacks were graded independently by 2 readers from the VRC using the OCT Toolkit, which allows each SD OCT B-scan to be graded separately and features absolute planimetric values for each area of interest. Approximately 9000 SD OCT B-scans were analyzed in detail for each of the morphologic features described above. The findings used for lesion size determination are shown in Figure 1 . Lesion expansion between baseline and month 12 was statistically significant ( t test) for the measurements of the area demonstrating complete choroidal signal enhancement (area 1, P < .0005), outer plexiform layer (OPL) thinning (area 5, P < .001), and loss of ELM (area 7, P < .02).
The area of any choroidal signal enhancement (area 1/2) was the area of interest based on SD OCT features that agreed best with FAF, followed by the area of complete choroidal signal enhancement (area 1). The mean area of complete choroidal signal enhancement among all eyes for both graders was 7.22 ± 6.39 mm 2 at baseline, 7.56 ± 6.33 mm 2 at 3 months, 8.54 ± 7.28 mm 2 at 6 months, 8.91 ± 7.39 mm 2 at 9 months, and finally 9.33 ± 7.94 mm 2 at 12 months (data for all areas summarized in Table 2 ). Large differences were found between the areas affected by other morphologic features: Whereas the area demonstrating any choroidal signal enhancement (area 1/2) was largest, with 7.84 mm 2 at baseline expanding to 9.61 mm 2 at month 12, the growth of any RPE loss (area 3/4) was significantly smaller; with an increase from 4.00 mm 2 to 4.66 mm 2 from baseline to month 12, it reached only about 50% of area 1/2 showing enhanced choroidal transmission.
| Time | Area 1 ± SD (mm 2 ) | Area ½ ± SD (mm 2 ) | Area 3 ± SD (mm 2 ) | Area 4 ± SD (mm 2 ) | Area 5 ± SD (mm 2 ) | Area 6 ± SD (mm 2 ) | Area 7 ± SD (mm 2 ) | Area 8/9 ± SD (mm 2 ) | Area R ± SD (mm 2 ) |
|---|---|---|---|---|---|---|---|---|---|
| BSL | 7.22 ± 6.39 | 7.84 ± 7.02 | 2.45 ± 2.89 | 1.55 ± 1.64 | 5,73 ± 6,38 | 0.60 ± 1.95 | 6.13 ± 6.77 | 0.19 ± 0.30 | 8.88 ± 8.92 |
| 3 mo | 7.56 ± 6.33 | 8.11 ± 6.91 | 2.84 ± 3.05 | 1.41 ± 1.64 | 6,23 ± 6,44 | 0.47 ± 1.91 | 6.50 ± 6.78 | 0.17 ± 0.33 | 9.42 ± 9.58 |
| 6 mo | 8.54 ± 7.28 | 9.13 ± 7.85 | 3.15 ± 3.32 | 1.34 ± 1.41 | 6,62 ± 7,13 | 0.35 ± 0.84 | 6.79 ± 6.97 | 0.24 ± 0.39 | 9.97 ± 9.67 |
| 9 mo | 8.91 ± 7.39 | 9.46 ± 8.00 | 3.32 ± 3.48 | 1.52 ± 1.57 | 7,09 ± 7,14 | 0.20 ± 0.80 | 7.15 ± 7.09 | 0.23 ± 0.29 | 10.27 ± 9.68 |
| 12 mo | 9.33 ± 7,94 | 9.61 ± 8.16 | 3.32 ± 3.29 | 1.34 ± 1.40 | 6,74 ± 6,52 | 0.31 ± 0.65 | 6.91 ± 6.57 | 0.17 ± 0.25 | 11.22 ± 10.53 |
a Area R = area of absent fundus autofluorescence; Area 1 = complete choroidal signal enhancement; Area 2 = questionable choroidal signal enhancement; Area 1/2 = added areas of choroidal signal enhancement; Area 3 = complete retinal pigment epithelium (RPE) loss; Area 4 = RPE loss; Area 5 = subsidence of the outer plexiform layer; Area 6 = loss of the outer plexiform layer; Area 7 = loss of the external limiting membrane; Area 8/9 = thickening of the hyper-reflective RPE layer in comparison to normal RPE band.
Features of focal geographic atrophy disease identified at the level of the neurosensory layer, for example, thinning of the OPL and loss of the ELM (area 5 with 5.73 mm² at baseline and 6.74 mm² at month 12 and, respectively, 6.13 mm² and 6.91 mm² for area 7) were more pronounced than features of RPE loss, with absence/thinning of the RPE band with an area of 2.45 mm² at baseline and 3.32 mm² at month 12 for area 3 and, respectively, 1.55 mm² and 1.34 mm² for area 4.
Comparison of Fundus Autofluorescence and Spectral-Domain Optical Coherence Tomography
In a single-grader univariate linear regression analysis, the area measured in FAF was related to the areas of interest measured by 1 grader. The best matching of FAF to individual SD OCT areas was achieved with the area of thinning of the OPL (area 5) and the area of complete choroidal signal enhancement (area 1), with R 2 = 0.93 and R 2 = 0.92, respectively. The combined areas of any choroidal signal enhancement (area 1/2) achieved a fit with adjusted R 2 = 0.90 ( Table 3 ).
| Area 1 | Area 1/2 | Area 3 | Area 3/4 | Area 5 | Area 7 | Area 8 | Area 8/9 | ||
|---|---|---|---|---|---|---|---|---|---|
| Single-grader analysis | Area R | R 2 = 0.92 P < 2.2 × 10 −16 | R 2 = 0.90 P < 2.2 × 10 −16 | R 2 = 0.38 P < 2.2 × 10 −16 | R 2 = 0.60 P < 2.2 × 10 −16 | R 2 = 0.93 P < 2.2 × 10 −16 | R 2 = 0.89 P < 2.2 × 10 −16 | R 2 = 0.03 P = .02 | R 2 = 0.03 P = .02 |
| Multi-grader analysis | Area R | R 2 = 0.87 P < 2.2 × 10 −16 | R 2 = 0.88 P < 2.2 × 10 −16 | R 2 = 0.39 P < 2.2 × 10 −16 | R 2 = 0.56 P < 2.2 × 10 −16 | R 2 = 0.90 P < 2.2 × 10 −16 | R 2 = 0.87 P < 2.2 × 10 −16 | R 2 = 0.03 P = .001 | R 2 = 0.03 P = .001 |
a Area R = area of absent fundus autofluorescence; Area 1 = complete choroidal signal enhancement; Area 2 = questionable choroidal signal enhancement; Area 1/2 = added areas of choroidal signal enhancement; Area 3 = complete retinal pigment epithelium (RPE) loss; Area 3/4 = any RPE loss; Area 5 = subsidence of the outer plexiform layer; Area 7 = loss of the external limiting membrane; Area 8 = definitive thickening of the hyper-reflective RPE layer in comparison to normal RPE band; Area 8/9 = added areas of definitive and questionable thickening of the hyper-reflective RPE layer.
Stay updated, free articles. Join our Telegram channel

Full access? Get Clinical Tree


