FUNDUS PHOTOGRAPHY
Standard fundus photography at the ophthalmologist’s office now includes a basic digital funduscopic camera or a wide-field nonmydriatic camera. In fact, many optometric offices have nonmydriatic cameras. Operating nonmydriatic cameras requires no training, and hence no need for skilled ophthalmic photographers. The ophthalmologist has instant documentation to show to the patient. The nonmydriatic camera requires a pupil size of at least 3.7 mm in order to obtain a good quality retinal image.
The regular, digital fundus camera is a specialized low-power microscope with an attached camera designed to photograph the interior of the eye, the retina, optic disc, and macula. The optical design of the camera is based on the principle of the monocular indirect ophthalmoscope. The fundus camera provides an upright magnified view of the fundus. A typical camera has views of 30, 35, or 50 degrees of the retinal area. The camera’s 2.5× magnification allows some variation of the magnification through auxiliary lenses from 15 degrees, which provides 5× magnification, to 140 degrees with a wide angle lens, which minifies the image by half.
The observation and illumination systems follow dissimilar paths. The observation light is focused via a series of lenses through a donut-shaped aperture. It then passes through a central aperture to form an annulus before passing through the camera objective lens and through the cornea onto the retina.
The light reflected from the retina is passed through the unilluminated hole in the donut, all formed by the camera’s internal illumination system. Because the light paths of the two systems are independent, reflections of the light source captured in the formed image are minimal.
The image forming rays continue toward the low-powered telescopic eyepiece. When the button is pressed to take a picture, a mirror interrupts the path of the illumination system slowing the light from the flash bulb to pass into the eye. Simultaneously, a mirror falls in front of the observation telescope and redirects the light onto the capturing medium, typically a film or digital charge-coupled device. Because of the eye’s tendency to accommodate while looking through a telescope, it is imperative that the exiting vergence is parallel in order for a focused image to be formed on the capturing medium.
Because of this accommodation, nonmydriatic cameras are not as successful as the regular fundus cameras in recording the details of the retina. However, if the patient’s eye is dilated, the nonmydriatic camera can be effective.
In color fundus photography, the retina is illuminated by white light and examined in full color. Color fundus photography is the standard photograph in ophthalmology (Fig. 4-1).
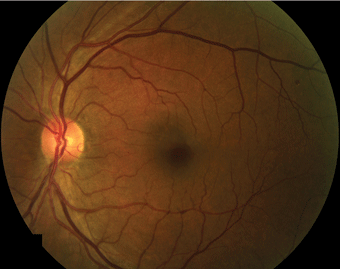
FIGURE 4-1. Color fundus photograph of microaneurysms.
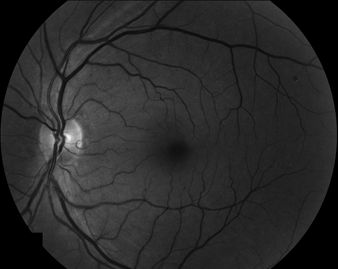
In red-free photography, the imaging light is filtered to remove red colors, improving contrast of vessels and other structures. Red-free photographs show small hemorrhages, microaneurysms, and hard exudates with more clarity than color fundus photos (Fig. 4-2).
FLUORESCEIN ANGIOGRAPHY AND INDOCYANINE GREEN ANGIOGRAPHY
In fluorescein angiography, the vessels are brought into high contrast by the intravenous injection of a fluorescent dye. The retina is illuminated with an excitation color which fluoresces the light of another color where the dye is present. By using a filter to exclude the excitation color and passing the fluorescent color, a very high contrast image of the vessels is produced. A timed sequence of photos showing the progression of the dye into the vessels reveals the flow dynamic and the different layers of the retina. Thus, different areas of the retinal architecture are delineated (Fig. 4-3).
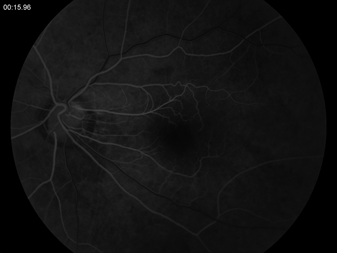
FIGURE 4-3. Fluorescein angiogram sequence, beginning with AV phase and progressing to midtransit.
Indocyanine green dye angiography (ICG) is another method to capture the flow of the dye in the deeper tissue, the choroid. In approximately 15% of patients with nonproliferative diabetic retinopathy, ICG can reveal additional microvascular complications in diabetes not seen with conventional fluorescein angiography1 (Fig. 4-4).
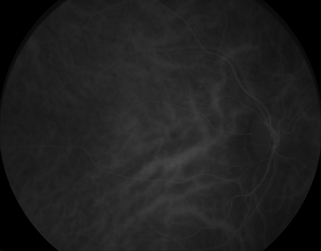
FIGURE 4-4. Indocyanine green dye photograph.
Seven Standard Diabetic Photographic Fields
This is a technique of taking a series of photos, using the stereoscopic setting on the digital fundus camera. All of these fields utilize a 35-degree field of view. Field 1 is centered on the optic nerve. Field 2 is centered on the macula; Field 3 temporal to the macula; Field 4 superotemporally, excluding the optic disc; Field 5 inferotemporally, excluding the optic disc; Field 6 superonasally along the arcades, excluding the optic disc; and Field 7 inferonasally, excluding the optic disc (Fig. 4-5).
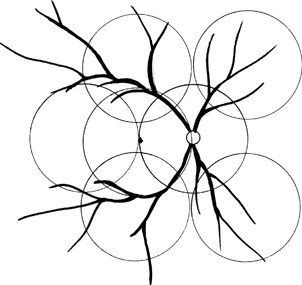
FIGURE 4-5. Diagram of seven standard photographic fields.
There is the ultrawide field fundus camera (Optomap), which uses red and green laser lights to scan the retina. A spinning polygon at 30,000 rpm produces a scanning laser ophthalmoscope.2 There is a 200-degree field of view of the retina. The red and green light wavelengths scatter less than that of white light. Therefore, they can penetrate cataracts, corneal opacities, and vitreous hemorrhage better than white light. Optomap photographs the retina up to the ora serrata. This type of camera is available and has provided clinicians with the capability of documenting widespread diabetic ischemia previously not recordable (Figs. 4-6 and 4-7). The Optomap is useful in the documentation of intraocular tumors.
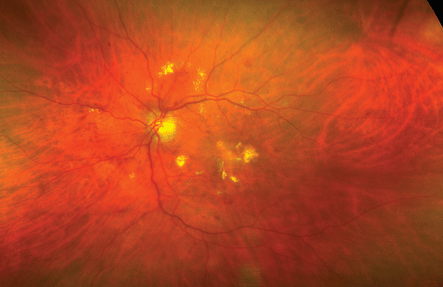
FIGURE 4-6. Optomap scan of diabetic retinopathy.
(Courtesy of optos PLC, Queensferry House, Carnegie Business Campus, Dunfermline, Fife, Scotland KYII 8GR, UK.)
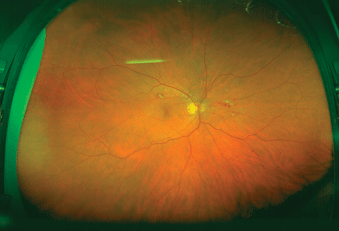
FIGURE 4-7. Optomap scan of the retina.
Optical Coherence Tomography
Optical Coherence Tomography (OCT) is based on white light interferometry for in vivo ocular eye measurements and imaging of biological tissues, especially the human eye.3
The optical set up is white light or low-coherence interferometry. The light source is of low coherence and broad bandwidth. This type of light is created by superluminescent diode (SLD) laser such as the femtosecond laser. The light is split into and recombined from reference and sample arm respectively.4,5
This ophthalmic imaging technique is similar to ultrasound. But instead of measuring sound echoes, low-coherence interferometry measures the echo time delay of light. The Stratus OCT (Carl Zeiss, Meditech, Dublin, CA) is based on time domain detection technology where all time delays are measured sequentially. Thus, 400 axial scans are acquired in 1 second. Stratus OCT uses a SLD light source with a wavelength of 820 nm and a bandwidth of 25 nm to achieve a resolution of 10 to 12 μm. The slow acquisition speed leads to sparse scan patterns. Motion artifacts are common but are resolved with digital smoothing.
Light in an OCT system is divided into two arms: a sample arm aimed at the item of interest and a reference arm, a mirror. The combination of reflected light from the sample arm and reference light from the reference arm gives rise to an interference pattern. Only the reflected nonscattered light is coherent, that is, this coherent light retains the optical phase that causes light rays to propagate in one or another direction.
In the OCT instrument, an optical interferometer is used to detect only coherent light. The interferometer strips off scattered light from the reflected light needed to generate an image. In the process, depth and intensity of light reflected from the subsurface feature is obtained. A three-dimensional image can be built up by scanning, as in sonar or a radar system.
This technique is limited to imaging 1 to 2 mm below the surface of the biological tissue because at greater depths, the proportion of light that escapes without scattering is too small to be detected (Fig. 4-8).
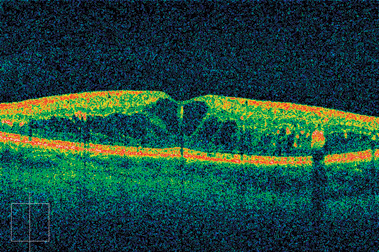
FIGURE 4-8. OCT scan of macular edema.
Spectral Domain or Fourier Domain OCT
The broadband interference is acquired with spectrally separated detectors. The depth scan can be immediately calculated by a Fourier transform from the acquired spectra, called spectroscopic signal analysis, thus the name Spectral Domain OCT or Frequency Domain OCT. The signal analysis is done without the movement of the reference arm. The depth analysis is done by inverse Fourier transformation of a backscattered light spectrum to produce axial scans. This feature improves imaging speed dramatically, which reduces losses during a single scan to improve the signal-to-noise ratio of the detection elements.
Thus, the acquisition time is improved by 20 to 100 times of the conventional OCT. The faster acquisition time leads to the reduction of motion artifact, preserves true retinal topography, and allows “3D data sets.”6–9
OCT, first popular in the mid-1990s, has now become the standard of care for retina-vitreous specialists. It is useful in describing diabetic macular edema versus macular gliosis or macular hole formation (Fig. 4-7).
The optical coherence scans number 20,000 to 40,000 A-scans per second providing information of the retina architecture. Specifically, the clinician can view the vitreous interface with the internal limiting membrane for macular gliosis, macular hole, and macular pseudohole formation. The inner layers of the retina can be seen in pathological states in diabetic retinopathy, for example, macular cysts in diabetic macular edema. The size of the cysts can be measured and seen using this technique. The retinal pigment epithelium can be seen if the area is separated from the retina in a retinal pigment epithelial detachment or bleeding under the retinal pigment epithelium in disease entities such as age-related macular degeneration. The current iteration of the software has now allowed 25,000 to 27,000 A-scans per second. The resulting axial resolution is approximately 5 μm.10–14
Heidelberg Retinal Angiography and OCT
Heidelberg retinal angiography (HRA) with OCT has an acquisition speed of 40,000 A-scans per second. It has a digital axial resolution of 3.8 μm. It uses a scanning laser ophthalmoscope, along with an eye tracking device, to scan the retina and its blood vessels while obtaining an OCT, in real time. This method allows for precise tracking of the retinal lesion from examination to examination. Images are acquired point-by-point and reconstructed with a computer, allowing three-dimensional reconstructions of topologically complex objects.
The confocal laser scanning microscope, part of the Spectralis system, contains a laser beam which passes through a light source aperture, and then the laser beam is focused by an objective lens into a small, diffraction-limited, focal volume within a fluorescent specimen. A mixture of emitted fluorescent light as well as reflected laser light from the illuminated spot is recollected by the objective lens. A beam splitter separates the light mixture by allowing only the laser light to pass through and reflecting the fluorescent light in the detection apparatus. After passing the pinhole, the fluorescent light is detected by a photodetection device, photomultiplier tube or avalanche photodiode. Thus, the light signal is transformed into an electrical signal that is recorded by the computer.
The detected light originating from an illuminated volume element within the specimen represents one pixel in the resulting image. As the laser scans over the plane of the specimen, a whole image is obtained pixel-by-pixel and line-by-line.
The computer can generate a three-dimensional picture of a specimen by assembling a stack of these two dimensional images from successive focal planes15 (Figs. 4-9 and 4-10).
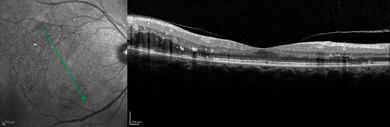
FIGURE 4-9. Spectralis scan of diabetic retinopathy.
(Courtesy of Heidelberg Engineering, 1499 Poinsettia Ave., Suite 160, Vista, CA 92081.)
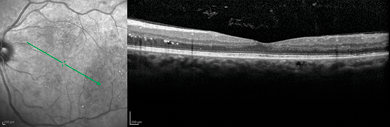
FIGURE 4-10. Spectralis scan of diabetic retinopathy.
(Courtesy of Heidelberg Engineering, 1499 Poinsettia Ave., Suite 160, Vista, CA 92081.)
Fundus Autofluoresence
The camera has a filter that shines light onto the retina, and the response shows the activity of the rod/cone interface with the retinal pigment epithelium. Fundus autofluorescence (FAF) uses a fundus spectrophotometer5 and an excitation light of a short wavelength. FAF is derived mainly from retinal pigment epithelium’s lipofuscin granules with a broad emission spectrum from 500 to 750 nm and a peak at about 630 nm.16–20 The Heidelberg Spectralis system uses three models for FAF imaging: Spectralis HRA, Spectralis FA + OCT, and Spectralis HRA + OCT.
The Spectralis HRA uses a confocal Scanning Laser Ophthalmoscope (cSLO) to show the spatial distribution of FAF over large retinal areas to be documented.7–9 The use of a confocal system and a monochromatic light allows high spatial resolution imaging of a sharp image in a selected plane and avoids lens fluorescence. To study FAF, cSLO usually utilizes an argon blue laser of 488 nm, the same wavelength as that used for fluorescein angiography, and a barrier filter with a short wavelength cut off at 495 nm to separate the excitation from the emitted fluorescent light. To amplify the autofluorescence signal, single images are usually averaged after eye movement correction. In cases of nystagmus or poor fixation, this may be difficult. To date, this method has been used for age-related macular degeneration and geographic atrophy, inherited retinal dystrophies with its abnormal retinal pigment epithelium. However, this method may prove useful in other diseases such as diabetes where the retinal pigment epithelium is abnormal in patients with diabetic retinopathy.21
Clinical Applications of Fluorescein Angiography
Fluorescein angiography is important for the evaluation of blood flow indirectly and directly evaluating the anatomy of the different layers of the retina. The initial flow of the fluorescein dye goes into the venous system, into the capillaries, and then into the arterial system. This is still the most easily accessible method for clinicians to evaluate flow and the possible delay of flow in vasculopathic diseases such as diabetes (Fig. 4-3).
For example, if the first appearance of fluorescein dye occurs at 15 seconds in the arteriovenous phase after a standard 5-second injection time in one patient with background diabetic retinopathy and macular edema, this same injection sequence in another diabetic patient with severe proliferative diabetic retinopathy and macular edema may result in the fluorescein dye showing up in the arteriovenous phase at 20 seconds. This difference in flow may be an indicator of delay in flow in these two diabetic patients.
In the midtransit of the fluorescein angiogram, the ophthalmologist may identify areas of capillary nonperfusion or neovascularization (Fig. 4-9), which would lead to different treatment options than if no fluorescein angiography had been performed. Or, if in the late transit, there is profound macular edema as demonstrated by massive hyperfluorescence at the macula region. This picture may then convince the retinal specialist of the need for closer follow-up examinations. For example, a newly diagnosed Type 2 diabetic patient may need to be seen more frequently than every 6 months.
Sodium fluorescein is a well-tolerated dye in the majority of patients. If patients are concerned about fluorescein allergy, we suggest that they take the vial and see an allergist for testing.
In diabetic patients with macular edema and nonproliferative diabetic retinopathy, fluorescein angiography can be used to evaluate areas of capillary nonperfusion. Capillary nonperfusion would lead to the use of earlier scatter photocoagulation. Fluorescein angiography would identify areas of neovascularization of the retina elsewhere, a feared complication of diabetic retinopathy. Any areas of retinal neovascularization would lead to possible earlier treatment of scatter photocoagulation or closer monitoring of the patient to prepare for eventual need for panretinal photocoagulation (PRP), as we expect acceleration of diabetic retinopathy.
Fluorescein angiography is useful to monitor residual macular edema after previous laser. Comparison photographs and angiographic frames from previous examinations can be used to evaluate the resolution or progression of residual macular edema.
Clinical Applications of Indocyanine Green Angiography
ICG Angiography looks at the choroidal circulation. This type of angiography may be used to follow in patients with diabetes with an abnormal presentation of diabetic retinopathy or those patients who have choroidal lesions, unrelated to the underlying systemic disease of diabetes. For example, diabetic patients with choroidal tumors would have this procedure performed. This test utilizes an iodine-based dye, and thus, patients with iodine allergy would not be candidates for this test. More allergic reactions occur with ICG dye than with sodium fluorescein dye.
Patients who are candidates for the ICG dye test in a diabetic population would include new patients with loss of central vision, who are diabetic but whose fundus photo does not show typical diabetic microaneurysmal dilatation. If you suspect another form of retinal disease involving anastomoses with the choroidal circulation to the retinal circulation, the ICG angiography is useful.
Other Testing
Visual Field
Visual field tests can quantify the extent of visual loss in diabetic patients with diabetic retinopathy. Visual fields can also monitor the progression of diabetic retinopathy in follow-up examinations. The visual field evaluates the diabetic patients for comorbid risk factors such as glaucoma. In addition, visual field testing can evaluate those diabetic patients with unexplained visual loss. One should consider open-angle glaucoma in the differential diagnosis, since glaucoma has been one of the associated health risks with diabetes. It has been well known that diabetic retinopathy decreases blood flow to the retina, and as a corollary, it is not unexpected to see low-tension glaucoma in diabetic patients.
Visual fields can be offered in the following modes:
a. Confrontational Visual Field: At the bedside, the examiner’s peripheral hand movements are brought from the far periphery to the near periphery in four quadrants, using counting fingers.
b. Amsler Grid: This small test evaluates macular vision in diabetic patients. This is useful as a screening test for diabetics who are newly diagnosed or for those diabetics who present to the internal medicine practice complaining of loss of near vision. In an ophthalmologist’s office, the use of the Amsler Grid can be done with the testing of the visual acuity, as a way to determine more clearly the patient’s chief complaint.
c. Static Perimetry (Humphrey Zeiss field analyzer—“24-2” or Octopus): These automated visual field machines use a fixed light source which is either a stationary, pinpoint light source or projected dots within a large Ganzfeld bowl.
d. Kinetic Perimetry (also known as the traditional Goldmann Perimeter): This test produces an island map of peripheral visual perception. Fixation monitoring as well as movement of light source is necessary to perform this test.
e. Frequency Doubling Perimetry (Humphrey Zeiss field analyzer—“30-2”): This test uses varying intensities of a shimmering grid of light in standardized sectors of the peripheral and central visual field. It is particularly useful in detecting early glaucoma field loss and can be 40% more sensitive than that of standard static or kinetic perimetry.
For diabetic patients, there may be visual field changes related to the loss of peripheral vision from their diabetic retinopathy, even if untreated. After laser photocoagulation such as PRP, there may be some additional visual field loss. It is important to document a baseline visual field in these diabetic patients before and after PRP as they are at risk for glaucoma in the future.
In diabetic macular edema patients, it is important to document their preexisting visual field loss before their initial macular laser.
In diabetic patients who later develop glaucoma, visual field changes may be gradual or abrupt. Thus, the clinician should monitor for optic disc changes for increased cup-to-disc ratios and follow gonioscopy for rubeosis in the diabetic patient. The patient’s optic nerve changes can be sequentially examined with the Heidelberg Retinal Tomography or the OCT.
In diabetic patients who have had loss of vision not correlated with retinal findings, a visual field test may identify glaucoma. Normal-tension glaucoma can occur in diabetic patients. Diabetic patients who have not had laser may complain of loss of contrast sensitivity at night or difficulty ambulating in dark movie theaters or parking lots. These patients may have normal vision (20/20 to 20/40) but complain of loss of vision out of proportion with their retinal exam.
Electrodiagnostic Testing
The Electroretinogram
The oscillatory potential is the classical method of evaluating diabetic retinopathy, but newer methods of evaluating retinal function exist with the use of 30-Hz Flicker, implicit times and amplitudes.22–24 Bresnick et al.25–27 described oscillatory potentials in diabetic retinopathy. Oscillatory potentials are extracted from the ERG B wave by a computer-automated mechanism which increases the low-frequency band-pass filter to 60 Hz and leaves the high-frequency band-pass filter at the usual setting of about 300 Hz.
Much of visual function testing in diabetics has been used for prognosis in severe diabetics or for those diabetics with profound and severe visual loss in assessing their low vision status. Oscillatory potentials and its amplitude have been affected in patients with no diabetic retinopathy to background diabetic retinopathy.25–27
Thirty-Hertz flicker is useful in testing the loss of retinal function especially its implicit times. This is becoming more popular among clinicians because the ERG can provide prognostication of future visual function after laser or surgery.23,26,28
Modern electrodiagnostic testing now involves the use of the DTL electrode which is a noncontact electrode. No longer is the Burian-Allen or jet contact lens electrode the contact electrode of choice for a busy clinical practice. The DTL electrode uses a silver-coated filament, approximately 10-0 nylon suture to be placed in the cul-de-sac in the tear film of the tarsal conjunctiva.29 There is still a ground electrode and a forehead electrode as previously described.30
The testing protocol is the standard ISCEV, International Society of Clinical Electrophysiology and Vision.31 Dark adaptation of 20 minutes is performed in a blackened room, without any light entry. This can be accomplished by bilaterally patching a patient in a darkened room. The scotoptic or dark-adapted ERG starts with a small, dim white light, a brighter white light flash, then a lit Ganzfeld bowl with a white flash, and then the 30-Hz Flicker to test the cone response. The oscillatory potentials are removed from the photopic part of the ERG by the computer which extracts the oscillatory potentials and analyzes them using the software programs in all of the commercially available ERG systems.
Patients who present for the first time with severe diabetic retinopathy are candidates for ERG testing. The ERG will quantify the degree of ischemia for the clinician. While photographic methods evaluate the retinal anatomy, the ERG evaluates the function. In nonproliferative or proliferative retinopathy: look for a baseline and repeat after onset of medical treatment to stabilize diabetes or as a method of following patients who are being treated with bevacizumab (Avastin) and who are not responding to treatment. The degree of ischemia seen in the B waves or oscillatory potentials or delayed implicit times of the 30-Hz Flicker may be useful information. This consistent delay of implicit times despite treatment may suggest earlier laser intervention is needed or that bevacizumab (Avastin) may be needed for adjunctive therapy (Fig. 4-11).
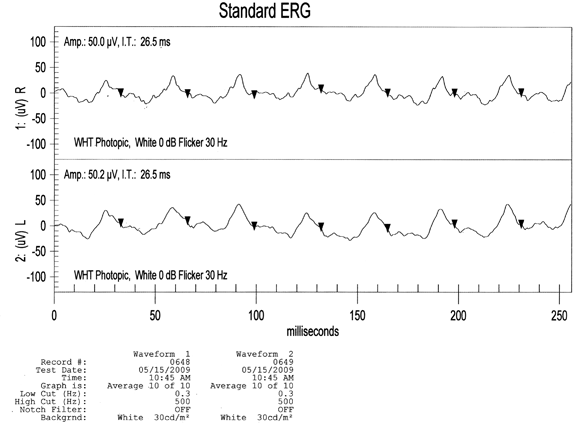
FIGURE 4-11. ERG: 73-year-old female with newly diagnosed diabetes. OD (Top), OS (Bottom). ERG normal (70–79 years old): amplitude = 103.06 ± 9.50, implicit time = 26.69 ± 0.93. The patient’s amplitude is decreased when compared to normal, age-matched standards.(Courtesy of LKC Technologies,Gaithersburg, Maryland. www.KLC.com, Database: C:\EMRIN\EMDATA.mdb.)
Stay updated, free articles. Join our Telegram channel

Full access? Get Clinical Tree


