22 Optical Coherence Tomography and Anti-Vascular Endothelial Growth Factor Therapy
Vascular endothelial growth factor-A (VEGF) is the major cytokine responsible for physiologic and pathological angiogenesis. Retinal diseases characterized by pathologic neovascularization and exudation, such as neovascular age-related macular degeneration (AMD), diabetic retinopathy, and retinal vein occlusion (RVO) are associated with increased levels of VEGF. Their prognoses have significantly improved since the introduction of the anti-VEGF therapy. The initiation of treatment with anti-VEGF coincided with the development of a commercially viable optical coherence tomography (OCT) instrument. OCT imaging has improved the early diagnosis and appropriate management of these diseases by showing where the abnormal exudation resides. OCT imaging has greatly improved our understanding of how neovascularization and exudation in the macula interferes with visual acuity, and how anti-VEGF therapy improves outcomes. OCT imaging shows the response to therapy and helps guide the need for retreatment. OCT guidance is vital to our ability to identify when treatment should start and when treatment intervals can be extended. This chapter describes the use of anti-VEGF therapies in cases of neovascular AMD, diabetic retinopathy, and RVO. In addition, this chapter includes a broad overview of the clinical trials that have used OCT-guided therapy for exudative macular diseases and discusses future plans for this imaging strategy.
Significant vision loss is caused by pathological neovascularization and exudation in neovascular AMD, diabetic retinopathy, and RVO. 1 Diabetic retinopathy represents the main cause of legal blindness in 20- to 74-year olds in developed countries, 2 and macular edema is a frequent manifestation and an important cause of visual impairment in this disease. 3 , 4 AMD is the leading cause of abnormal neovascularization and exudation in the population over 50 years of age. If untreated, neovascular AMD leads to severe, irreversible vision loss. 5 , 6 , 7
Over the years, imaging technologies have improved our ability to detect neovascular and exudative diseases, and these newer technologies have been incorporated into our evolving management strategies. Although fluorescein angiography was the gold standard for identifying neovascularization and exudation and remains an important imaging strategy in AMD, diabetic retinopathy, and vein occlusions, the new gold standard is OCT. OCT has emerged as the leading imaging modality for both diagnosis and the assessment of treatment. It provides a noninvasive, noncontact strategy for obtaining a three-dimensional anatomic image of the posterior pole, which includes the retina, retinal pigment epithelium (RPE), and choroid. 8 , 9 In the setting of macular edema and neovascularization, OCT now provides the essential information that is relevant in deciding when and how often to treat.
Since the introduction of therapy that inhibits VEGF-A (anti-VEGF therapy), the prognosis for these neovascular and exudative diseases has improved, especially when considering the diagnosis of neovascular AMD. 10 , 11 VEGF-A is the major cytokine responsible for the increased vascular permeability and growth of abnormal vessels. 12 The anatomical improvements seen with OCT after anti-VEGF therapy correlate well with visual acuity, and these improvements seen on OCT imaging are now expected whenever the results from clinical trials using anti-VEGF therapy are discussed. OCT is even useful in explaining why visual acuity does not improve as much as expected once the exudation has resolved. The anatomical integrity of the outer retina and RPE are often compromised whenever vision improvement fails to follow resolution of macular fluid. Thus, OCT imaging provides evidence of exudation and when treatment is needed, and it provides anatomical correlation for both vision improvement and loss. For any new drug undergoing clinical trials for the treatment of macular exudation, the need to show resolution of macular fluid by OCT imaging has become a requirement.
The current strategies for treating exudative macular diseases rely heavily on OCT. The only treatment strategy that does not require frequent OCT imaging is to treat monthly or every 2 months regardless of anatomical response. Although this strategy has been used successfully in clinical trials, most retina specialists have adopted a more personalized approach to therapy. The two most frequent OCT-based treatment strategies are referred to as-needed (pro re nata [PRN]) therapy and treat-and-extend therapy. OCT is integral to both strategies, but the number and frequency of visits as well as injections vary between the two approaches.
22.1 Anti-VEGF Therapies
22.1.1 Pegaptanib Sodium
In December 2004, pegaptanib sodium (Macugen, Eyetech Pharmaceuticals, San Francisco, CA) was the first VEGF-A inhibitor approved in the United States by the Food and Drug Administration (FDA) for the treatment of neovascular AMD. This RNA aptamer inhibited human VEGF165, as well as longer isoforms of VEGF-A. 13 This intravitreal drug was shown to slow vision loss in neovascular AMD clinical studies 14 , 15 , 16 , 17 and was the first anti-VEGF reported in a clinical trial to have efficacy in the treatment of diabetic macular edema (DME). 18 In clinical use, this drug never demonstrated significant OCT or visual acuity benefits and was replaced by bevacizumab in May 2005.
22.1.2 Bevacizumab
The off-label use of bevacizumab (Avastin; Genentech Inc., South San Francisco, CA) for the treatment of exudative macular diseases was initiated after it was approved by the FDA in 2004 as an intravenous treatment for metastatic colorectal cancer. 19 , 20 , 21 , 22 This humanized immunoglobulin (Ig)G1 monoclonal antibody selectively neutralizes the biologic activity of VEGF-A. 12 First used successfully as an intravenous treatment of neovascular AMD, a much smaller dose of bevacizumab was subsequently injected into the vitreous and shown to improve visual acuity and reduce exudation by OCT imaging without any apparent systemic side effects. 23 , 24 , 25 Subsequent studies confirmed its visual acuity and anatomical benefits for neovascular AMD 26 , 27 , 28 , 29 , 30 , 31 , 32 , 33 , 34 , 35 , 36 , 37 , 38 , 39 , 40 and other causes of macular edema. 25 , 41 , 42 , 43
22.1.3 Ranibizumab
Ranibizumab (Lucentis; Genentech, Inc, South San Francisco, CA) is derived from the same murine monoclonal antibody against VEGF-A as bevacizumab. Whereas bevacizumab is the humanized full-length antibody, ranibizumab is a recombinant, humanized monoclonal antibody fragment that binds and inhibits all active forms identified of VEGF-A, just like bevacizumab. 44 , 45 Approved by the FDA in 2006 for the treatment of neovascular AMD, ranibizumab first showed benefits with monthly injections, demonstrating not only prevention of vision loss but also improvement of visual acuity. 10 , 46 , 47 , 48 , 49 Alternative dosing regimens were evaluated in subsequent studies, 50 , 51 , 52 , 53 , 54 , 55 , 56 , 57 , 58 , 59 , 60 , 61 , 62 and the Prospective OCT Imaging of Patients with Neovascular AMD Treated with IntraOcular Ranibizumab (PrONTO) study 63 (see Clinical Trials) was the first trial to use OCT imaging to monitor a PRN dosing strategy.
The FDA approved ranibizumab for the treatment of patients with macular edema owing to RVO in 2010 and, later, in 2012, the drug was approved for the treatment of DME based on two clinical trials, RISE and RIDE. 64
22.1.4 Aflibercept
Aflibercept (Eylea; Regeneron, Tarrytown, NY) is a soluble receptor fusion-protein against all isoforms of VEGF-A, as well as VEGF-B and placental growth factor. It was approved in November 2011 for the treatment of neovascular AMD. 65 , 66 , 67 As with the other pan-VEGF inhibitors, macular exudation resolved as shown using OCT imaging and average visual acuity improved. 68 , 69 More recently, in September 2012, aflibercept was approved for macular edema owing to central retinal vein occlusion (CRVO) based on two randomized, multicenter, clinical trials, Investigation of Efficacy and Safety in Central Retinal Vein Occlusion (COPERNICUS) 70 and VEGF Trap-Eye for macular oedema secondary to central retinal vein occlusion (GALILEO). 71
22.2 Role of OCT in Anti-VEGF Therapy
With OCT B-scan imaging, in vivo, high-resolution optical cross-sections of the retina can be made in which the major cellular layers can be identified. 9 , 72 Since the release of the first OCT instruments, we now have a much better understanding of the structural alterations associated with the diagnosis, natural history, and treatment of macular exudative diseases such as neovascular AMD, DME, and RVO. The time-domain (TD) OCT instrument known as the Stratus OCT (Carl Zeiss Meditec, Dublin, CA) was the first successfully commercialized OCT instrument launched in 2002, 73 , 74 and the first instrument used to demonstrate the utility of OCT monitoring to detect a treatment response to anti-VEGF drugs. 75 , 76 , 77 Compared with this TD OCT, the current commercially available spectral domain (SD) OCT instruments provide a significant improvement in speed, sensitivity, axial resolution, and imaging depth. 78 , 79
Optical coherence tomography is used to identify the integrity of the retinal layers, the RPE, and the choroid. This evaluation provides qualitative and quantitative information that is important to guide therapy, including the decision to initiate, continue, and withhold treatment with intravitreal anti-VEGF drugs. In exudative diseases such as neovascular AMD, the examination is used to identify and localize the macular fluid or blood in the macula. This fluid can be found in the retina, under the retina, or under the RPE. 80 The presence, persistent, or recurrence of fluid determines when treatment with anti-VEGF dugs is needed. In addition, OCT imaging identifies other potential anatomical causes of vision loss, such as atrophy of photoreceptors in the outer retina, vitreomacular traction, epiretinal membranes, or macular holes.
22.3 Qualitative Analysis
Optical coherence tomography depends on illuminating the tissue with a defined light source and capturing the light that is reflected back to the detector. The scattering and time delay of the reflected light from each tissue layer and interface provide the information that is used to reconstruct an anatomical image using different colors or shades of gray for different layers according to its reflectivity. 9 With advances in OCT technology, retinal structures and the changes in the appearance of the macular anatomy have become easier to identify, and more sophisticated algorithms have been developed to measure the changes identified in the anatomical layers. 74
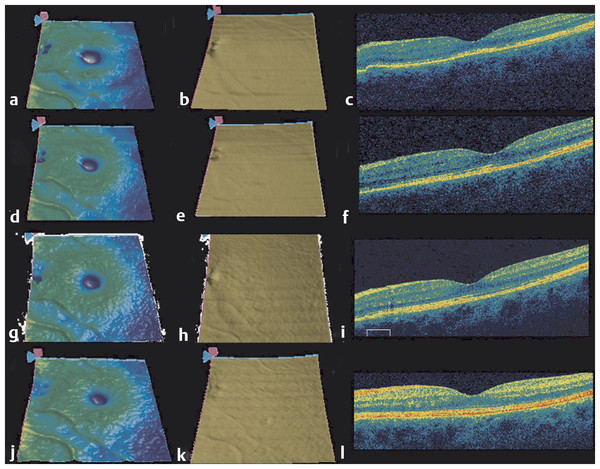
Optical coherence tomography is most frequently used to identify fluid in the macula, which arises from vitreomacular interface abnormalities, exudative diseases, and retinal detachment. In addition to fluid, visual acuity is associated with the integrity of the retinal layers, with abnormalities in the photoreceptor layer and the continuity of the inner segment-outer segment (IS/OS) junction often associated with decreased vision. OCT can also identify the presence of both vascularized and nonvascularized PEDs. It is the vascularized pigment epithelial detachment (PED) that is often associated with the risk of rapid, severe vision loss. 81 In these cases, OCT can provide detailed anatomical and morphologic assessment of the PED area and volume that proves when following these lesions during anti-VEGF therapy (Fig. 22.1). 82

22.4 Quantitative Analysis
Central retinal thickness (CRT) is the parameter used to quantitate retinal morphology and is a distance calculated in microns from the internal limiting membrane (ILM) to the RPE. Small thickness changes and elevations of individual retinal layers have been correlated with clinical findings. Increased CRT measurements are often correlated with the accumulation of macular fluid, and studies in a variety of macular diseases have shown that OCT is useful in quantifying retinal thickness in eyes with macular edema. 83 , 84 , 85 , 86 By following the CRT, the retina specialist can evaluate the effects of treatment.
Because of its three-dimensional characteristics, the volume of PEDs can be measured using SD-OCT. The development of an algorithm using SD-OCT, which was first used to measure drusen volume, 87 was shown to be highly reproducible strategy for monitoring disease progression and response to anti-VEGF therapy. 88 In contrast, volumetric assessment is not possible with more traditional imaging strategies used to monitor PEDs, such as color fundus photography, fluorescein angiography, and indocyanine green angiography.
Limitations of OCT scans may include a low signal strength that can compromise the correct interpretation of the images. Signal strength corresponds to the averaged intensity value of the signal pixels in the OCT image and is represented in a scale of 0 to 10. The higher the signal strength, the more reliable the interpretation of the scans. 89 , 90 Errors in automated segmentation algorithms and thickness measurements are well known and are not rare when assessing macular anatomy with complex morphologies such as neovascular AMD and macular edema. Theses anatomical changes can interfere with the ability of segmentation algorithms to detect normal anatomic boundaries. 91 , 92 , 93 , 94 , 95 However, manual editing can be performed and the scan corrected when an inaccurate segmentation is identified.
A more recent advance in OCT technology is the ability to use ultrahigh-speed swept-source OCT to evaluate the retinal, choriocapillaris, and choroidal microvasculature without the need for intravenous injection of contrast agents. OCT angiography has been shown to reproducibly image the three-dimensional vascular structures of the retina and choroid, and the resulting images are consistent with histologic and electron micrographic images. 96
22.5 Initiation and Maintenance of Anti-VEGF Therapy
With OCT imaging, the fluid associated with macular neovascularization can be identified. The fluid can accumulate in the retina, under the retina, and under the RPE. 97 As more fluid accumulates and the longer the fluid persists, there is a greater chance of irreversible damage to the retina. A delay in treatment of newly diagnosed patients is associated with an increasing risk of vision loss. 98 OCT is now the gold standard for the early diagnosis of macular fluid in exudative retinal diseases. OCT was shown to be very sensitive in detecting changes in retinal morphology over time and is a valuable tool for following up on patients with AMD (Fig. 22.2 , Fig. 22.3). 99 The visit-to-visit changes in the appearance of the OCT images play an increasingly important clinical role in deciding when to treat and when to monitor patients with exudative eye diseases, and this retreatment and follow-up schedule has a profound impact on the visual acuity outcomes of patients with neovascular AMD. 100 , 101 Studies have focused on retreatment decisions based on OCT imaging, and OCT imaging has been confirmed as an appropriate strategy for managing patients with anti-VEGF therapy. 102 , 103 However, for the OCT-guided retreatment strategy to be successful, it is imperative that the clinician carefully review the entire OCT scan to determine whether fluid is present. In clinical practice, the retina specialist needs to consider the risks, benefits, and cost of the treatment, and the OCT appearance of the retina is crucial to minimizing the need for retreatment and the cost associated with therapy.

Stay updated, free articles. Join our Telegram channel

Full access? Get Clinical Tree


