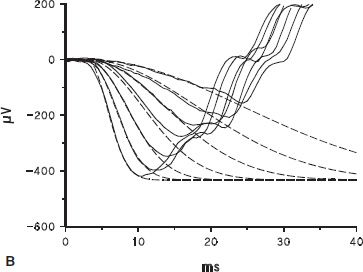
FIGURE 10.1 Full-field ERG. A: ERG response to a brief (<3 ms), blue (470 nm) flash recorded from a normal dark-adapted adult subject. B: Solid lines show the first 40 ms of the a-wave response to the seven brightest flashes in a series; dashed lines represent the equation R(I, t) = R ROD[1 − exp(−0.5 I SROD(t − td)2)], which is the Hood and Birch modification of the Lamb and Pugh model of the biochemical processes involved in the activation of rod phototransduction fit to the a-waves (1,2). In the equation, I is flash intensity, t time (ms), and td a brief delay. SROD is a sensitivity parameter related to the amplification constant in the molecular model of the activation of phototransduction, which summarizes the kinetics of a series of processes that begins with photoisomerization of rhodopsin and ends with closure of the channels in the photoreceptor. RROD is the saturated amplitude of the photoreceptor response and represents the number of channels that are available for closure by light. C: b-wave amplitude plotted as a function of stimulus strength. The smooth curve represents the equation V = VMAX [I/(I + σ)] fit to the b-wave data; responses to higher intensities (open symbols) were not included in the curve fit. Log σ is the intensity of the stimulus that produces a half maximum (saturated) b-wave amplitude. VMAX is the saturated amplitude of the b-wave stimulus-response function.
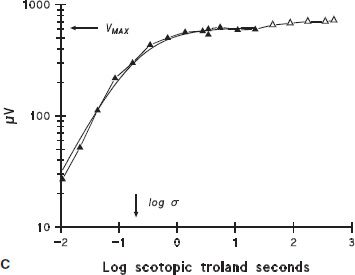
Sample ERG records obtained in scotopic (Fig. 10.2) and photopic (Fig. 10.3) conditions from a 10-week-old infant and an adult recorded using Burian-Allen bipolar corneal contact electrodes are shown. In scotopic conditions (Fig. 10.2), the adult responds to dimmer stimuli than does the infant. The amplitude of the adult’s ERG is larger than the infant’s. In photopic conditions (Fig. 10.3), the infant’s responses are detectable throughout the stimulus range, and maximum amplitudes are similar to those in adults.
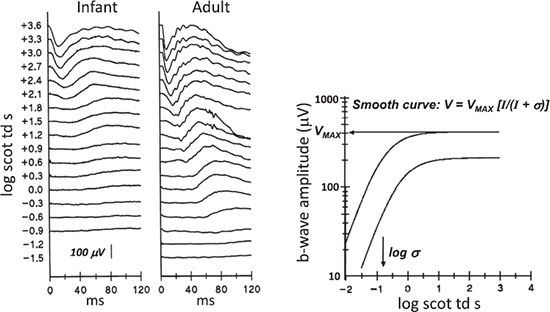
FIGURE 10.2 Sample scotopic ERG responses from normal subjects. Dark-adapted ERG responses to a series of flashes are shown for a 10-week-old infant (left) and an adult (right). Stimulus strength in log scotopic troland seconds (scot td s), a unit of retinal illuminance, is indicated to the left of the traces. This unit takes the area of the subject’s pupil into account. The graph shows b-wave amplitude as a function of stimulus strength. The calibration bar pertains to both infant and adult waveforms. In the right panel, the two curves plot the equation V = VMAX [I/(I + σ)] and represent the mean stimulus-response relationship in adults (N = 64, upper curve) and in infants (N = 39, lower curve). The mean values of VMAX and log crwere used to construct the infant and adult curves. The arrows indicate the values of VMAX and log a for the adult curve. VMAX, maximum (saturated) amplitude of the rod-driven b-wave; log σ, the stimulus that evokes a half maximum b-wave amplitude; I, strength of stimulus.
FIGURE 10.3 Sample photopic ERG responses from normal subjects. Light-adapted responses recorded to a series of long wavelength (red) flashes presented on a steady, white, rod-saturating background are shown for a 10-week-old infant (left) and an adult (right). Stimulus strength in log candela-second per square meter (cd·s/m2) is indicated to the left of the traces. The graph shows photopic b-wave amplitude (mean ± SEM) as a function of stimulus strength. Data are shown for 10-week-old infants (N = 28) and adult control subjects (N = 44). A photopic hill, which peaks at approximately 0.35 log cd·s/m2, is apparent in the adults but not in the infants.
The ERG is initiated when the visual pigment in the photoreceptor outer segment absorbs quanta of light, thus activating the biochemical phototransduction cascade. The first few milliseconds of the a-wave depend on the activity of the photoreceptors. Application of a mathematical model allows inferences about the sensitivity and saturated amplitude of the photoreceptor response (1,2). The rod a-wave represents activation of rod photoreceptors that send signals to the rod ON bipolar cells. Initiation of phototransduction in the cones is similar, but interpretation of the cone a-wave is complicated by activity in postreceptor cells (3). The cone-mediated b-wave results from the interaction of both ON and OFF bipolar cells (4,5). Activity of the bipolar and other second- and third-order neural cells in postreceptor retina contributes to the b-wave (6–8).
Rod photoreceptor sensitivity and saturated amplitude, derived from the a-wave, are low in young infants. For example, at age 10 weeks postterm, both photoresponse parameters, sensitivity and saturated amplitude, are approximately half the adult values (9). In normal development, the rod and rod-driven a- and b-wave parameter values are scaled by the rhodopsin content of the retina (9). Cone sensitivity and saturated amplitude are approximately 70% of the adult values at age 10 weeks (10).
In clinical work, much information is derived from the b-wave. Rod-driven b-wave responses of young infants differ significantly from those of adults: Amplitudes are smaller, implicit times longer, and sensitivity lower (9). The stimulus–response relationship for the b-wave in both infants and adults (Fig. 10.2, right panel) is summarized by the equation
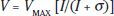
where V is the amplitude of the b-wave and I is the strength of the stimulus, specified in scotopic troland seconds (scot td s). The stimulus evoking a half maximum b-wave amplitude is designated σ. Thus, 1/σ is an index of sensitivity (11). Logistic growth curves summarizing the developmental changes in log σ and VMAX are shown in Figure 10.4.
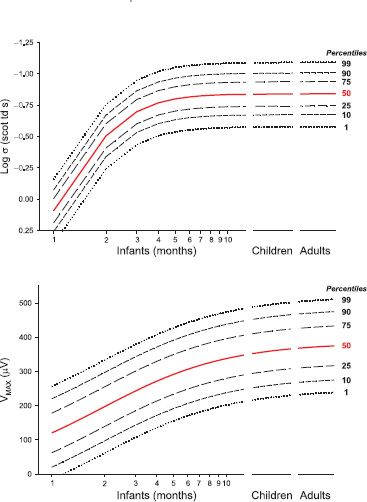
FIGURE 10.4 Development of normal scotopic ERG b-wave. Logistic growth curves summarizing the developmental changes in the scotopic ERG b-wave stimulus– response parameters log σ (top) and VMAX (bottom) are shown. Each parameter is plotted as a function of age. The curves were fit to data from 142 healthy control subjects; the 50th percentile is shown in red. The age scale for infants is expanded to facilitate application to analysis of results obtained from infant patients. After infancy, there is little change in these parameters.
The cone-driven b-wave stimulus–response relation in adults is characterized by increasing amplitude with increasing stimulus energy to a peak, followed by a decrease in amplitude with further stimulus increase (Fig. 10.3, right panel). The amplitude of the cone-driven b-wave in infants grows to nearly the adult peak but does not show the falloff at high intensity. This lack of the “photopic hill” is attributed to immature interaction of ON and OFF bipolar cell activity (10).
Data from normal infants and children are available for International Society for Clinical Electrophysiology of Vision (ISCEV) standard conditions (12,13). Normal developmental increases for these conditions are summarized by Fulton et al. (12). In both scotopic and photopic conditions, responses in infants are smaller than those in adults. It is essential that these differences be considered in interpretation of infant ERG results.
Multifocal ERG (mfERG): The mfERG is used to evaluate function in the central retina, including the macula. Responses from multiple discrete retinal regions, centered on the fovea, are evoked by multiple continuous stimuli, the luminance of which alternates under control of an m-sequence, a pseudorandom binary sequence (14,15).
The amplitudes of 10-week-old infants’ mfERG responses (Fig. 10.5) are significantly smaller and the implicit times significantly longer than those of adults (16). These results indicate that the cone-driven activity in the central retina is markedly immature. The mfERG response depends mainly on the activity of the cone bipolar cells (17). The distribution of mfERG responses in 10-week-old infants shows little variation in amplitude with eccentricity. This is in contrast to the adults’ large central peak and falloff with eccentricity found in adults. The explanation for the infant mfERG result lies in the immature distribution of the cone and cone bipolar cells in the central retina (16). The marked immaturity in the central retina sharply contrasts the relative maturity of cone activity in the peripheral retina of 10-week-olds that has been demonstrated by full-field ERG (10).
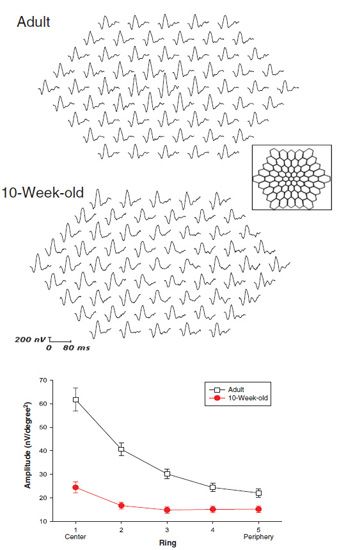
FIGURE 10.5 Multifocal ERG (mfERG). The 61 first-order responses are shown for an adult (upper trace array) and a 10-week-old infant (lower trace array). A schematic drawing of the stimulus, which subtends approximately 40 degrees visual angle, is shown in the box. The graph shows the amplitude (mean ± SEM) of the first positive peak (P1) of the responses to the central hexagon (ring 1) and the average of responses to all hexagons in each concentric ring (2 to 5) for infants (N = 23) and adults (N = 10).
Psychophysics
Psychophysical methods investigate the relation between stimulus, specified in precise physical terms, and the subject’s response. These noninvasive methods are widely used in the assessment of retinal function in pediatric patients.
Visual Acuity: Visual acuity, the most commonly measured visual threshold, is 20/20 in a healthy adult. At age 10 weeks, normal acuity is 20/300, well below that of adults (18). During infancy and early childhood, acuity matures. The minimal physical attribute of a visual stimulus that is reliably detected (minimum angle of resolution, MAR) decreases during development. The anatomy of the infant’s fovea predicts better acuity than measured. Neural processes central to the photoreceptors must limit the measured acuity (16,19). The template for normal acuity development is shown in Figures 10.7 and 10.13 (which show acuity for patients with LCA and achromatopsia). Shortcut procedures, such as the Teller Acuity Cards, are available for day-to-day clinical testing of infants and young children and have been used in multicenter studies.
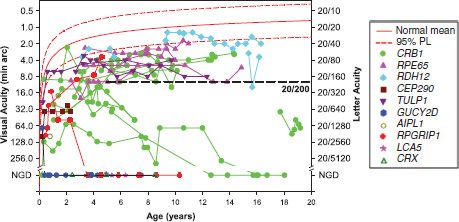
FIGURE 10.7 Acuity as a function of age in 33 patients with genetic diagnoses of LCA. The genetic diagnoses represent 10 of the 15 genes for which testing is readily available. For patients younger than 3 years, the results were obtained using the Teller Acuity Cards; at older ages, acuity was measured using symbols or letters. NGD on the vertical axis indicates no grating detection; patients who appear to have no light perception are included in this group. The solid red line describes average acuity for normal control subjects and the dashed line the upper and lower 95% prediction limits of normal (36). The horizontal dashed line indicates 20/200 acuity, a criterion for legal blindness. Although the majority of these 33 LCA patients had acuity below the 95% prediction limit, 17 had acuity of 20/200 or better.
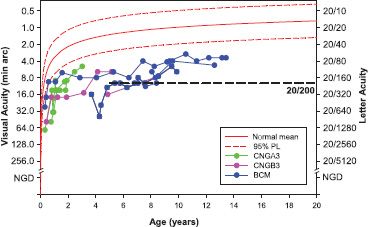
FIGURE 10.13 Acuity as a function of age in patients with achromatopsia (CNGA3, CNGB3) and blue cone monochromatism (BCM). For patients younger than 3 years, the results were obtained using the Teller Acuity Cards; at older ages, acuity was measured using symbols or letters. The solid red line describes average acuity for normal control subjects and the dashed lines the upper and lower 95% prediction limits of normal (36). The horizontal dashed line indicates 20/200 acuity, a criterion for legal blindness. Acuity in these patients is generally below the 95% prediction limit.
Psychophysical Assessment of Rod-Mediated Function: Psychophysical methods are used to study rod-mediated visual thresholds from which retinal processes can be deduced. The parameters of the stimulus (size, duration, wavelength, and retinal eccentricity) are precisely specified. Factors that determine the effectiveness of the stimulus at the retina include transmissivity of the ocular media, retinal rhodopsin content, outer segment length, and retinal cell density (cells/mm2).
Retinal processes can be investigated using psychophysical methods even when the ERG response is markedly attenuated. Thus, psychophysics provides a valuable method for following the course of retinal disease or response to treatment.
Thresholds of infants and young children are measured using a two alternative, spatial, forced-choice preferential-looking method. Following 30 minutes of dark adaptation, the infant’s gaze is directed to a fixation target at the center of a dark screen. An adult observer reports when the infant is alert and looking at the fixation target. Then, a stimulus is presented on either the left or the right side of the screen. On every trial, the observer reports stimulus location (right or left) and receives feedback. Older subjects may point to the stimulus or report verbally. Rigorous psychophysical procedures with well-documented properties are used to specify threshold. Examples of such procedures are the method of constant stimuli and staircase methods.
Dark-Adapted Threshold: The dark-adapted threshold (DAT) is the dimmest test light reliably detected by the subject under dark-adapted conditions. DATs in infants are elevated relative to those in adults. At age 10 weeks, threshold is one log unit higher than in adults (20). That is, the stimulus must be 10 times stronger for reliable detection by an infant. Spectral sensitivity confirms that these thresholds are rod mediated (20). Cross-sectional and longitudinal data suggest that the DAT matures by about age 6 months (21). Developmental elongation of the rod outer segments and consequent increase in quantum catch account for threshold maturation in infancy (22).
Spatial Summation: Studies of spatial summation that demonstrate the ability of the retina to integrate information over area provide evidence of immature organization of retinal receptive fields (23). Thresholds decrease with increasing stimulus diameter up to a critical diameter beyond which there is little further decrease in threshold. The size of the critical diameter in adults is approximately 1 to 2 degrees, whereas in 10-week-old infants, it is much larger, approximately 6 degrees (21,23). Additionally, the center surround organization of the infant retina appears to have a larger excitatory center than in the adult (24).
Temporal Summation: Temporal processing in the immature retina has also been studied (21,25). In adults, threshold decreases with increasing stimulus duration for stimuli <100 ms. For stimuli longer than 100 ms, there is little decrease in threshold. In infants, thresholds decrease over the entire range of 10 to 640 ms. The slope of log threshold as a function of log duration in infants is approximately 0.5. Complete temporal summation (slope of −1.0 on log–log coordinates) was not found in any infant (25). These results are interpreted as evidence that a noise-limited process is involved in detection of brief stimuli by infants.
Retinal Adaptation: Recovery of retinal sensitivity after exposure to light can be measured using the ERG and recovery of pupil diameter following a bleaching exposure (26,27). The results of these studies suggest that rod dark adaptation in young infants has the same time course as in adults. Because of the time needed to complete each threshold measurement, the time course of dark adaptation has not been measured in infants using psychophysical methods.
Background Adaptation: The effect of steady background light on rod-mediated visual threshold has also been studied in healthy infants using psychophysical procedures. Models of the resulting increment threshold function allow testing of hypotheses about the site of immaturity or disease (28). Thresholds are measured in the dark-adapted state and then with stimuli presented on a series of increasingly intense adapting fields. Very dim backgrounds have little effect on threshold. For brighter backgrounds, log threshold increases linearly with log background intensity. The background intensity at which threshold is elevated 0.3 log unit above the dark-adapted level is called the eigengrau. At that background, the number of thermal and photoisomerizations is equal. The increment threshold function is summarized by the equation

where T is the threshold measured at background I (scotopic trolands), TD is the DAT, and Ao the eigengrau. Immaturity or a disease limited to the photoreceptors elevates both TD and Ao. Immaturity or disease that affects postreceptor processing elevates TD only. Background adaptation has been studied in patients with a history of ROP (29) and in patients with retinal degenerations (30).
LCA is a group of retinal degenerative conditions (31,32). LCA is typically symptomatic from early infancy onward and is the diagnosis that comes to the clinician’s mind when a healthy infant presents as possibly blind. Visual inattention and roving eye movements or nystagmus are the classic presenting symptoms in an infant with LCA. These symptoms are not specific to LCA nor constant in LCA.
A broad spectrum of signs is found in infants and young children in whom a genetic diagnosis of LCA is ultimately secured. Responses of the pupils to a hand light may be conspicuously attenuated or quite brisk. Often infants with LCA have high hyperopia. However, we have encountered patients with a genetic diagnosis of LCA who have myopia in excess of 10 diopters in early childhood. Fundus appearance (Fig. 10.6) ranges from normal to having marked abnormality of pigmentation; normal vascular caliber is seen in some, but arteriolar attenuation is found in many. Optic nerve heads are remarkably pink in some but in others are pale or have indistinct margins. Either atrophic maculae or thickened maculae have been demonstrated by ocular coherence tomography (OCT) (33). In short, the history and examination in the office can raise the suspicion of LCA but, given the enormous spectrum of clinical features, will not secure the diagnosis. Prompt testing of retinal function is the next step in making the diagnosis.
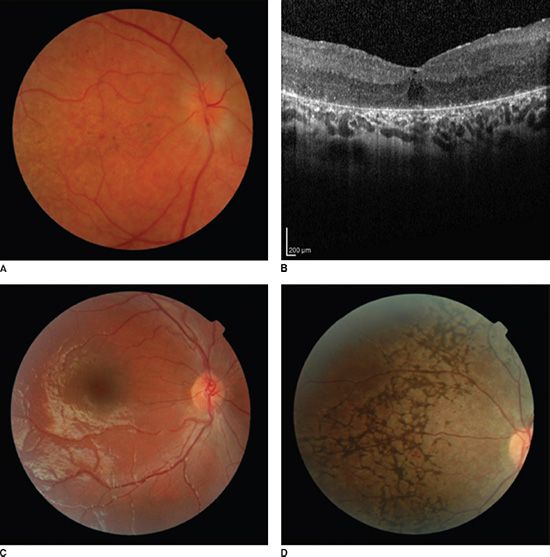
FIGURE 10.6 Fundus photos and OCT from patients with LCA having different genetic diagnoses. A: Photo from an 8-year-old patient with CRB1 disease shows abnormal pigment deposits in the macula and indistinct disc margins. Note that arteriole caliber is only mildly attenuated and the optic nerve head is quite pink. B: OCT from the same patient shows thickening of the macula that was also appreciated on ophthalmoscopy. C: photo from a 4-year-old patient with GUCY2D disease and bare light perception shows many normal fundus features. D: Photo from a 15-year-old patient with RDH12 disease and 20/30 visual acuity shows markedly abnormal pigmentation.
ERG responses are markedly attenuated in both scotopic and photopic conditions. In our patients with a genetic diagnosis of LCA, the amplitude of the ERG responses is significantly reduced, often <5% of the normal mean for age, even when visual function (central visual acuity and DAT) is quite well preserved.
Acuity is measurable in the majority of our patients with LCA. Acuity tests provide assessment of function mediated by the central retina. Procedures and test materials, such as the Feinbloom chart and the Teller Acuity Cards, are available for quantifying very low vision that is sometimes reported as “hand motion” or “count fingers” vision (34,35). Rather than reporting nonquantitative assessments of form vision, use of these measures is strongly encouraged because they yield numeric results that facilitate monitoring of the patient’s course.
Acuity of 20/400 or better throughout the life span is found in approximately a quarter of patients with LCA (35). At young ages, we have found acuity of 20/200 or better in more than half of patients with a genetic diagnosis of LCA (Fig. 10.7). In agreement with Walia et al. (35), the best acuities in our patients were in those with the RDH12, RPE65, and CRB1 forms of LCA. In some children for whom a genetic diagnosis of LCA is ultimately secured, vision is so good that the diagnosis is initially overlooked by experienced pediatric ophthalmologists. Among these patients, visual impairment may not be recognized until the child reaches the age of independent ambulation; the parents report that the child becomes lost even in familiar environments.
Although it is a huge advantage to have relatively good acuity for early learning tasks, these children have reduced contrast sensitivity. Thus, with typical high-contrast acuity tests, acuity of 20/50 or 20/60 may be obtained, but the vision may plummet to 20/200 or worse for low-contrast stimuli. If low-contrast sensitivity is not recognized and reported to the child’s educators, huge difficulties in implementing a satisfactory educational plan are encountered.
Rod-mediated peripheral retinal function is assessed by measurement of the dark-adapted visual threshold (DAT, the dimmest light reliably detected by the patient under dark-adapted conditions). DATs are measurable in the majority of our patients with LCA even when the ERG responses are markedly attenuated (<5% of the normal amplitude for age). Elevation of the DAT from an early age is the rule (Fig. 10.8). Progressive loss of retinal sensitivity is indicated by further elevation of the threshold with increasing age. A worsening of one log unit or more over time is a Significant change in an individual’s threshold (37). In those patients who appear to have no light perception on clinical assessment, performance on the two alternative threshold test falls to chance, indicating no reliable detection of the stimulus light. As in other retinal degenerations, regional variations in severity occur across the retina (38) and may affect thresholds.
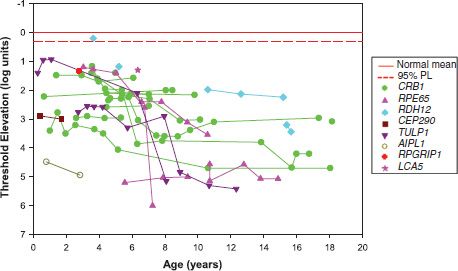
FIGURE 10.8 Elevation in DAT as a function of age in patients with genetic diagnoses of LCA. The genetic diagnoses represent eight of the 15 genes for which testing is readily available. Thresholds for the patient’s detection of 10 degree diameter, 50 ms duration spots of light presented 20 degrees to the left or right of a red fixation target were determined as described in the text (Normal Development section; Psychophysics, Assessment of rod-mediated function). The solid red line indicates the normal mean threshold; the dashed red line indicates 2 standard deviations below the mean. In almost all patients at all visits, thresholds were significantly elevated. For an individual patient, one log unit worsening of threshold over time is a significant change (37).
Stay updated, free articles. Join our Telegram channel

Full access? Get Clinical Tree


