Purpose
To compare the visual performance of patients with unilateral cataract following implantation of monofocal, accommodating, refractive, and diffractive multifocal intraocular lenses (IOL).
Design
Prospective nonrandomized clinical trial.
Methods
Eighty-seven patients with unilateral cataract were enrolled in 4 groups for phacoemulsification and IOL implantation. Twenty-four patients had monofocal (Alcon Acrysof) (group 1), 21 patients had accommodating (Human Optics 1CU) (group 2), 22 patients had diffractive multifocal (Tecnis ZM900) (group 3), and 20 patients had refractive multifocal (AMO Rezoom) (group 4) IOL implantations. Ages of patients were between 40 and 70. Parameters analyzed at the 18th postoperative month were subjective refractions, monocular and binocular distance, intermediate and near uncorrected visual acuities, monocular distance and near best-corrected visual acuities, monocular distance-corrected intermediate and near visual acuities, stereopsis, visual complaints, and spectacle dependency.
Results
No significant difference was observed between distance and near best-corrected visual acuities of IOL groups, and between intermediate visual acuities of groups 2, 3, and 4. Groups 3 and 4 had statistically better near vision than the other groups ( P < .05). No significant difference was observed between near visual acuities of groups 3 and 4. Number of patients with better stereoscopic function, spectacle independence, and complaints of halo in groups 3 and 4 was significantly higher than in other groups ( P < .05).
Conclusions
Multifocal IOLs provide better stereopsis, higher spectacle independence rates, and satisfactory functional vision over a broad range of distances in presbyopic patients with unilateral cataract compared with the monofocal and accommodating IOLs.
Presbyopia in the context of cataract rehabilitation presents a major challenge for surgeons who perform cataract and refractive surgeries. Several procedures are available including scleral expansion surgery, corneal inlays, zonal photorefractive keratectomy, accommodating intraocular lenses (IOLs), and various types of multifocal IOLs. Surgically created myopic astigmatism and monovision (unilateral myopia) may be used to compensate for pseudophakic presbyopia; however, both near and distance binocular visual function deteriorate with these techniques.
Lack of accommodation in the pseudophakic eye after unilateral cataract surgery may result in varying degrees of aniseikonia and anisometropia, particularly in younger patients who have accommodative capability in the fellow eye. This can compromise binocular vision, particularly in intermediate and near visual acuity. Elderly patients with pseudophakic presbyopia after monofocal IOL implantation are less likely to experience anisometropia and aniseikonia because the healthy fellow eye also needs correction for near vision. However, unilateral monofocal IOLs do not provide adequate depth of focus at distance, intermediate, and near vision and may decrease binocular visual function. Multifocal IOLs allow visual acuity over a wide range of distances and may have an additive effect on binocular vision in patients with unilateral cataract; however, this procedure has drawbacks such as low contrast sensitivity, haze, glare, and decreased night vision.
The aim of this study was to evaluate and compare the clinical safety and efficacy of conventional monofocal IOLs, accommodating IOLs, and refractive and diffractive multifocal IOLs in presbyopic patients with unilateral cataract. To accomplish this, we examined monocular and binocular vision at different distances, assessing stereopsis, visual complaints, spectacle dependency, and satisfaction with corrected vision in patients with the various IOLs.
Methods
This prospective nonrandomized clinical study included 87 patients with unilateral cataract who were scheduled for cataract extraction and IOL implantation between February 2008 and June 2008. Twenty-four patients received a monofocal IOL (group 1), 21 received an accommodating IOL (group 2), 22 received a diffractive multifocal IOL (group 3), and 20 patients received a refractive multifocal IOL (group 4). Patient selection was based on age, and the inclusion criteria were unilateral cataract needing distance correction, Snellen visual acuity of less than 20/32, a healthy fellow eye with no cataract, and a corrected Snellen visual acuity of 20/25 or better, age between 40 and 70 years, and precataract myopia or hyperopia ≤1.5 diopters (D). Exclusion criteria were a history of amblyopia, astigmatism over 1.5 D, mesopic pupil size larger than 6 mm, aniridia, microphthalmos, uncontrolled glaucoma, chronic uveitis, corneal disease (opacities, degenerations, dystrophies), previous ocular surgery or trauma that caused zonular defects, iris and lens capsule defects, previous retinal surgery, and retinal pathology (macular disease, diabetic retinopathy). Intraoperative exclusion criteria were capsular defect and vitreous loss.
The monofocal IOL group received an Acrysof SA60AT foldable hydrophobic acrylic IOL with an optic diameter of 6.0 mm and total diameter of 13 mm (Alcon, Fort Worth, Texas, USA). The accommodating IOL group received the 1CU Accommodative IOL, a foldable, hydrophilic acrylic posterior chamber IOL with an optic diameter of 5.5 mm and total length of 9.8 mm (HumanOptics AG, Erlangen, Germany). This IOL had a refractive index of 1.46, biconvex square-edged optic, and 4 flexible haptics that bend when constricted by the capsular bag after ciliary muscle contraction. The optic was able to move along the anterior visual axis. The diffractive IOL group received a Tecnis ZM900 (Advanced Medical Optics Inc [AMO], Santa Ana, California, USA), a 3-piece silicone IOL with an anterior modified prolate surface and a diffractive posterior surface. This IOL had a 2.85-D add at the spectacle plane. The refractive multifocal IOL group received a Rezoom (AMO) hydrophobic acrylic 3-piece IOL with 5 refractive optical zones on the anterior surface; the first, third, and fifth zones were designed for distance vision and the second and fourth zones for near vision. The aspheric transition zones between these 5 zones were designed for intermediate vision. The lens had a 2.5-D add at the spectacle plane.
Immersion A-scan biometry was used to measure IOL power, and the SRK/T formula was used to make biometric calculations. The A-constants for the Alcon Acrysof, 1CU Accommodative, Tecnis ZM900, and Rezoom were 118.4, 118.1, 119, and 118.4, respectively. The target refraction for these IOLs based on the manufacturer’s recommendations were emmetropia, −0.25 D, between emmetropia and 0.25 D, and emmetropia, respectively.
All surgeries were performed by the same surgeon (C.M.). A 3-mm clear corneal tunnel incision was made at the steepest meridian, and capsulorhexis with a 5.0- to 5.5-mm hydrodissection, phacoemulsification of the nucleus, aspiration of the cortical remnants, and IOL implantation into the capsular bag were performed under topical anesthesia. The monofocal IOL was implanted using a Monarch II injector (Alcon); a Deutschmann injector (Deutschmann, Zittau, Germany) was used for the accommodating IOL; and the Unfolder Silver delivery system and Unfolder Emerald delivery system (Abbott Medical Optics, Abbott Park, Illinois, USA) were used for the diffractive and refractive IOL implantation, respectively. Ofloxacin 0.3% and dexamethasone 0.2% eye drops were administered 4 times a day for 3 or 4 weeks after surgery.
Prior to surgery, the corrected visual acuity of the eye with the cataract and the fellow eye were measured, and the uncorrected visual acuity and refractive measurements of the fellow eye were taken.
Follow-up examinations were conducted at 1 and 2 weeks after surgery and then at 1, 3, 6, 9, 12, 14, and 18 months. During each visit, a slit-lamp examination was performed and intraocular pressure was measured using Goldmann tonometry. Eighteen months after surgery, subjective refractions and monocular distance and near best-corrected visual acuity; distance-corrected near and intermediate visual acuity; and monocular and binocular distance, intermediate, and near uncorrected visual acuity were measured.
Distance visual acuity was measured in logarithm of minimal angle of resolution (logMAR) units using an Early Treatment Diabetic Retinopathy Study (ETDRS) chart (Precision Vision, Aurora, Colorado, USA) at 4 m with 100% contrast. Intermediate and near visual acuity were measured in logMAR units with an ETDRS chart at 60 cm and 35 cm, respectively.
Binocular function was evaluated 18 months after surgery using the Titmus test (Stereo Optical Co, Chicago, Illinois, USA). Corrected near vision in the fellow eye was used in stereo testing. Patients wore polarized eyeglasses during the test and held a book at a distance of 40 cm. Stereoscopic measurements were carried out at 2 disparity threshold values: 100 and 40 seconds of arc.
Spectacle dependency for near and distance vision, visual complaints of glare and halo, and patients’ overall satisfaction with their vision were determined by questioning the patients. The patients were asked if they experienced halo or glare in their everyday life, and these conditions were illustrated with a picture of a halo and glare. No further questions were asked if the response to the initial question was negative. However, if the response was yes, the patients were asked if the complaints were excessive and if they would like an IOL exchange. The overall satisfaction rate was determined using the generic query, “Are you happy in your daily life with the result of the procedure?” To ensure the patients understood the question, additional clarification was given, such as asking whether their vision was satisfactory while performing their job, daily tasks, and hobbies. If the patient answered yes, no further questions were asked. However, patients who answered no were asked if they were unhappy with the result of their surgery and whether they would like an IOL exchange.
Statistical analyses were performed using NCSS-PASS statistical software (NCSS, Kaysville, Utah, USA). Mean visual acuity was calculated from the logMAR values according to the method described by Holladay. The Kruskal-Wallis test was used for between-group comparisons, and Dunn’s test was used with the Bonferroni correction to compare visual acuity among the subgroups. One-way analyses of variance (ANOVA) were used to compare groups, and the Tukey multiple-comparison test was used to compare refractive measurements among the subgroups. Categorical variables were compared using the χ 2 test. The results are expressed as mean ± standard deviation, and P < .05 was deemed to be statistically significant.
Results
No difference was found between IOL groups in preoperative distance-corrected visual acuity of the cataract eye ( P = .926), in the distance best-corrected ( P = .982) and uncorrected ( P = .862) visual acuity, or in the spherical equivalence in the fellow eye ( P = .807). No significant difference in age or gender was found between groups ( P = .972 and P = .986, respectively; Table 1 ). We did not observe a spherical refractive error of more than 1.5 D in the fellow eyes. Table 2 shows the patients grouped according to refractive error in the fellow eye.
| IOL Types | Monofocal | Accommodating | Multifocal | P Value a | |
|---|---|---|---|---|---|
| IOLs (No. of Eyes/Patients) | Group 1 Alcon SA 60 AT (24/24) | Group 2 1CU Human Optics (21/21) | Group 3 Tecnis ZM900 (22/22) | Group 4 Rezoom (20/20) | |
| Distance BCVA of eyes with cataract (mean ± SD), logMAR (Snellen) | 0.46 ± 0.22 (20/57) | 0.46 ± 0.23 (20/57) | 0.47 ± 0.24 (20/60) | 0.4 ± 0.16 (20/50) | .926 |
| Distance UCVA of fellow eyes (mean ± SD), logMAR (Snellen) | 0.15 ± 0.14 (20/28) | 0.17 ± 0.15 (20/30) | 0.13 ± 0.13 (20/26) | 0.15 ± 0.1 (20/28) | .862 |
| Distance BCVA of fellow eyes (mean ± SD), logMAR (Snellen) | 0.04 ± 0.05 (20/22) | 0.05 ± 0.05 (20/22) | 0.05 ± 0.06 (20/22) | 0.04 ± 0.04 (20/22) | .982 |
| Refraction of fellow eyes (D) (mean ± SD) | −0.2 ± 0.8 | −0.3 ± 0.9 | −0.1 ± 0.7 | −0.2 ± 0.6 | .807 |
| Ages (mean ± SD) | 61 ± 8.2 | 62.1 ± 7.5 | 61.7 ± 7.4 | 61.5 ± 8.3 | .972 |
| Ratio male/female | 12/12 | 11/10 | 12/10 | 11/9 | .986 |
| Spherical Equivalent of Healthy Fellow Eyes | Alcon SA 60 AT (Group 1) (n = 24) | ICU Human Optics (Group 2) (n = 21) | Tecnis ZM900 (Group 3) (n = 22) | Rezoom (Group4) (n = 20) |
|---|---|---|---|---|
| 1.5 D | 1 | 1 | — | — |
| 1 D | 3 | 2 | 2 | 1 |
| 0.5 D | 7 | 5 | 8 | 7 |
| −1.5 D | 1 | 2 | 1 | — |
| −1 D | 4 | 4 | 2 | 3 |
| −0.5 D | 8 | 7 | 9 | 9 |
No significant difference in postoperative mean cylindrical error was found between groups ( P = .765). The mean spherical equivalent was slightly hyperopic in the multifocal IOL group and slightly myopic in the accommodating and monofocal IOL groups ( P = .0001). The add power to achieve the near best-corrected visual acuity was significantly different between groups ( P = .0001). The diffractive IOL group (group 3) required the least add power, and the monofocal IOL group (group1) required the most. The refractive multifocal group (group 4) had a lower add value than did the accommodating IOL group (group 2). These values are shown in Table 3 .
| Alcon SA 60 AT (Group 1) | 1CU Human Optics (Group 2) | Tecnis ZM900 (Group 3) | Rezoom (Group 4) | P a | |
|---|---|---|---|---|---|
| Postoperative astigmatism (D) (mean ± SD) | −0.45 ± 0.19 | −0.51 ± 0.23 | −0.47 ± 0.19 | −0.48 ± 0.2 | .765 |
| Postoperative spherical equivalent (D) (mean ± SD) | −0.16 ± 0.29 | −0.13 ± 0.32 | 0.32 ± 0.14 | 0.24 ± 0.15 | .0001 |
| Postoperative near addition (D) (mean ± SD) | 2.46 ± 0.18 | 1.33 ± 0.25 | 0.31 ± 0.27 | 0.7 ± 0.19 | .0001 |
a P < .05 = statistically significant. Bold indicates statistically significant P values.
Eighteen months after surgery, posterior capsular opacification (PCO) was observed in 3 of the 24 patients (12.5%) in group 1, in 8 of the 21 patients (38.1%) in group 2, in 3 of the 22 patients (13.6%) in group 3, and in 2 of the 20 patients (10%) in group 4. Although the frequency of PCO was the highest in the accommodating IOL group, the difference between groups was not statistically significant ( P = .064). Nd:YAG laser capsulotomies were performed in patients who had PCO using the Visulas YAG II (Carl Zeiss, Jena, Germany).
The mean monocular distance best-corrected visual acuities and distance-corrected intermediate and near visual acuities are shown in Table 4 and Figure 1 . The mean monocular distance best-corrected visual acuity did not differ among groups ( P = .442). The mean distance-corrected intermediate visual acuity in group 1 was significantly lower than that of the other groups ( P = .0001), but no significant difference was found between groups 2 and 3 ( P = .08), groups 4 and 3 ( P = .07), or groups 2 and 4 ( P = .979). The mean distance-corrected near visual acuity in group 1 was significantly lower than that found in the other IOL groups ( P = .0001). The mean monocular distance-corrected near visual acuity was significantly higher in group 3 than in group 2 ( P = .0001), but no difference was found between groups 3 and 4 ( P = .09). The mean monocular distance-corrected near visual acuity of group 4 was significantly higher than that of group 2 ( P = .0001).
| Alcon SA 60 AT (Group 1) | 1CU Human Optics (Group 2) | Tecnis ZM900 (Group 3) | Rezoom (Group 4) | P a | |
|---|---|---|---|---|---|
| Monocular distace best-corrected visual acuity (mean ± SD), logMAR (Snellen) | −0.03 ± 0.07 (20/19) | −0.03 ± 0.073 (20/19) | −0.009 ± 0.06 (20/20) | −0.01 ± 0.064 (20/20) | .442 |
| Monocular distance-corrected intermediate visual acuity (mean ± SD), logMAR (Snellen) | 0.64 ± 0.07 (20/87) | 0.29 ± 0.07 (20/39) | 0.35 ± 0.07 (20/45) | 0.28 ± 0.08 (20/38) | .0001 |
| Monocular distance-corrected near visual acuity (mean ± SD), logMAR (Snellen) | 0.67 ± 0.05 (20/95) | 0.3 ± 0.06 (20/40) | 0.08 ± 0.08 (20/24) | 0.14 ± 0.05 (20/28) | .0001 |
| Monocular distance uncorrected visual acuity (mean ± SD), logMAR (Snellen) | 0.05 ± 0.06 (20/22) | 0.05 ± 0.05 (20/22) | 0.06 ± 0.05 (20/22) | 0.06 ± 0.05 (20/22) | .86 |
| Monocular intermediate uncorrected visual acuity (mean ± SD), logMAR (Snellen) | 0.63 ± 0.09 (20/85) | 0.29 ± 0.06 (20/39) | 0.36 ± 0.06 (20/45) | 0.28 ± 0.08 (20/38) | .0001 |
| Monocular near uncorrected visual acuity (mean ± SD), logMAR (Snellen) | 0.66 ± 0.05 (20/92) | 0.29 ± 0.07 (20/39) | 0.07 ± 0.075 (20/23) | 0.15 ± 0.05 (20/28) | .0001 |
| Monocular near best-corrected visual acuity (mean ± SD), logMAR (Snellen) | 0.02 ± 0.04 (20/21) | 0.01 ± 0.04 (20/20) | 0 ± 0.03 (20/20) | 0.005 ± 0.02 (20/20) | .287 |
| Binocular distance uncorrected visual acuity (mean ± SD), logMAR (Snellen) | −0.05 ± 0.06 (20/18) | −0.06 ± 0.06 (20/17) | −0.05 ± 0.05 (20/18) | −0.05 ± 0.05 (20/18) | .979 |
| Binocular intermediate uncorrected visual acuity (mean ± SD), logMAR (Snellen) | 0.4 ± 0.09 (20/50) | 0.2 ± 0.04 (20/32) | 0.26 ± 0.05 (20/36) | 0.2 ± 0.06 (20/32) | .0001 |
| Binocular near uncorrected visual acuity (mean ± SD), logMAR (Snellen) | 0.48 ± 0.12 (20/60) | 0.25 ± 0.08 (20/36) | 0.05 ± 0.075 (20/22) | 0.125 ± 0.06 (20/27) | .0001 |
a P < .05 = statistically significant. Bold indicates statistically significant P values.
The mean monocular uncorrected visual acuities for distance, intermediate, and near vision are shown in Table 4 and Figure 2 . No significant between-group difference was found in the mean monocular distance uncorrected visual acuity ( P = .86). The mean intermediate uncorrected visual acuity of group1 was significantly lower than that of the other groups ( P = .0001). No significant difference was found between groups 2 and 3 ( P = .07), groups 4 and 3 ( P = .06), or groups 2 and 4 ( P = .912). The mean monocular near uncorrected visual acuity of group 1 was significantly lower than that of the other IOL groups ( P = .0001). The value was significantly higher in group 3 than it was in group 2 ( P = .0001), but no significant difference was found between groups 3 and 4 ( P = .07). The mean near uncorrected visual acuity of group 4 was significantly higher than that of group 2 ( P = .0001). No significant difference in monocular near best-corrected visual acuity was found among groups ( P = .287).
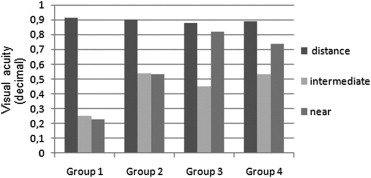
The mean binocular uncorrected visual acuities are shown in Table 4 and Figure 3 . No significant difference in mean binocular distance uncorrected visual acuity was found among groups ( P = .979). The mean binocular intermediate uncorrected visual acuity in group 1 was significantly lower than that in the other IOL groups ( P = .0001); however, no difference was found between groups 2 and 3 ( P = .08), 4 and 3 ( P = .08), or 2 and 4 ( P = .999). The mean binocular near uncorrected visual acuity of group 1 was lower than that of the other groups ( P = .0001). The mean of group 3 was significantly higher than that of group 2 ( P = .0001), and no significant difference was found between groups 3 and 4 ( P = .08), but the mean binocular near uncorrected visual acuity of group 4 was significantly higher than that of group 2 ( P = .0001).


