Purpose
To measure the density of the superficial retinal small vessel network (SRSVN), superficial retinal capillary network (SRCN), deep retinal capillary network (DRCN), and choriocapillaris and the size of the foveal avascular zone (FAZ) in the superficial retinal layer in normal eyes.
Design
Prospective observational cross-sectional study.
Methods
In healthy Chinese volunteers, the retinal and choroidal vasculature was visualized by split-spectrum amplitude decorrelation angiography–associated optical coherence tomography (RTVueXR Avanti device; Optovue Inc, Fremont, California, USA).
Results
Among 105 healthy participants (age: 35.9 ± 13.8 years) mean FAZ measured 0.35 ± 0.12 mm 2 , and mean density of SRSVN, SRCN, DRCN, and choriocapillaris was 8.54% ± 0.92%, 31.8% ± 2.6%, 45.8% ± 3.3%, 44.4% ± 3.3%, and 44.5% ± 2.7%, respectively. In multivariate analysis, higher SRSVN density was associated with younger age ( P = .001; standardized regression coefficient β: −0.28), male sex ( P = .008; β: −0.23), lower SRCN density ( P < .001; β: −0.40), and larger mean choriocapillaris vessel diameter ( P = .001; β: 0.30). Higher SRCN density was correlated with male sex ( P = .007; β: −0.19), lower SRSVN density ( P < .001; β: −0.44), and higher density of the radial peripapillary capillary density ( P = .004; β: 0.20). Higher DRCN density was correlated with younger age ( P < .001; β: −0.31), female sex ( P = .002; β: 0.22), higher SRCN density ( P < .001; β: 0.38), and higher choriocapillaris density ( P < .001; β: 0.39). Higher choriocapillaris network density in the central region was associated with higher DRCN density ( P < .001; β: 0.43) and lower radial peripapillary capillary density ( P = .005; β: −0.26). All retinal vascular parameters were not significantly correlated with axial length or subfoveal choroidal thickness.
Conclusions
The density of the macular vascular networks decreases with older age and is independent of axial length and subfoveal choroidal thickness in healthy individuals.
The vascular system of the retina is of paramount importance for visual function and its examination is of profound interest for the assessment of retinal and choroidal diseases. Since the landmark study by Novotny and Alvis more than 50 years ago, fluorescein angiography has become the mainstay in the diagnosis of ischemic retinopathies such as diabetic retinopathy. Later, indocyanine green angiography was added to the panoply of techniques for the diagnosis of diseases associated with a breakdown of the blood-retina barrier, such as exudative age-related macular degeneration or polypoidal choroidal vasculopathy. However, owing to the 2-dimensionality of the fundus photographic technique, conventional fluorescein angiography has not been able to show findings that were stratified by the different retinal layers. By the same token, indocyanine green angiography could not visualize the choriocapillaris separated from the layers of the medium-large and large vessels of the choroid. In addition, both techniques, fluorescein angiography and indocyanine green angiography, are invasive and harbor the risk of allergic reactions.
Split-spectrum amplitude-decorrelation angiography (SSADA) associated with optical coherence tomography (OCT angiography) is a new method that can visualize the vascular networks in separate layers of the retina and in the choriocapillaris in the macular region, as well as in the peripapillary region of the optic nerve head, without the need to inject a dye. Previous studies demonstrated a high intravisit repeatability and intervisit reproducibility, and pilot studies showed the clinical applicability of the new noninvasive technique for the diagnosis of retinal and choroidal diseases. Studies that addressed the normal values of many of the parameters measured by OCT angiography and that examined the associations with other ocular and systemic parameters, in particular with age and axial length, have mostly been missing so far. It is, however, mandatory to know the normal variation of a parameter and its associations if this parameter is used to diagnose diseases. We therefore developed a method to measure the size of the foveal avascular zone (FAZ) and to assess the density of the superficial and deep vascular networks in the macular region, the density of the choriocapillaris, and the density of the radial peripapillary capillary network, and we examined these parameters in normal eyes in this study.
Methods
The prospective, observational, cross-sectional study included volunteers who were recruited between April and June 2015. The study protocol was approved by the Medical Ethics Committee of the Beijing Tongren Hospital and written informed consent was obtained from all study participants. The Beijing Tongren Hospital is one of the 3 largest ophthalmic hospitals in China, with more than 1 million ophthalmologic patients treated per year. Inclusion criteria were no history of ocular diseases or ocular surgeries, an unremarkable ophthalmologic examination including a normal appearance of the anterior segment and posterior segment of the eye and an intraocular pressure within the normal range, and a best-corrected visual acuity of 20/20 or better. Myopia, incipient cataract, and pseudophakia not affecting the quality of the OCT angiographic images or age were not exclusion criteria.
Mydriasis was obtained by applying eye drops containing 0.5% tropicamide and 0.5% phenylephrine hydrochloride in all study participants. The ophthalmic examinations included automatic refractometry (Auto Refractometer RM-8900; Topcon Inc, Tokyo, Japan), measurement of best-corrected visual acuity, slit lamp–assisted biomicroscopy of the anterior segment, tonometry, fundus photography (Hybrid Digital Mydriatic Retinal Camera CX-1; Canon Inc, Tokyo, Japan), and spectral-domain optical coherence tomography (SDOCT) (Heidelberg Engineering Co, Heidelberg, Germany). Biometry by optical low-coherence reflectometry (Lensstar 900 Optical Biometer; Haag-Streit, Koeniz, Switzerland) was carried out to measure axial length, central corneal thickness, anterior chamber depth, and lens thickness. Applying the enhanced depth imaging mode of the SDOCT and using the Heidelberg Eye Explorer (software v. 5.3.3.0; Heidelberg Engineering Co), we measured subfoveal choroidal thickness. The oxygen saturation of the retinal arteries and veins was assessed using the Oxymap digitizer (Oxymap T1, Oxymap Analyzer v2.4.2; Oxymap ehf. Co., Reykjavik, Iceland) mounted on a Topcon retinal camera (TRC-50DX; Topcon Co., Tokyo, Japan).
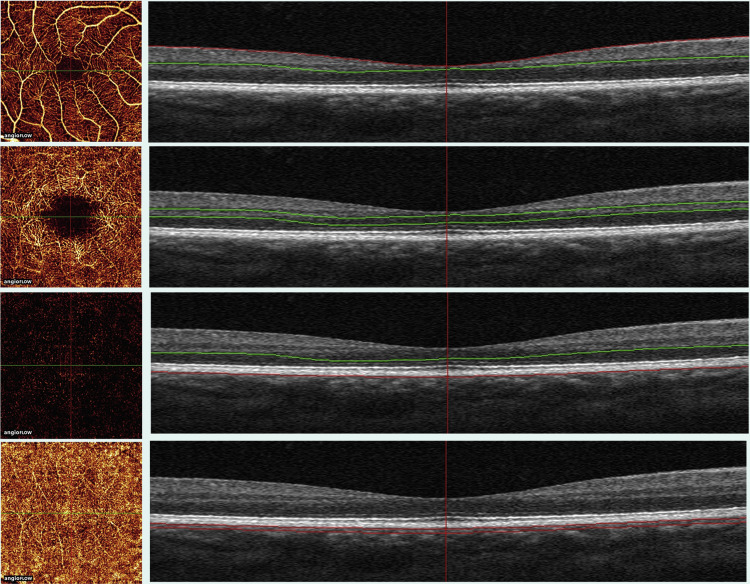
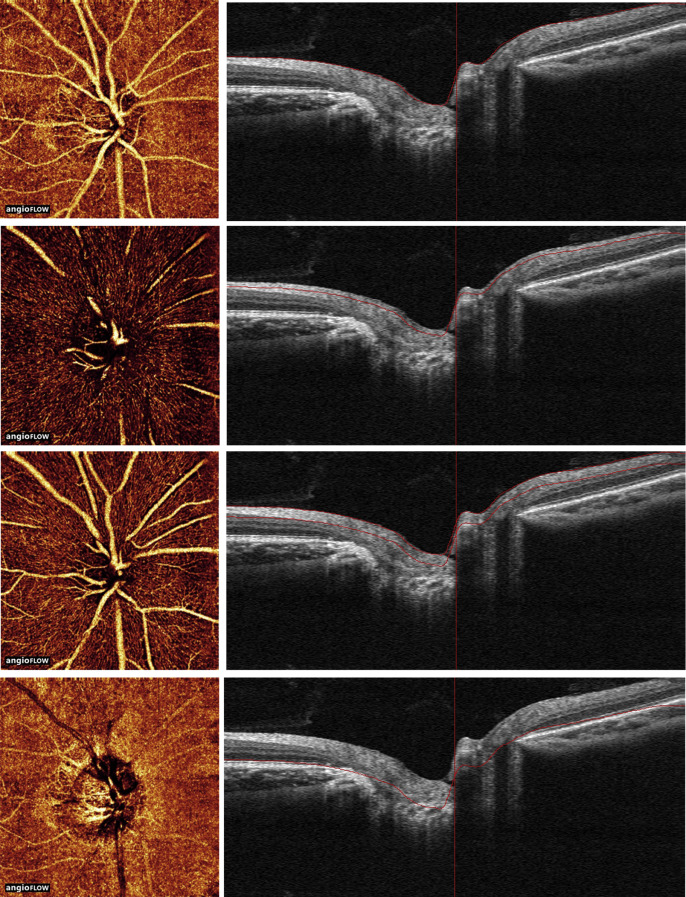
OCT angiography was performed using the RTVue XR Avanti device (ReVue software, version 2014.2.0.93; Optovue Inc, Fremont, California, USA) with the Angio Retina mode (3 × 3 mm) and the Angio Disc (4.5 × 4.5 mm) mode. The technique of OCT angiography including the SSADA method has been described in detail recently ( Figures 1 and 2 ). For the macular region (3 × 3mm), the software automatically segmented the tissue into 4 layers, 3 of which were used for the measurement. Two references were defined and were set as the references of zero: the interface reference was defined as the interface of the posterior vitreous and inner limiting membrane, and the retinal pigment epithelium (RPE) reference was the RPE layer. The superficial retinal layer extended from the inner limiting membrane with an offset (from the interface reference) of 3 μm to the inner plexiform layer with an offset (from the interface reference) of 15 μm; the middle retinal layer from the inner plexiform layer with an offset (from the interface reference) of 15 μm to the outer plexiform layer with an offset (from the interface reference) of 70 μm; and the choriocapillaris layer from the RPE with an offset (from the RPE reference) of 30 μm to the deeper choroidal layer with an offset (from the RPE reference) of 60 μm. All offsets were directed toward the sclera. The segmentations of all examinations were checked before any measurement was performed. Although the recommendation by the company was to consider a signal strength index of ≥30 as acceptable with respect to the quality of the images, we took a cutoff value of signal strength index of ≥40 as inclusion criterion for our study. None of the examined individuals was excluded from the study owing to a low quality of the OCT images or OCT angiographic artifacts.
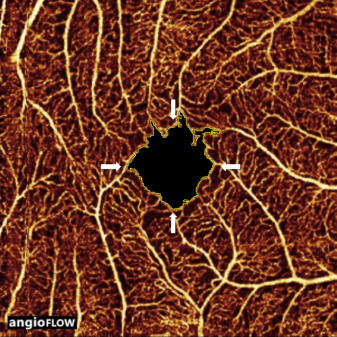
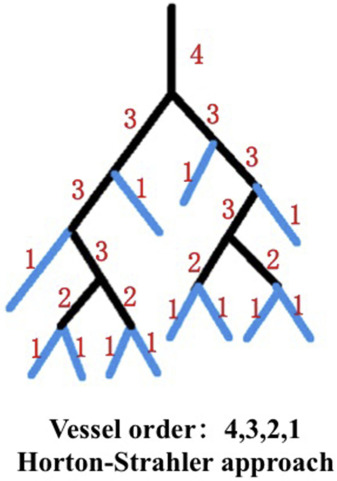
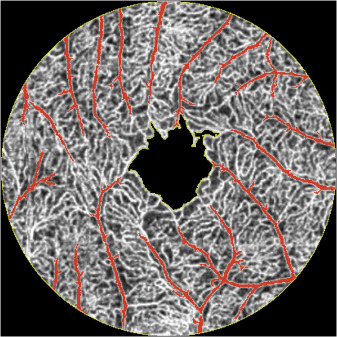
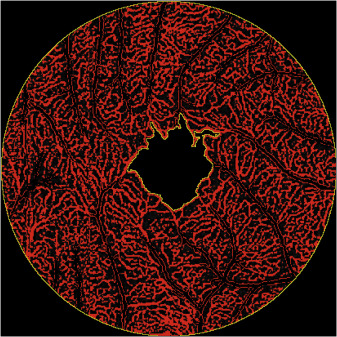
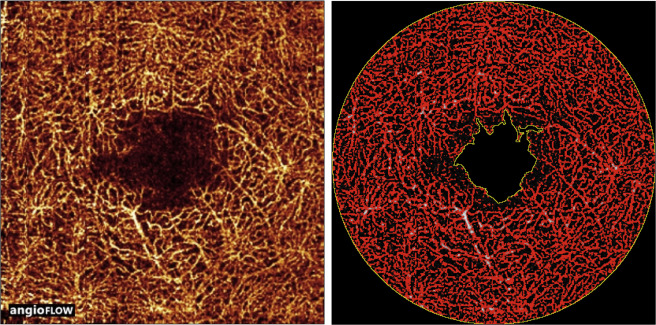
Using ImageJ software (National Institutes of Health; http://imagej.nih.gov/ij/ ) and Adobe Photoshop CS6 (Adobe Photoshop CS6 for Mac, version 13.0.0.0; Adobe Systems Inc, San Jose, California, USA), we measured the area of the FAZ, as well as the density of the superficial retinal small vessels, the density of the superficial retinal capillaries, the deep retinal capillary density, the choriocapillaris vessel diameter and density, and the radial peripapillary capillary density. For the measurement of the FAZ area, a 3 × 3-mm large, en face image of the superficial retinal layer containing the FAZ was selected and cropped ( Figures 3 and 4 ). The FAZ was manually outlined and measured by 2 examiners (S.Y.C., Q.W.) using the ImageJ software with the Wand (tolerance 15) and Paintbrush tool. The mean brightness of the central FAZ area was measured, and this brightness value was taken as the threshold for the examination of the superficial and deep retinal layers and of the peripapillary capillaries. Any brightness value larger than the threshold was taken as vessels. For the assessment of the choriocapillaris, we used a lower brightness threshold, which was the mean pixel brightness + 1 standard deviation of the 1 mm to 3 mm annular area of the superficial layer, in order to delete artifacts caused by larger vessels (which had a higher brightness). The software automatically calculated the total number of pixels within the outlined FAZ and converted the values into square millimeters. For the measurement of the superficial retinal small vascular density, an area between the outline of FAZ and the circle of a diameter of 3 mm was defined. The vessels in this area (ie, the superficial retinal small vessels and the superficial capillary network) were divided into small vessels and into capillaries according to the Horton-Strahler scheme. The procedure started at the capillary level and proceeded centripetally ( Figure 5 ). The number of the order was increased if 2 segments of equal order joined at a bifurcation. We defined class 1 vessels as capillary, and vessels of class 2 or higher as small vessels. According to this vascular grading method, all small vessel pixels within this area were manually selected by 2 examiners (S.Y.C., Q.W.) using Photoshop CS6 software (version 13.0.6 x64, Adobe Systems Inc) with the Magic Wand tool (tolerance 70). The procedure took about 10 minutes per eye. The pixel area was automatically calculated by the ImageJ software. The small vessel density was defined as pixel areas of small vessels divided by the areas between the FAZ and the circle of a diameter of 3 mm ( Figure 6 ). For the measurement of the superficial retinal capillary density, the pixels of the small retinal vessels were dropped from the whole image. By applying the threshold function, the pixel area of the superficial retinal capillaries was then calculated by the ImageJ software. Superficial retinal capillary density was defined as pixel areas of superficial retinal capillaries divided by the total area between the FAZ and the circle of diameter of 3 mm ( Figure 7 ). For the assessment of the deep retinal capillary density, the middle retinal layer of the OCT angiogram was examined in the same region as was examined for the measurement of the superficial retinal capillary density. By processing the threshold function of the ImageJ software, the pixels representing the retinal vessels at the middle retinal layer were selected and their total area was automatically calculated by the ImageJ software. Deep retinal capillary density was defined as the total pixel areas of the retinal vessels in the middle retinal layer of the OCT angiogram divided by the total area between the FAZ and the circle of a diameter of 3 mm ( Figure 8 ).
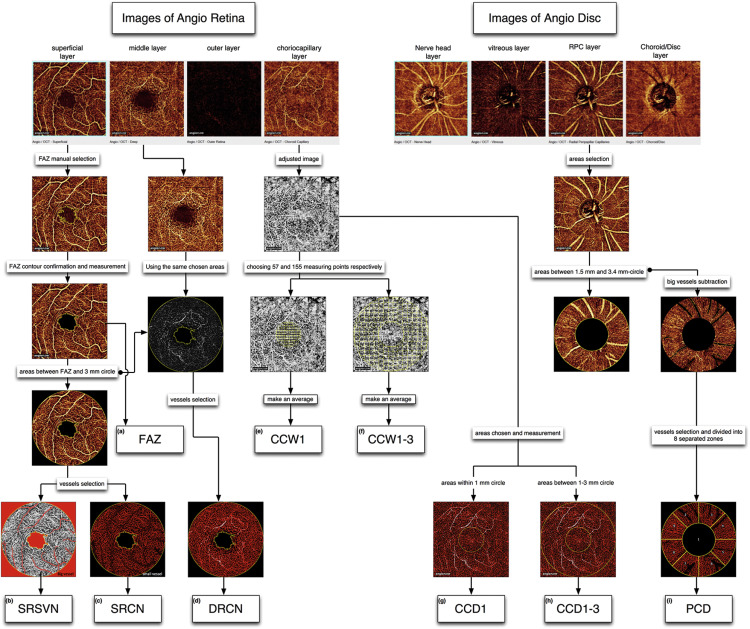
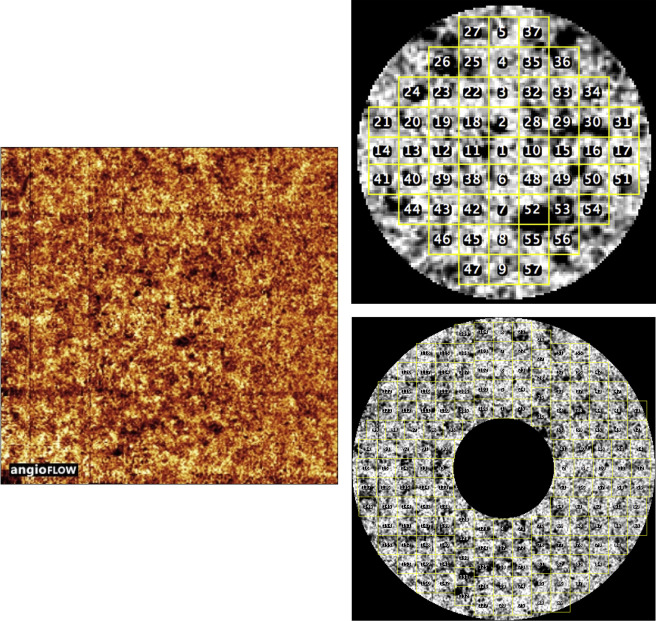
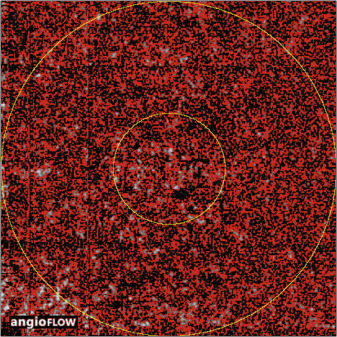
For the measurement of the mean width of the choriocapillaris vessels, the same area was examined as for the assessment of the superficial and deep retinal vascular layer. The image was cropped using a multiple-step approach: A 1-mm-diameter central circle and a 3-mm-diameter circle without the inner central 1-mm circle with both circles centered onto the foveola were marked on the image ( Figure 9 ). To manually measure the choriocapillaris vessel diameters, we chose 57 areas distributed within the 1-mm-diameter circle and another 155 areas located in the ring-like region. In a trial-and-error procedure, we empirically arrived at these numbers as the optimal number of measurement areas because 57 measurement areas in the central region and 155 measurement areas in the surrounding annulus covered almost the whole region. With a lower number of measurement areas, one would not have covered the whole region, and a higher number of measurements areas would have increased the examination time. The mean values of the 57 measurements and of the 155 measurements were then calculated to represent the mean choriocapillaris vessel diameter in the central 1-mm-diameter circle region and the choriocapillaris vessel diameter in the ring-like region ( Figure 9 ). In the same regions, we assessed the choriocapillaris density. Pixels considered to be choriocapillaris vessels were selected using the threshold function of the ImageJ software. The density of the choriocapillaris was calculated as the ratio of the pixel areas of the choriocapillaris vessels divided by the total area of the regions ( Figure 10 ).
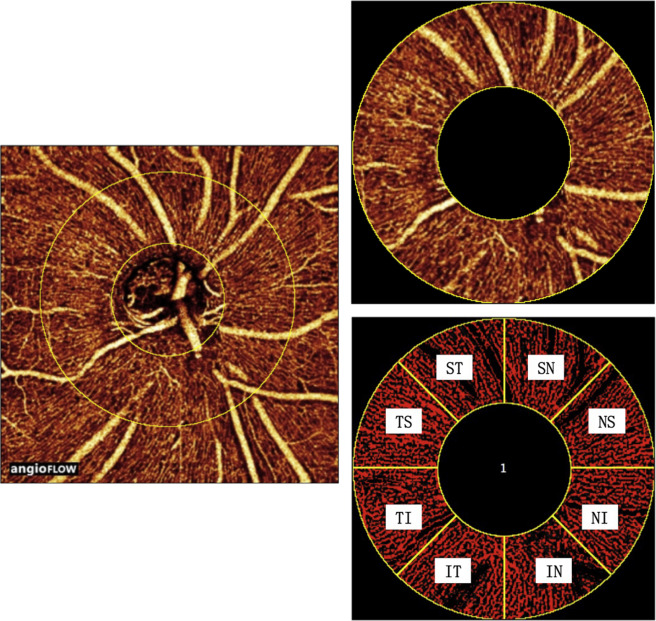
For the measurement of the peripapillary capillary density, a 4.5 × 4.5-mm large, en face image of the radial peripapillary capillary layer was selected and cropped. Two concentric circles with a diameter of 1.5 mm and 3.4 mm and which were centered on the optic disc were manually marked on the angiogram. The pixels that were considered to be peripapillary big vessels in the ring-like region between the 2 concentric circles were manually subtracted using Photoshop CS6 software (Adobe Systems Incorporated, version 13.0.6 x64). The region between the 2 concentric circles was equally divided into 8 zones. Pixels that were considered as peripapillary capillaries were selected using the threshold function and were then automatically calculated by the ImageJ software. The density of the peripapillary capillary was calculated as the ratio of the areas of the pixels representing the vessels divided by the total area of the circle and ring, respectively ( Figure 11 ).
Statistical analysis was performed using a commercially available statistical software program (SPSS for Mac, version 22; IBM/SPSS, Chicago, Illinois, USA). Only 1 eye per study participant was included in the study. We first calculated the means and standard deviations of the main outcome parameters. In a second step of the analysis, we performed univariate analyses of potential associations between the angiographic parameters and other ocular and general parameters. In a third step, we carried out a multivariate analysis, with the angiographic parameters as dependent variable and with all those parameters that were associated with the angiographic parameters in the univariate analysis as independent variables, taking a P value of ≤.10 as the cutoff value. We then dropped from the list of independent parameters, step by step, those parameters that either showed a high collinearity or were no longer significantly associated with the angiographic parameters. All P values were 2-sided and were considered statistically significant when the values were less than .05. We calculated the standardized regression coefficient beta, the nonstandardized regression coefficient B, and its 95% confidence interval (CI).
To assess the intraobserver and interobserver agreement, we randomly selected the images of 50 eyes of healthy participants. For the determination of the intraobserver variability, each parameter was assessed 3 times from the same layer by each examiner, and the intraclass correlation coefficient (ICC) and coefficient of variation were calculated. The re-examinations took place in intervals of 1–2 weeks. For the determination of the interobserver variability, the parameter was assessed once by both examiners, and we calculated Lin’s concordance correlation coefficient and the Bland-Altman plot.
Results
The study included 105 eyes of 105 participants (39 men) with a mean age of 35.9 ± 13.8 years (median: 30.0 years; range: 17–64 years), a mean refractive error (spherical equivalent) of −1.29 ± 2.56 diopters (median:−0.25 diopters; range: −7.75 to 2.50 diopters), and a mean axial length of 23.80 ± 1.44 mm (median: 23.44 mm; range: 21.44–28.16 mm). Mean anterior chamber depth was 2.86 ± 0.38 mm (median: 2.83 mm; range: 2.01–3.68 mm), and mean lens thickness was 3.97 ± 0.44 mm (median: 3.90 mm; range: 3.22–5.17 mm). The mean subfoveal choroidal thickness was 343 ± 112 μm (median: 320 μm; range: 104–642 μm), mean arterial oxygen saturation was 92.3% ± 6.7% (median, 92.8%; range: 72.9%–106.6%), and mean venous oxygen saturation was 53.3% ± 6.9% (median: 53.8%; range: 27.2%–68.1%).
The mean area of the FAZ as measured in the superficial retinal vascular layer was 0.35 ± 0.12 mm 2 . The density of the superficial retinal small vessel network measured 8.54% ± 0.92%, the density in the superficial retinal capillary network was 31.8% ± 2.6%, the density of the deep retinal capillary network measured 45.8% ± 3.3%, and respective width and density of the choriocapillaris in the central zone was 22.1 ± 0.7 μm and 44.4% ± 3.3%, and in the pericentral region was 22.5 ± 0.7 μm and 44.5% ± 2.7% ( Table 1 ).
| Parameter | Mean ± Standard Deviation | Median | Minimum | Maximum |
|---|---|---|---|---|
| Foveal avascular zone (mm 2 ) | 0.35 ± 0.12 | 0.34 | 0.11 | 0.77 |
| Vascular density superficial retinal small vessel network (%) | 8.54 ± 0.92 | 8.33 | 6.53 | 11.7 |
| Vascular density superficial retinal capillary network (%) | 31.8 ± 2.6 | 32.4 | 23.5 | 37.3 |
| Vascular density deep retinal capillary network (%) | 45.8 ± 3.3 | 46.4 | 35.3 | 52.1 |
| Choriocapillaris vessel width CCW1 (μm) | 22.1 ± 0.7 | 22.1 | 20.0 | 24.4 |
| Choriocapillaris vessel width CCW1-3 (μm) | 22.5 ± 0.7 | 22.5 | 20.8 | 24.5 |
| Choriocapillaris vessel density CCD1 (%) | 44.5 ± 3.3 | 44.9 | 29.3 | 52.2 |
| Choriocapillaris vessel density CCD1-3 (%) | 44.5 ± 2.7 | 44.8 | 36.3 | 49.9 |
| Vascular density radial peripapillary capillary network superior temporal (%) | 32.4 ± 4.1 | 31.6 | 22.0 | 42.8 |
| Vascular density radial peripapillary capillary network superior nasal (%) | 32.0 ± 4.8 | 31.9 | 19.7 | 44.4 |
| Vascular density radial peripapillary capillary network nasal upper (%) | 33.7 ± 4.9 | 33.9 | 16.2 | 45.8 |
| Vascular density radial peripapillary capillary network nasal lower (%) | 36.9 ± 5.4 | 36.8 | 18.8 | 50.8 |
| Vascular density radial peripapillary capillary network inferior nasal (%) | 32.4 ± 4.6 | 32.6 | 21.7 | 43.2 |
| Vascular density radial peripapillary capillary network inferior temporal (%) | 37.2 ± 4.8 | 37.0 | 25.2 | 47.1 |
| Vascular density radial peripapillary capillary network temporal lower (%) | 41.8 ± 3.9 | 42.2 | 30.6 | 50.4 |
| Vascular density radial peripapillary capillary network temporal upper (%) | 43.9 ± 4.1 | 44.0 | 25.0 | 51.3 |
Stay updated, free articles. Join our Telegram channel

Full access? Get Clinical Tree


