Purpose
To evaluate the intraocular pressure (IOP)-lowering efficacy and safety of ophthalmic formulations of bimatoprost 0.01% and 0.0125% compared with bimatoprost 0.03%.
Design
Prospective, randomized, double-masked, multicenter clinical trial.
Methods
Patients with glaucoma or ocular hypertension were randomized to receive once-daily bimatoprost 0.01% (n = 186), bimatoprost 0.0125% (n = 188), or bimatoprost 0.03% (n = 187) for 12 months. The primary efficacy measure was IOP. Safety measures included adverse events and an objective assessment of conjunctival hyperemia.
Results
Baseline mean IOPs were similar among treatment groups. Differences in mean IOP between the bimatoprost 0.01% or 0.0125% groups and the bimatoprost 0.03% group were less than 0.9 mm Hg throughout follow-up. Bimatoprost 0.01%, but not bimatoprost 0.0125%, was equivalent in efficacy to bimatoprost 0.03% based on predetermined criteria (limits of the 95% confidence interval of the between-group difference in mean IOP within ± 1.5 mm Hg at all time points and within ± 1 mm Hg at most time points). The overall incidence of treatment-related adverse events was reduced significantly in the bimatoprost 0.01% and bimatoprost 0.0125% groups compared with the bimatoprost 0.03% group ( P ≤ .034). The percentage of patients with a moderate to severe increase from the baseline macroscopic hyperemia score was: bimatoprost 0.01%, 3.2%; bimatoprost 0.0125%, 9.0%; bimatoprost 0.03%, 9.1% ( P = .019 for bimatoprost 0.01% vs 0.03%).
Conclusions
Bimatoprost 0.01% was equivalent to bimatoprost 0.03% in lowering IOP throughout 12 months of treatment and demonstrated improved tolerability, including less frequent and severe conjunctival hyperemia. Bimatoprost 0.01% demonstrated a better benefit-to-risk ratio than bimatoprost 0.0125%.
Bimatoprost is a prostamide that potently lowers intraocular pressure (IOP). Since the introduction of bimatoprost 0.03% ophthalmic solution (Lumigan; Allergan, Inc, Irvine, California, USA) in 2001, once-daily bimatoprost 0.03% has been demonstrated to be safe and effective in lowering IOP over the long term in glaucoma and ocular hypertension (OHT). Evidence suggests that bimatoprost reduces IOP more effectively than any other single medication available for glaucoma management. In its pivotal trials for regulatory drug approval, once-daily bimatoprost 0.03% reduced IOP by 2 to 3 mm Hg more than twice-daily timolol, and in head-to-head comparison studies, bimatoprost provided larger mean IOP reductions than the other once-daily prostaglandin analogs, latanoprost and travoprost. Bimatoprost also has been shown to be effective in multiple-drug therapy with other classes of ocular hypotensive medications, including timolol.
All of the prostaglandin analogs for the most part are well tolerated. Side effects typically associated with treatment include conjunctival hyperemia, increased eyelash length, increased iris pigmentation, and increased periocular skin pigmentation. The most common side effect is conjunctival hyperemia, which in some cases can lead to noncompliance or discontinuation of treatment.
Bimatoprost 0.01% is a new formulation that was developed with the goal of creating a formulation of bimatoprost that would maintain the IOP-lowering efficacy achieved with bimatoprost 0.03% and have an improved overall safety profile, particularly improved ocular surface tolerability. The strategy was to reduce the concentration of bimatoprost and increase the concentration of benzalkonium chloride (BAK), a commonly used preservative that also can increase the corneal penetration and intraocular bioavailability of topically applied medication. In a phase 2 clinical study (Allergan Study 192024-030), 4 investigational test formulations (bimatoprost 0.01%, bimatoprost 0.015% with edetate, bimatoprost 0.015%, and bimatoprost 0.02%) were compared with bimatoprost 0.03% in patients with glaucoma or OHT. The study was a 5-day, multicenter, double-masked, active-controlled, paired-eye comparison. The results suggested that bimatoprost 0.01% may have efficacy similar to that of bimatoprost 0.03% and may be associated with less ocular irritation and hyperemia, and further suggested that the dose-response curve for tolerability of bimatoprost is steep within this range of bimatoprost concentrations, such that a slight reduction in bimatoprost concentration from 0.015% may lead to significantly improved tolerability. These results led to the selection of bimatoprost 0.01% and another test formulation, bimatoprost 0.0125%, for further study.
The purpose of this study was to evaluate the IOP-lowering efficacy and safety of bimatoprost 0.01% and bimatoprost 0.0125% compared with bimatoprost 0.03% in patients with glaucoma or OHT. This report focuses on results for bimatoprost 0.01% and bimatoprost 0.03% because these are the marketed formulations.
Methods
Study Design
This prospective, randomized, multicenter (32 sites in the United States), double-masked, parallel-group, phase 3 study compared bimatoprost 0.01%, bimatoprost 0.0125%, and bimatoprost 0.03% in patients with glaucoma or OHT. The investigators and sites that took part in the study are listed in the Acknowledgments. The study was conducted in accordance with applicable Good Clinical Practice regulations and guidelines.
Study Population
Eligible patients were at least 18 years of age with a diagnosis of OHT, primary open-angle glaucoma, chronic angle-closure glaucoma with patent iridotomy or iridectomy, pseudoexfoliative glaucoma, or pigmentary glaucoma in each eye. Patients were required to have an 8 am baseline IOP of 22 to 34 mm Hg or less in each eye with asymmetry between eyes of no more than 5 mm Hg after washout of previous IOP-lowering medications. Best-corrected visual acuity equivalent to a Snellen score of 20/100 or better in each eye also was required for study entry.
Patients with functionally significant or progressive visual field loss during the previous year; laser, intraocular, or filtering surgery within the past 3 months; refractive surgery at any time; or conditions that would interfere with study measurements or interpretation of study data were excluded from the study. Other exclusion criteria included: clinically significant ocular surface findings at baseline such as mild or greater hyperemia or irritation; uncontrolled systemic disease; anticipated use of contact lenses during the study; intermittent use of systemic corticosteroids within the 21 days before any study visit; anticipated use of topical ophthalmic corticosteroids during the study; chronic use of ocular medications other than the study medications (intermittent use of artificial tears and antihistamines was allowed, but not within 24 hours or 2 weeks of a scheduled visit, respectively); ocular seasonal allergy within the past 2 years; recent or anticipated alteration of existing chronic systemic treatment that could affect IOP, study medications, or study outcomes; any condition or situation of the patient which, in the investigator’s opinion, could put the patient at a significant risk, could confound study results, or could interfere significantly with the patient’s participation in the study; history of inadequate IOP control while receiving bimatoprost monotherapy; and allergy or hypersensitivity to bimatoprost or any component of the study medications. Patients who were pregnant or nursing or who could become pregnant also were excluded from the study.
At a screening visit, patients using ocular hypotensive medications began a washout period of 4 days for parasympathomimetics and carbonic anhydrase inhibitors, 2 weeks for sympathomimetics and α-agonists, 4 weeks for β-adrenergic antagonists and the fixed combination of timolol and dorzolamide, and 6 weeks for prostaglandin analogs.
Patient Randomization and Study Treatment
At baseline (day 0), at least 2 days after the screening visit, patients who met all eligibility criteria were stratified into 6 groups based on IOP (≤ 25 mm Hg or > 25 mm Hg) and central corneal thickness (< 555 μm, 555 to 600 μm, or > 600 μm) averaged from both eyes. Patients within each stratum were randomized using a computer-generated randomization schedule in a 1:1:1 ratio to treatment with an ophthalmic formulation of bimatoprost 0.01%, bimatoprost 0.0125%, or bimatoprost 0.03% (Lumigan 0.03%; Allergan, Inc, Irvine, California, USA) for 12 months. The formulations were physically indistinguishable and differed only in the concentration of bimatoprost (0.01%, 0.0125%, and 0.03%) and BAK (0.02% in bimatoprost 0.01% and bimatoprost 0.0125% and 0.005% in bimatoprost 0.03%).
Medications were supplied in identical masked bottles. Patients were instructed to instill study medication (1 drop in each eye) each evening between 7 pm and 9 pm for the duration of the study. The first dose of study medication was instilled on day 0 after all baseline diurnal IOP measurements were completed. Follow-up visits were scheduled at weeks 2 and 6 and months 3, 6, 9, and 12.
Outcome Measures
The primary efficacy outcome measures were mean IOP and mean change from baseline IOP at each follow-up time point. Secondary efficacy measures included diurnal IOP and response rate (percentage of patients achieving at least a 20% decrease from baseline IOP). Intraocular pressure was measured using a calibrated Goldmann applanation tonometer and a 2-person reading method at 8 am , 12 pm , and 4 pm on all study visits except month 9, when IOP was measured at 8 am and 12 pm only. IOP was measured at least twice in each eye, and if the difference between the first and second reading was more than 2 mm Hg, a third reading was obtained. IOP for each eye was determined as the mean of 2 readings or the median of 3 readings. Diurnal IOP was defined as the mean of the IOP at all time points at a particular visit.
Safety measures evaluated at each study visit included adverse events, macroscopic hyperemia evaluated by gross inspection in comparison with standard photographs, biomicroscopy, visual acuity, pulse rate, and blood pressure. Other safety measures included iris pigmentation evaluated using photographs obtained at baseline and months 3, 6, and 12; ophthalmoscopy performed at screening and months 3, 6, and 12; and visual field examinations performed at baseline and months 3, 6, and 12. Adverse events were classified using Medical Dictionary for Regulatory Activities (MedDRA) nomenclature. An adverse event was determined to be treatment related if a reasonable probability existed that it might have been caused by treatment. Macroscopic hyperemia, biomicroscopic findings, and ophthalmoscopic findings were rated on a 5-point scale (0 = none, 0.5 = trace, 1 = mild, 2 = moderate, 3 = severe). Conjunctival hyperemia grades were based on comparisons with standard photographs using the Allergan bulbar hyperemia grading guide.
The acceptability of treatment was determined using a questionnaire administered at the 3-month, 6-month, and 12-month visits. Patients were asked whether they would be willing to continue on the study medication, and physicians were asked whether they would be willing to continue each patient on the study medication. The responses were given on a 4-point scale of 0 = not willing, 1 = somewhat willing, 2 = very willing, and 3 = extremely willing. Physicians who were not willing to continue administering the study medication to a patient were asked to give their reason, choosing 1 or more answers among possible responses of (1) IOP not low enough, (2) redness of 1 or both eyes, (3) eyelash growth, (4) iris color changes, (5) eyelid skin area (periorbital) darkening, (6) patient quality of life, and (7) other.
Statistical Analyses
Statistical analyses were performed using SAS software version 9.1 (SAS Institute, Inc, Cary, North Carolina, USA) and a 2-sided α level of 0.05. Nominal variables were analyzed using the Fisher exact test or Pearson chi-square test. Patient discontinuations over time were compared between groups using the log-rank test. Ordinal variables were analyzed using Kruskal-Wallis and Wilcoxon rank-sum tests. Continuous variables other than IOP were analyzed using an analysis of variance (ANOVA) with a fixed effect of treatment followed by 2-sample t tests.
IOP was analyzed for the intent-to-treat (ITT) study population including all randomized patients using last observation carried forward for missing data. Analysis of both the intent-to-treat patient population and the per-protocol patient population is important in noninferiority and equivalence studies, and thus a secondary analysis evaluated IOP for the per-protocol study population (all patients with no major protocol violation) using observed values from visits without protocol violations. This analysis was used as a sensitivity analysis to confirm the results of the ITT analysis. The average of the IOPs or the changes in IOP from both eyes of the patient was used in the analyses. Safety parameters were analyzed for all patients who received study medication.
The 2 primary treatment comparisons were bimatoprost 0.01% versus bimatoprost 0.03% and bimatoprost 0.0125% versus bimatoprost 0.03%. Mean IOP and mean change from baseline IOP each were analyzed using an analysis of variance model with a fixed effect of treatment. Confidence intervals (CIs) were created using contrasts from the model. Equivalence in IOP-lowering efficacy was claimed if the limits of the 95% CIs (or 97.5% CIs, when adjustment for multiplicity was required) of the between-group differences in mean IOP were within ± 1.5 mm Hg at all time points, and the limits of the 95% CIs were within ± 1.0 mm Hg at most time points. The Hochberg procedure was used to correct for multiplicity of analyses: if either bimatoprost 0.01% or 0.0125% was not equivalent to bimatoprost at a particular time point based on the 95% CI, then the determination of equivalency of the other formulation to bimatoprost 0.03% was based on the 97.5% CI.
A sample size of 158 patients in each treatment group was expected to give 93% power for the equivalence test of IOP-lowering efficacy at an individual time point using an α level of 0.025, an estimated standard deviation of 3.27 mm Hg, and procedure MTE1GT in the commercial software nQuery Advisor version 5.0 (Statistical Solutions, Saugus, Massachusetts, USA). Based on an anticipated attrition rate of 15%, 558 patients were to be enrolled.
Results
Patient Characteristics and Disposition
A total of 561 patients were enrolled in the 3 study groups. Patient demographics and clinical characteristics at baseline generally were similar among the treatment groups ( Table 1 ). Patients ranged in age from 23 to 94 years (mean, 63.5 years). Approximately 73% of the patients were white, 14% were black, 57% were female, and 72% required washout of previous ocular hypotensive medication, most commonly a prostaglandin (36%) or bimatoprost (15%). Slightly more than half of the patients (53%) were diagnosed with glaucoma in 1 or both eyes. The only statistically significant difference among treatment groups was in age. The mean age of patients was slightly lower in the bimatoprost 0.01% group (61.6 years) than in the bimatoprost 0.0125% and 0.03% groups (64.7 years and 64.2 years, respectively; P ≤ .026), but this difference is unlikely to be clinically relevant.
| Characteristics | Bimatoprost 0.01% (n = 186) | Bimatoprost 0.0125% (n = 188) | Bimatoprost 0.03% (n = 187) | Among-Group P Value |
|---|---|---|---|---|
| Age (yrs) | .019 | |||
| Mean (SD) | 61.6 (11.7) a,b | 64.7 (10.9) | 64.2 (11.6) | |
| Sex, n (%) | .190 | |||
| Male | 79 (42.5%) | 72 (38.3%) | 89 (47.6%) | |
| Female | 107 (57.5%) | 116 (61.7%) | 98 (52.4%) | |
| Race or ethnicity, n (%) | .734 c | |||
| White | 130 (69.9%) | 141 (75.0%) | 138 (73.8%) | |
| Black | 28 (15.1%) | 25 (13.3%) | 23 (12.3%) | |
| Hispanic | 25 (13.4%) | 17 (9.0%) | 23 (12.3%) | |
| Other | 3 (1.6%) | 5 (2.7%) | 3 (1.6%) | |
| Iris color, n (%) | .732 d | |||
| Brown | 77 (41.4%) | 69 (36.7%) | 77 (41.2%) | |
| Dark brown | 19 (10.2%) | 23 (12.2%) | 12 (6.4%) | |
| Blue | 40 (21.5%) | 49 (26.1%) | 56 (29.9%) | |
| Hazel | 27 (14.5%) | 20 (10.6%) | 23 (12.3%) | |
| Green | 6 (3.2%) | 4 (2.1%) | 5 (2.7%) | |
| Blue/gray | 5 (2.7%) | 11 (5.9%) | 8 (4.3%) | |
| Blue/gray-brown | 4 (2.2%) | 7 (3.7%) | 2 (1.1%) | |
| Green-brown | 4 (2.2%) | 1 (0.5%) | 3 (1.6%) | |
| Other | 4 (2.2%) | 4 (2.1%) | 1 (0.5%) | |
| Diagnosis, n (%) | .314 | |||
| Glaucoma | 94 (50.5%) | 102 (54.3%) | 94 (50.3%) | |
| Ocular hypertension | 91 (48.9%) | 84 (44.7%) | 87 (46.5%) | |
| One eye each | 1 (0.5%) | 2 (1.1%) | 6 (3.2%) | |
| Washout medication, n (%) e | NA | |||
| No | 47 (25.3%) | 53 (28.2%) | 55 (29.4%) | |
| Yes | 139 (74.7%) | 135 (71.8%) | 132 (70.6%) | |
| Prostamide (bimatoprost) | 32 (17.2%) | 23 (12.2%) | 28 (15.0%) | |
| Prostaglandin | 71 (38.2%) | 66 (35.1%) | 67 (35.8%) | |
| α-agonist | 21 (11.3%) | 19 (10.1%) | 17 (9.1%) | |
| β-blocker | 16 (8.6%) | 19 (10.1%) | 20 (10.7%) | |
| Carbonic anhydrase inhibitor | 16 (8.6%) | 26 (13.8%) | 22 (11.8%) | |
| Fixed-combination dorzolamide/timolol | 0 (0.9%) | 3 (1.6%) | 2 (1.1%) | |
| Parasympathomimetic | 1 (0.5%) | 0 (0.0%) | 0 (0.0%) | |
| Other | 3 (1.6%) | 5 (2.7%) | 5 (2.7%) | |
| Central corneal thickness (μm) | .904 | |||
| Mean (SD) | 559.6 (34.5) | 560.3 (38.7) | 561.3 (35.6) |
a P = .009 for bimatoprost 0.01% vs bimatoprost 0.0125%.
b P = .026 for bimatoprost 0.01% vs bimatoprost 0.03%.
c P value for black vs nonblack.
d P value for dark (brown or dark brown) vs light (all other colors).
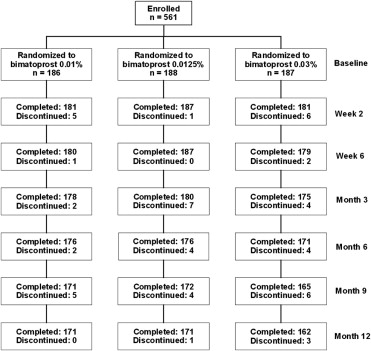
Patient flow through the study is shown in Figure 1 . The 12-month study was completed by 91.9%, 91.0%, and 86.6% of patients in the bimatoprost 0.01%, 0.0125%, and 0.03% groups, respectively ( Table 2 ). The most common reasons for early discontinuation from the study were ocular adverse events and loss to follow-up.
| Bimatoprost 0.01% | Bimatoprost 0.0125% | Bimatoprost 0.03% | |
|---|---|---|---|
| Enrolled | 186 | 188 | 187 |
| Completed month 12 visit | 171 (91.9%) | 171 (91.0%) | 162 (86.6%) |
| Discontinued | 15 (8.1%) | 17 (9.0%) | 25 (13.4%) |
| Reason for discontinuation | |||
| Adverse event a | 8 (4.3%) | 8 (4.3%) | 14 (7.5%) |
| Ocular | 4 (2.2%) | 6 (3.2%) | 12 (6.4%) |
| Nonocular | 5 (2.7%) | 2 (1.1%) | 3 (1.6%) |
| Lost to follow-up | 2 (1.1%) | 5 (2.7%) | 4 (2.1%) |
| Intraocular pressure | 2 (1.1%) | 2 (1.1%) | 0 (0.0%) |
| Protocol violation | 0 (0.0%) | 1 (0.5%) | 3 (1.6%) |
| Personal reasons | 1 (0.5%) | 1 (0.5%) | 1 (0.5%) |
| Other b | 2 (1.1%) | 0 (0.0%) | 3 (1.6%) |
a Adverse event not necessarily related to treatment. Patient could be counted as discontinuing because of both an ocular and nonocular adverse event.
b Includes screening failure and patient moving out of state in the bimatoprost 0.01% group and withdrawal of consent (2 patients) and patient moving out of state in the bimatoprost 0.03% group.
Efficacy Analyses
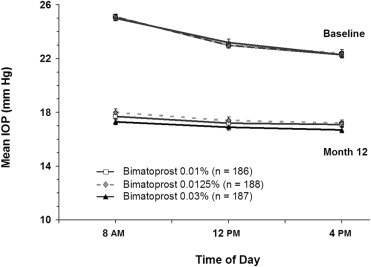
There were no statistically significant differences in baseline mean IOPs between the treatment groups ( Table 3 ). The baseline mean IOP at 8 am , 12 pm , and 4 pm , respectively, was 25.1 mm Hg, 23.0 mm Hg, and 22.3 mm Hg in the bimatoprost 0.01% group; 25.1 mm Hg, 23.0 mm Hg, and 22.4 mm Hg in the bimatoprost 0.0125% group; and 25.0 mm Hg, 23.2 mm Hg, and 22.3 mm Hg in the bimatoprost 0.03% group. Differences in baseline mean IOP between the bimatoprost 0.01% or 0.0125% groups and the bimatoprost 0.03% group were less than 0.3 mm Hg at each hour.
| Visit | Time | Bimatoprost 0.01% (n = 186) | Bimatoprost 0.0125% (n = 188) | Bimatoprost 0.03% (n = 187) | Difference: Bimatoprost 0.01% − Bimatoprost 0.03% (95% CI) [97.5% CI] a | Difference: Bimatoprost 0.0125% − Bimatoprost 0.03% (95% CI) [97.5% CI] a |
|---|---|---|---|---|---|---|
| Baseline | 8 am | 25.1 (2.9) | 25.1 (3.0) | 25.0 (2.6) | 0.14 (–0.43 to 0.71) | 0.09 (–0.48 to 0.66) |
| 12 pm | 23.0 (3.2) | 23.0 (3.3) | 23.2 (3.3) | –0.23 (–0.89 to 0.43) | –0.18 (–0.85 to 0.48) | |
| 4 pm | 22.3 (3.6) | 22.4 (3.8) | 22.3 (3.2) | 0.04 (–0.68 to 0.76) | 0.09 (–0.62 to 0.81) | |
| Week 2 | 8 am | 17.8 (3.1) | 17.7 (3.7) | 17.3 (2.9) | 0.56 (–0.10 to 1.22) | 0.44 (–0.22 to 1.10) |
| 12 pm | 17.1 (3.0) | 17.1 (3.3) | 16.3 (2.9) | 0.84 (0.21 to 1.46) | 0.86 (0.23 to 1.48) | |
| 4 pm | 16.9 (2.9) | 16.9 (3.3) | 16.2 (3.0) | 0.73 (0.10 to 1.35) | 0.67 (0.05 to 1.29) | |
| Week 6 | 8 am | 17.6 (3.0) | 17.8 (3.2) | 17.2 (3.0) | 0.37 (–0.25 to 1.00) | 0.54 (–0.09 to 1.16) |
| 12 pm | 16.8 (3.0) | 16.8 (2.9) | 16.5 (3.0) | 0.29 (–0.31 to 0.89) | 0.37 (–0.23 to 0.97) | |
| 4 pm | 16.7 (2.8) | 16.8 (3.1) | 16.4 (2.9) | 0.23 (–0.37 to 0.82) | 0.32 (–0.28 to 0.91) | |
| Month 3 | 8 am | 17.3 (3.2) | 17.6 (3.3) | 17.0 (2.9) | 0.33 (–0.31 to 0.97) | 0.55 (–0.09 to 1.18) |
| 12 pm | 16.7 (2.9) | 16.6 (3.1) | 16.1 (2.9) | 0.55 (–0.05 to 1.16) | 0.52 (–0.08 to 1.13) | |
| 4 pm | 16.4 (2.8) | 16.6 (2.9) | 16.2 (2.9) | 0.28 (–0.31 to 0.87) | 0.43 (–0.16 to 1.01) | |
| Month 6 | 8 am | 17.7 (3.2) | 18.1 (3.4) | 17.4 (2.9) | 0.39 (–0.25 to 1.03) | 0.73 (0.09 to 1.37) |
| 12 pm | 17.0 (2.9) | 17.2 (3.2) | 16.3 (3.0) | 0.63 (0.01 to 1.25) [–0.08 to 1.34] | 0.89 (0.27 to 1.51) [0.18 to 1.60] | |
| 4 pm | 16.6 (2.7) | 16.9 (3.0) | 16.3 (2.9) | 0.35 (–0.23 to 0.94) | 0.65 (0.07 to 1.23) | |
| Month 9 | 8 am | 17.9 (3.1) | 18.3 (3.3) | 17.8 (3.2) | 0.13 (–0.52 to 0.78) | 0.51 (–0.14 to 1.16) |
| 12 pm | 17.1 (3.0) | 17.3 (3.1) | 16.9 (3.2) | 0.22 (–0.41 to 0.85) | 0.37 (–0.26 to 1.01) | |
| Month 12 | 8 am | 17.7 (3.2) | 18.0 (3.6) | 17.3 (3.0) | 0.41 (–0.26 to 1.07) | 0.70 (0.03 to 1.36) |
| 12 pm | 17.2 (3.3) | 17.4 (3.5) | 16.9 (3.0) | 0.29 (–0.37 to 0.96) | 0.51 (–0.15 to 1.17) | |
| 4 pm | 17.1 (3.0) | 17.2 (3.2) | 16.7 (3.0) | 0.44 (–0.18 to 1.06) | 0.51 (–0.11 to 1.13) |
a The 97.5% CI was used to correct for multiplicity when the limits of the 95% CI of either the bimatoprost 0.01% − bimatoprost 0.03% difference or the bimatoprost 0.0125% − bimatoprost 0.03% difference were not within ± 1.5 mm Hg (Hochberg procedure).
Each of the study formulations provided clinically and statistically significant reductions from baseline IOP at each follow-up time point. The mean reduction from baseline IOP ranged from 5.2 to 7.8 mm Hg with bimatoprost 0.01%, 5.2 to 7.5 mm Hg with bimatoprost 0.0125%, and 5.6 to 8.0 mm Hg with bimatoprost 0.03%. At month 12, the mean reduction (% reduction) from baseline IOP was 7.4 mm Hg (29%) for bimatoprost 0.01% and 7.6 mm Hg (30%) for bimatoprost 0.03% at 8 am , 5.8 mm Hg (25%) for bimatoprost 0.01% and 6.3 mm Hg (27%) for bimatoprost 0.03% at 12 pm , and 5.2 mm Hg (23%) for bimatoprost 0.01% and 5.6 mm Hg (25%) for bimatoprost 0.03% at 4 pm . In the bimatoprost 0.125% group, the mean reduction (percent reduction) from baseline IOP was 7.0 mm Hg (28%) at 8 am , 5.6 mm Hg (24%) at 12 pm , and 5.2 mm Hg (23%) at 4 pm .
Mean IOPs during follow-up ranged from 16.4 to 17.9 mm Hg with bimatoprost 0.01%, 16.6 to 18.3 mm Hg with bimatoprost 0.0125%, and 16.1 to 17.8 mm Hg with bimatoprost 0.03%. Differences in mean IOP between bimatoprost 0.01% or 0.0125% and bimatoprost 0.03% were consistently less than 0.9 mm Hg throughout the 12-month study ( Table 3 ). Occasional statistically significant differences between the 0.01% and 0.03% formulations were observed at the 12 pm time point at week 2 and month 6 and the 4 pm time point at week 2. Statistically significant differences between the 0.0125% and 0.03% formulations were seen at these same time points, as well as at the 8 am time point at months 6 and 12 and the 4 pm time point at month 6. At month 12, differences in mean IOP between bimatoprost 0.01% and bimatoprost 0.03% were less than 0.5 mm Hg at all times of the day, and none of the differences between treatments were statistically significant ( Figure 2 ).