Purpose
To evaluate time trends in the incidence and causes of new cases of blindness in Israel between 1999 and 2008.
Design
Descriptive, retrospective population-based study.
Methods
During the decade of the study, 19 862 inhabitants of Israel were newly registered as legally blind. Data were retrieved from the 1999 to 2008 annual reports of the National Registry of the Blind in Israel and were reviewed retrospectively. Specific rates by age, gender, calendar year, and cause of blindness were calculated. Total and cause-specific annual age-standardized rates were calculated as well. Findings were evaluated by the use of Poisson regression models.
Results
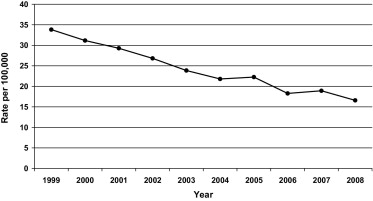
The age-standardized rate of incidence of newly registered legal blindness at the end of the studied decade was half of that at the beginning, declining from 33.8 per 100 000 in 1999 to 16.6 per 100 000 in 2008. The decline mainly was attributable to a decreased incidence of blindness resulting from age-related macular degeneration, glaucoma, diabetic retinopathy, and cataract.
Conclusions
Contemporary interventions in ophthalmology combined with widely available universal free access to healthcare seem to be effective in causing a major reduction in the incidence of blindness.
According to the World Health Organization, in 2002, approximately 161 million people worldwide were visually impaired, of whom approximately 37 million were blind. Because of the aging of the global population, worldwide trends since the early 1990s have shown a significant increase in the number of people at risk of age-related reversible and irreversible visual impairments.
More than 200 population-based studies on the causes of blindness have been carried out in more than 68 countries all over the world. The leading causes of visual impairment, in order of frequency, are: cataract, uncorrected refractive errors, glaucoma, and age-related macular degeneration (AMD). Corneal opacities, diabetic retinopathy, and blinding trachoma are other major causes. In industrialized countries, the main cause of blindness after the age of 74 years is AMD, whereas diabetic retinopathy is the leading cause in those younger than 74 years.
Several methods exist for obtaining epidemiologic data on visual impairment and blindness in large populations. Each of these methods has its strengths and weaknesses. In administrative registries, data are collected as part of the routine operation of some service or program. When disabilities are studied, this method often provides useful information on the characteristics of relevant populations as well as details of the services provided. In many cases, these data are evaluated and reported annually, providing an updated source of information on trends in the incidence, prevalence, and causes of the conditions in question.
Israel is one of the few countries worldwide that maintains nationwide blindness registries, as do England, Germany, Scotland, and Australia. The aim of this study was to evaluate the changes in the incidence and causes of legal blindness in Israel that have occurred during the last decade as recorded by the National Registry of the Blind, which is serviced by the Ministry of Social Affairs.
Methods
Definitions of visual impairment and blindness in Israel are similar to, but not identical with, those in Western Europe, and are in accordance with the International Classification of Diseases. Blindness is defined in Israel as best-corrected visual acuity (BCVA) of less than 1/60 or central visual field not more than 10 degrees in the less impaired eye. Severe visual impairment is defined as visual acuity of less than 3/60 but of 1/60 or better, or a corresponding visual field of less than 20 degrees in the less impaired eye. Legal blindness encompasses both definitions.
A personal Certificate of Blindness is issued by the Israeli Ministry of Social Affairs to all individuals who meet the above definitions of legal blindness. The certification process begins with a complete eye examination by a senior ophthalmologist. It includes visual acuity assessment, a thorough ophthalmologic examination, and a visual field test. Patients who are considered eligible are advised to continue the registration process. The tests are then repeated by one of a select group of senior ophthalmology consultants employed by the Ministry of Welfare National Service for the Blind. If the diagnosis is confirmed, a certificate is issued. Patients denied a certificate have recourse to a national appeal committee comprising 2 senior ophthalmologists and a social worker.
All data (including demographic information, year of registration, results of visual acuity and visual field tests, and cause of blindness) are collected in a national registry, and an annual report is published. The certificate entitles the holder to consultation and rehabilitation services; a guide dog; expanded national insurance and tax benefits, including total exemption from income tax and a 90% discount on property and municipal taxes; and major discounts on public transportation, phone tax, taxes on electrical appliances purchased, and car licensing. In addition, the blind person is entitled to a monthly pension and the assistance of a part-time worker.
It can be assumed that the vast majority of blind individuals in Israel are diagnosed and registered, thanks to universal free access to widely available healthcare in Israel, including all ophthalmologic services, and the considerable advantages conferred by their registration. The application procedure for blind certification and the access to rehabilitation services are facilitated by the work of volunteers assisting blind people in 20 stations nationwide, that is, in all tertiary clinical centers, at the national insurance centers and governmental welfare offices, and in community centers and libraries for the blind.
We analyzed the aggregated data of new certificates of legal blindness issued in Israel, as well as the causes of blindness by age and gender, from 1999 through 2008. The data were derived from the annual reports of the National Registry of the Blind. Information on the sizes of the relevant population subgroups at risk during that period was obtained from the Israel Central Bureau of Statistics database. Annual age- and sex-specific rates of all-cause and disease-specific rates of legal blindness were calculated.
Annual age-standardized rates were calculated from the standard world population for the year 2000, using a direct standardization method. Poisson regression models were used to establish time trends of all-cause and disease-specific rates of blindness, according to age and gender. The dependent variable was the annual rate of all-cause or cause-specific blindness, and the independent variables were calendar year, age group, and gender. Interactions between calendar year and sex or age also were examined.
Results
Between 1999 and 2008, a total of 19 862 newly certified people were registered in the National Registry of the Blind in Israel. There was a continuous decline in the total annual age-standardized rate of blindness certification per 100 000 residents, from 33.8 in 1999 to 16.6 in 2008 ( Figure 1 ) . This represents a drop of 51% throughout that decade.
The population size in Israel (in millions) and distribution of causes of blindness during the decade 1999 through 2008 is shown in Table 1 . The leading causes of blindness certification in Israel in the years 1999 and 2008 were AMD, accounting, respectively, for 20.9% (511) and 28.7% (440) of cases; diabetic retinopathy, 12.5% (306) and 13.2% (202); glaucoma, 13.9% (340) and 12.1% (185); and cataract, 9.8% (240) and 5.1% (78). The general population sex and age distribution is shown in Table 2 , whereas the age and sex distributions of the certified population in these years is shown in Tables 3 and 4 , respectively. The annual age-standardized incidence rates of blindness resulting from the leading causes are shown in Figure 2 .
| 1999 | 2000 | 2001 | 2002 | 2003 | 2004 | 2005 | 2006 | 2007 | 2008 | |
|---|---|---|---|---|---|---|---|---|---|---|
| Population (millions) | 6.13 | 6.29 | 6.44 | 6.57 | 6.69 | 6.81 | 6.93 | 7.05 | 7.18 | 7.31 |
| Newly blind (n) | 2445 | 2329 | 2263 | 2117 | 1959 | 1879 | 1951 | 1666 | 1721 | 1533 |
| Causes, % (n) a | ||||||||||
| AMD | 20.9 (511) | 21.6 (503) | 23.5 (532) | 24.6 (521) | 28 (549) | 33 (620) | 29 (566) | 29.1 (485) | 27.4 (472) | 28.7 (440) |
| Diabetic retinopathy | 12.5 (306) | 13.1 (305) | 14.1 (319) | 14.5 (307) | 14.4 (282) | 14.8 (278) | 16 (312) | 14.2 (237) | 13.4 (231) | 13.2 (202) |
| Glaucoma | 13.9 (340) | 14.3 (333) | 13.1 (296) | 11.7 (248) | 11.8 (231) | 11.4 (214) | 11 (215) | 12.4 (207) | 11.9 (205) | 12.1 (185) |
| Cataract | 9.8 (240) | 9.9 (231) | 8.8 (199) | 7.1 (150) | 7.9 (155) | 4.4 (83) | 6 (117) | 6.4 (107) | 6.2 (107) | 5.1 (78) |
| Retinitis pigmentosa | 7 (171) | 6 (140) | 5.6 (127) | 6.4 (135) | 5.7 (112) | 7 (132) | 6 (117) | 7.7 (128) | 7.2 (124) | 7.8 (120) |
| 1999 | 2000 | 2001 | 2002 | 2003 | 2004 | 2005 | 2006 | 2007 | 2008 | |||||||||||
|---|---|---|---|---|---|---|---|---|---|---|---|---|---|---|---|---|---|---|---|---|
| Age (y) | Female | Male | Female | Male | Female | Male | Female | Male | Female | Male | Female | Male | Female | Male | Female | Male | Female | Male | Female | Male |
| 0 to 5 | 363.3 | 383.3 | 373.4 | 394.0 | 382.5 | 403.8 | 390.3 | 411.6 | 398.3 | 419.3 | 405.7 | 427.2 | 411.9 | 433.8 | 417.4 | 440.0 | 424.7 | 447.0 | 432.7 | 455.4 |
| 6 to 18 | 703.3 | 740.5 | 716.4 | 754.0 | 728.4 | 766.3 | 738.0 | 776.3 | 746.9 | 785.3 | 757.1 | 795.8 | 768.6 | 807.9 | 781.3 | 821.5 | 794.8 | 836.2 | 808.7 | 850.5 |
| 19 to 40 | 980.0 | 983.6 | 1006.1 | 1011.2 | 1028.9 | 1035.7 | 1049.2 | 1057.9 | 1067.6 | 1079.5 | 1086.0 | 1099.6 | 1104.9 | 1120.1 | 1124.1 | 1140.1 | 1143.0 | 1158.8 | 1161.2 | 1178.5 |
| 41 to 65 | 731.9 | 674.6 | 758.2 | 698.7 | 782.1 | 721.0 | 802.3 | 739.8 | 818.3 | 755.5 | 833.2 | 770.8 | 849.3 | 787.0 | 866.6 | 804.3 | 885.3 | 822.8 | 905.1 | 842.3 |
| 66 to 80 | 256.9 | 194.5 | 263.0 | 198.7 | 268.0 | 201.8 | 272.8 | 205.1 | 277.6 | 208.9 | 280.9 | 212.7 | 282.5 | 216.0 | 283.4 | 219.0 | 283.7 | 221.2 | 283.9 | 222.7 |
| 81+ | 68.1 | 45.2 | 69.7 | 45.9 | 72.6 | 48.0 | 75.8 | 50.7 | 79.4 | 53.2 | 84.4 | 55.8 | 89.8 | 58.4 | 95.1 | 60.9 | 99.5 | 63.2 | 103.1 | 65.2 |
| Total per sex per year | 3103.5 | 3021.7 | 3186.8 | 3102.5 | 3262.5 | 3176.6 | 3328.4 | 3241.4 | 3388.1 | 3301.7 | 3447.3 | 3361.9 | 3507.0 | 3423.2 | 3567.9 | 3485.7 | 3631.0 | 3549.2 | 3694.7 | 3614.6 |
| Total (male+female) per year | 6125.2 | 6289.3 | 6439.1 | 6569.8 | 6689.8 | 6809.2 | 6930.2 | 7053.6 | 7180.2 | 7309.3 | ||||||||||
| 1999 | 2000 | 2001 | 2002 | 2003 | 2004 | 2005 | 2006 | 2007 | 2008 | |||||||||||
|---|---|---|---|---|---|---|---|---|---|---|---|---|---|---|---|---|---|---|---|---|
| Age (y) | Total (n) | % | Total (n) | % | Total (n) | % | Total (n) | % | Total (n) | % | Total (n) | % | Total (n) | % | Total (n) | % | Total (n) | % | Total (n) | % |
| 0 to 5 | 59 | 2.40% | 54 | 2.3% | 74 | 3.3% | 75 | 3.5% | 50 | 2.6% | 51 | 2.7% | 64 | 3.3% | 42 | 2.5% | 57 | 3.3% | 55 | 3.6% |
| 6 to 18 | 109 | 4.50% | 118 | 5.1% | 79 | 3.5% | 78 | 3.7% | 59 | 3.0% | 83 | 4.4% | 88 | 4.5% | 66 | 4.0% | 76 | 4.4% | 64 | 4.2% |
| 19 to 40 | 215 | 8.8% | 169 | 7.3% | 152 | 6.7% | 153 | 7.2% | 123 | 6.3% | 123 | 6.5% | 142 | 7.3% | 123 | 7.4% | 129 | 7.5% | 128 | 8.3% |
| 41 to 65 | 592 | 24.2% | 543 | 23.3% | 555 | 24.5% | 514 | 24.3% | 472 | 24.0% | 360 | 19.1% | 385 | 19.7% | 319 | 19.1% | 358 | 20.8% | 345 | 22.5% |
| 66 to 80 | 939 | 38.4% | 899 | 38.6% | 835 | 36.9% | 782 | 36.9% | 724 | 37.0% | 670 | 35.7% | 667 | 34.2% | 558 | 33.5% | 568 | 33.0% | 457 | 29.8% |
| 81+ | 531 | 21.7% | 546 | 23.4% | 568 | 25.1% | 515 | 24.4% | 530 | 27.1% | 592 | 31.6% | 605 | 31.0% | 558 | 33.5% | 533 | 31.0% | 484 | 31.6% |
| Total per year | 2445 | 2329 | 2263 | 2117 | 1958 | 1879 | 1951 | 1666 | 1721 | 1533 | ||||||||||
| Age Range (y) | 1999 | 2000 | 2001 | 2002 | 2003 | 2004 | 2005 | 2006 | 2007 | 2008 |
|---|---|---|---|---|---|---|---|---|---|---|
| Male | ||||||||||
| 0 to 5 | 32 | 32 | 37 | 35 | 27 | 29 | 38 | 24 | 32 | 29 |
| 6 to 18 | 59 | 59 | 52 | 43 | 38 | 43 | 59 | 38 | 42 | 35 |
| 19 to 40 | 128 | 99 | 76 | 74 | 63 | 68 | 72 | 71 | 67 | 67 |
| 41 to 65 | 297 | 271 | 278 | 263 | 257 | 181 | 214 | 158 | 185 | 190 |
| 66 to 80 | 412 | 431 | 373 | 349 | 340 | 332 | 309 | 259 | 259 | 213 |
| 81+ | 260 | 268 | 274 | 252 | 241 | 269 | 266 | 245 | 254 | 229 |
| Total | 1188 | 1160 | 1090 | 1016 | 966 | 922 | 958 | 795 | 839 | 763 |
| Total % | 48.6 | 49.8 | 48.2 | 48.0 | 49.30 | 49.0 | 49.0 | 48.0 | 48.7 | 49.8 |
| Female | ||||||||||
| 0 to 5 | 27 | 22 | 37 | 40 | 23 | 22 | 26 | 18 | 25 | 26 |
| 6 to 18 | 50 | 59 | 27 | 35 | 21 | 40 | 29 | 28 | 34 | 29 |
| 19 to 40 | 87 | 72 | 76 | 79 | 60 | 55 | 70 | 52 | 62 | 61 |
| 41 to 65 | 295 | 272 | 277 | 251 | 215 | 179 | 171 | 161 | 173 | 155 |
| 66 to 80 | 527 | 467 | 462 | 433 | 384 | 338 | 358 | 299 | 309 | 244 |
| 81+ | 271 | 277 | 294 | 263 | 289 | 323 | 339 | 313 | 279 | 255 |
| Total | 1257 | 1169 | 1173 | 1101 | 992 | 957 | 993 | 871 | 882 | 770 |
| Total % | 51.4 | 50.2 | 51.8 | 52.0 | 50.70 | 51.0 | 51.0 | 52.0 | 51.3 | 50.2 |
Stay updated, free articles. Join our Telegram channel

Full access? Get Clinical Tree


