Purpose
To measure choroidal thickness on spectral-domain optical coherence tomography (SD OCT) images using automated algorithms and to correlate choroidal pathology with retinal changes attributable to diabetic macular edema (DME).
Design
Post hoc analysis of multicenter clinical trial baseline data.
Methods
SD OCT raster scans/fluorescein angiograms were obtained from 284 treatment-naïve eyes of 142 patients with clinically significant DME and from 20 controls. Three-dimensional (3D) SD OCT images were evaluated by a certified independent reading center analyzing retinal changes associated with diabetic retinopathy. Choroidal thicknesses were analyzed using a fully automated algorithm. Angiograms were assessed manually. Multiple endpoint correction according to Bonferroni-Holm was applied. Main outcome measures were average retinal/choroidal thickness on fovea-centered or peak of edema (thickest point of edema)–centered Early Treatment Diabetic Retinopathy Study grid, maximum area of leakage, and the correlation between retinal and choroidal thicknesses.
Results
Total choroidal thickness is significantly reduced in DME (175 ± 23 μm; P = .0016) and nonedematous fellow eyes (177 ± 20 μm; P = .009) of patients compared with healthy control eyes (190 ± 23 μm). Retinal/choroidal thickness values showed no significant correlation (1-mm: P = .27, r 2 = 0.01; 3-mm: P = .96, r 2 < 0.0001; 6-mm: P = .42, r 2 = 0.006). No significant difference was found in the 1- or 3-mm circle of a retinal peak of edema–centered grid. All other measurements of choroidal/retinal thickness (DME vs healthy, DME vs peak of edema–centered, DME vs fellow, healthy vs fellow, peak of edema–centered vs healthy, peak of edema–centered vs fellow eyes) were compared but no statistically significant correlation was found. By tendency a thinner choroid correlates with larger retinal leakage areas.
Conclusions
Automated algorithms can be used to reliably assess choroidal thickness in eyes with DME. Choroidal thickness was generally reduced in patients with diabetes if DME is present in 1 eye; however, no correlation was found between choroidal/retinal pathologies, suggesting different pathogenetic pathways.
Half a century ago, Yanoff proposed that the choroid influences the pathogenesis of diabetic retinopathy, and for almost 30 years it has been known that choroidal vasculopathy plays an important role in the pathogenesis of diabetic retinopathy. The choroidal vasculature, especially the choriocapillaris, is critical for maintenance of the neurosensory retina because it supplies the outer retina with nutrition and oxygen. It is most important in the foveal avascular zone.
Before 3-dimensional optical coherence tomography (OCT) was introduced in the 1990s, choroidal structures could be examined 3-dimensionally only in enucleated or post mortem eyes or 2-dimensionally, where indocyanine green angiography was the only available method. However, angiography images and findings from enucleated eyes are difficult to interpret. Recently, OCT and related new analysis techniques provided the first opportunity to image the retina and underlying tissues, including the choroid, in vivo and to assess choroidal vessels in patients with diabetic retinopathy. Thus, the choroid can now be monitored in different stages of diabetic retinopathy.
OCT is a noninvasive, cross-sectional imaging technique for biological material such as the human retina and uses low-coherence interferometry to produce an image from optical scattering. New imaging techniques including long-wavelength OCT, polarization-sensitive OCT, and standard spectral-domain (SD) OCT with an enhanced depth-imaging mode allow more detailed observation of choroidal thickness. These possibilities have triggered a substantial scientific interest in the choroidal vasculature in ocular pathology, especially in retinal vascular diseases such as diabetic retinopathy and diabetic macular edema (DME).
Earlier studies suggest that choroidal thickness is decreased in DME, but the studies were usually limited by manual analysis or a small number of patients or acquired scans. Therefore the relevance of these observations needs to be tested more objectively in larger data sets and using dense raster scanning OCT.
Clinical application of quantitative choroidal analysis is limited by the need for specific scanning protocols or equipment, the laborious evaluation process and variability of manual delineation, or use of single scans. Thus, automated segmentation of the choroid has been developed and validated. In this study, we investigated the choroidal vasculature in diabetic macular edema using automated 3-dimensional segmentation in standard clinical SD OCT images. The level of potential choroidal pathology in this disease was measured over the entire posterior pole and correlated with concomitant retinal vascular alteration to gain insight into a possible association between retinal and choroidal pathology in a disease that is one of the leading causes of blindness in the elderly, a large and growing population.
Some studies have automatically segmented the choroid using different algorithms on standard SD OCT, but exclusively in healthy people or patients with dry age-related macular disease. To our knowledge, the present study is the first to automatically evaluate choroidal thickness on standard SD OCT over the entire posterior pole and correlate the findings at the choroidal level with the presence and extent of diabetic macular disease in a large and representative group of patients.
Methods
Patient Group
SD OCT raster scans (512 × 128) (Cirrus; Carl Zeiss Meditec, Dublin, California, USA; software version 3.0.0.64 or later) and corresponding fluorescein angiograms from 142 patients with treatment-naïve DME in the study eye were analyzed. Images in the baseline data sets of a large multicenter clinical study were processed by the Vienna Reading Center. The data used were from patients with DME and no other confounding retinal disease. Ethical approval was obtained from the institution’s review board. Each patient gave informed consent before inclusion in the study. The study adhered to the tenets of the Declaration of Helsinki and the standards of Good Scientific Practice of the Medical University of Vienna. The images were taken at each study site according to the same predetermined scanning protocol to guarantee a standardized procedure.
Inclusion criteria for the study were age over 18 years, treatment naivety (for at least 3 months before scanning with OCT), and DME attributable to nonproliferative diabetic retinopathy. At least 1 eye had to be affected by clinically significant DME (as diagnosed by the investigator, an ophthalmologist trained in diagnosis of clinically significant macular edema) with a central retinal thickness (CRT) >300 μm. Clinically significant macular edema was defined as “retinal thickening that involves or threatens the center of the macula (even if visual acuity is not yet reduced)” according to the Early Treatment Diabetic Retinopathy Study Report 1. Exclusion criteria were ocular opacity attributable to cataract, vitreous opacification or corneal opacities that might lead to poor image quality, history of any other vitreoretinal disease or treatment, and high myopia ≥8 diopters. The control group comprised healthy volunteers of whom at least 50% were aged 50 years or older. The healthy control and patient groups had no history of ocular disease and no ocular opacity attributable to cataract or vitreous opacification that might lead to poor image quality. Study patients’ eyes were divided into 3 groups: study eyes with DME, non-study fellow eyes with DME, and non-study fellow eyes without DME.
Spectral-domain Optical Coherence Tomography Analysis of Retinal and Choroidal Alteration
OCT images underwent automatic analysis at the University of Iowa and manual evaluation by certified graders of the Vienna Reading Center. As a first step, the retinal layer segmentation of 10 intraretinal surfaces and Bruch’s membrane were detected automatically using the graph-based multilayer segmentation approach, called the Iowa Reference Algorithm. Errors in the segmentation of the Bruch’s membrane were systematically evaluated and large deviations were corrected manually by the reading center ( Figure 1 , Top). Afterwards the fully automated choroidal volume assessment could be performed. After flattening the image along the Bruch’s membrane (to reduce geometric distortion; Figure 1 , Upper center), an automated vessel segmentation algorithm was applied to identify vessel shadowing effects and to smoothen the images to prevent shadows being identified as choroidal vessels ( Figure 1 , Lower center).
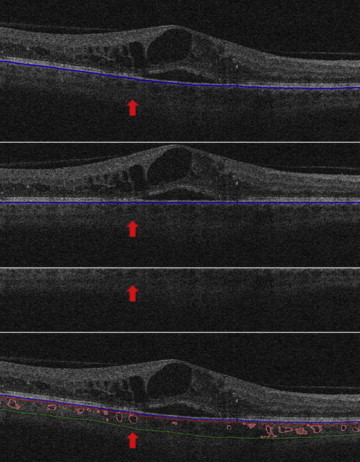
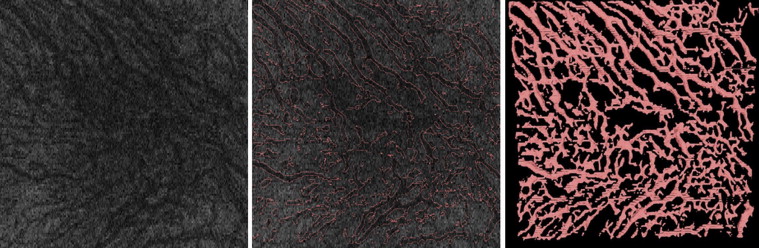
As a next step, the entire choroidal vasculature was segmented using an automated method for 3-dimensional segmentation of choroidal vasculature that includes Hessian detection of 3-dimensional cylindrical features and probabilistic identification of vasculature seed points. Region-growing segmentation to determine choroidal vasculature followed ( Figure 2 ). A pair of thin-plate splines was fitted on each side of the choroidal vasculature, which allowed quantification of choroidal thickness for each A-scan ( Figure 1 , Bottom, thickness between the red and green lines). Similarly, the distance between the inner surface (thin-plate spline) of the choroidal vasculature and the Bruch’s membrane was defined as the choriocapillaris equivalent, and its thickness was calculated automatically for each A-scan ( Figure 1 , Bottom, thickness between the blue and red lines). The sum of the 2 choroidal layers was defined as choroidal thickness in this study.
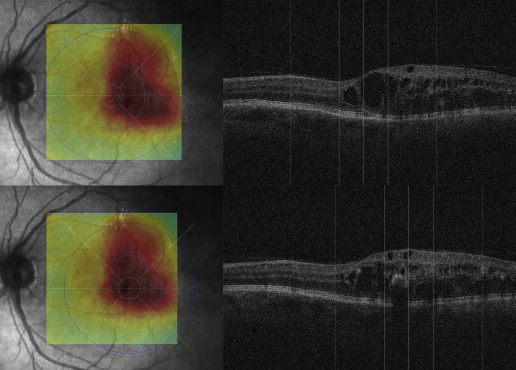
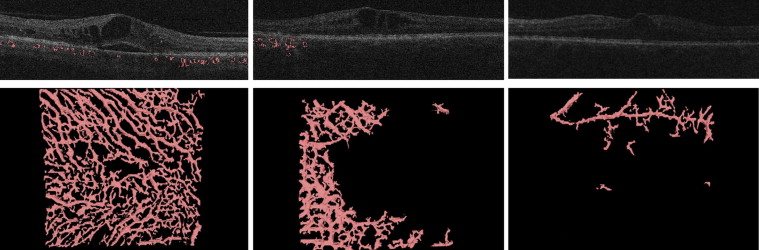
To assure grading of the same position at the posterior pole, the fovea was checked and, if necessary, manually replotted by experienced graders from the Vienna Reading Center to ensure that the Early Treatment Diabetic Retinopathy Study (ETDRS) grids were in the same position in each image stack ( Figure 3 , Top). Image stacks with obvious segmentation errors in the Bruch’s membrane were corrected manually or excluded if manual repositioning of this surface’s segmentation was not possible (eg, owing to poor image quality). All images with an insufficient quality of Bruch’s membrane or where parts of the data set were missing (eg, fluorescein angiograms) were excluded from statistical analysis. The retinal and choroidal thicknesses between the internal limiting membrane and Bruch’s membrane and between the Bruch’s membrane and the outer choroidal limiting membrane were calculated automatically in all 9 subfields. A second grid was centered at the peak of edema to allow comparison of the values from the grids to each other and to retinal and choroidal values in the peak region ( Figure 3 , Bottom). All values were calculated in micrometers (μm). Finally, all insufficient segmentation results (defined as segmentation where >50% of choroidal vessels in 6 mm × 6 mm could not be detected automatically) were identified manually ( Figure 4 ).
Angiographic Delineation of Leakage Areas
Analysis of fluorescein angiograms was confined to measurement of the maximum area of leakage in the late phase. The timing of the late phase is strictly set within a standardized reading center trial and was therefore the same for each angiogram. The measurements were performed within a reading center setting. The pixel number and size were standardized in all images before inclusion of study sites in the multicenter trial using the Vienna Reading Center’s test eye procedure to allow measurement of the area in mm 2 with reference to the SISPOT test eye. To define the maximum area of leakage, the total area of hyperfluorescence of the macula in the late-phase image compared with the early-phase image was marked manually with ImageJ (Version 1.46r) by experienced and certified graders of the Vienna Reading Center under continuous supervision by senior retinal specialists. Staining areas and window defects were not included.
Correlation of Retinal and Choroidal Disease
Retinal and choroidal (choriocapillaris) mean thickness values were calculated in all ETDRS subcircles of eyes with DME manually centered on the fovea or on the peak of edema, and in non-DME fellow eyes, DME fellow eyes, and healthy eyes. The correlation between each retinal and choroidal thickness value in the same patient group at the same position was calculated. As a next step, choroidal thickness values were compared between the patient groups, that is, values of DME fovea-centered vs DME peak of edema–centered ETDRS grids, DME fovea-centered vs non-DME fellow eyes, DME fovea-centered vs DME fellow eyes, DME fovea-centered vs healthy eyes, DME peak of edema–centered vs non-DME fellow eyes, DME peak of edema–centered vs DME fellow eyes, DME peak of edema–centered vs healthy eyes, non-DME fellow vs DME fellow eyes, non-DME fellow vs healthy eyes, and DME fellow vs healthy eyes. Furthermore, mean leakage area was calculated and compared with choroidal thickness values to assess differential effects of diabetic conditions on the retinal and the choroidal vasculature.
Statistical Analysis
Statistical comparisons were done by nonparametric methods: Mann-Whitney tests for comparison of independent groups and Wilcoxon matched-pairs tests for within-participant comparisons. Relations between continuous variables were inspected by scatterplots and, if found, linear Pearson correlation coefficients were computed. In all tests, P values below .05 were considered significant. Multiple endpoint correction according to Bonferroni-Holm was applied, and P values were adjusted for significance.
Results
A total of 142 patients were included in the study. Twenty-seven patients (19%) were excluded because of poor image quality, preventing segmentation of the Bruch’s membrane (automatically or manually), or because of missing fluorescein angiograms. Accordingly, data from 115 patients (81%) were processed by automated analysis. In less than 5% of the images the Bruch’s membrane was not segmented correctly.
The Table shows the mean retinal and choroidal thicknesses in all ETDRS grid subcircles centered on the fovea and centered on the peak of edema in the study eyes with DME. The Table also shows the mean retinal and choroidal thicknesses in all ETDRS grid subcircles centered on the fovea in the fellow eyes without DME and the overall choroidal thickness in the healthy control group.
| 1 mm | 3 mm | 6 mm | 1 mm | 3 mm | 1 mm | 3 mm | 6 mm | 6 mm | |
|---|---|---|---|---|---|---|---|---|---|
| Fovea | Fovea | Fovea | Edema | Edema | Fellow | Fellow | Fellow | Healthy | |
| Retina | 427 | 415 | 380 | 442 | 391 | 426 | 415 | 381 | n/a |
| Choroid | 170 | 173 | 175 | 155 | 158 | 171 | 174 | 177 | 190 |
Stay updated, free articles. Join our Telegram channel

Full access? Get Clinical Tree


