Purpose
To assess retinal nerve fiber layer (RNFL) thickness at term-equivalent age in very preterm (<32 weeks gestational age) vs term-born infant cohorts, and compare very preterm infant RNFL thickness with brain anatomy and neurodevelopment.
Design
Cohort study.
Methods
RNFL was semi-automatically segmented (1 eye per infant) in 57 very preterm and 50 term infants with adequate images from bedside portable, handheld spectral-domain optical coherence tomography imaging at 37–42 weeks postmenstrual age. Mean RNFL thickness was calculated for the papillomacular bundle (−15 degrees to +15 degrees) and temporal quadrant (−45 degrees to +45 degrees) relative to the fovea–optic nerve axis. Brain magnetic resonance imaging (MRI) scans clinically obtained in 26 very preterm infants were scored for global structural abnormalities by an expert masked to data except for age. Cognitive, language, and motor skills were assessed in 33 of the very preterm infants at 18–24 months corrected age.
Results
RNFL was thinner for very preterm vs term infants at the papillomacular bundle ([mean ± standard deviation] 61 ± 17 vs 72 ± 13 μm, P < .001) and temporal quadrant (72 ± 21 vs 82 ± 16 μm, P = .005). In very preterm infants, thinner papillomacular bundle RNFL correlated with higher global brain MRI lesion burden index (R 2 = 0.35, P = .001) and lower cognitive (R 2 = 0.18, P = .01) and motor (R 2 = 0.17, P = .02) scores. Relationships were similar for temporal quadrant.
Conclusions
Thinner RNFL in very preterm infants relative to term-born infants may relate to brain structure and neurodevelopment.
Infants born very preterm (<32 weeks gestational age) have a high rate (50%–70%) of poor neurodevelopment. Compared to term infants, very preterm infants have smaller total brain volume, reduced white matter integrity, abnormal visual cortical sensitivity, and more intraventricular hemorrhages. Worse neurodevelopmental outcomes are found among very preterm infants with unfavorable vs favorable visual status. While recent studies in adults have emphasized the impact of retinal abnormalities on the visual pathway, the relationship between early retinal and optic nerve microanatomy and brain anatomy or subsequent brain functions is not known in preterm infants.
Spectral-domain optical coherence tomography (SD OCT) provides high-resolution in vivo imaging of eye microanatomy, including the layers of the retina such as the retinal nerve fiber layer (RNFL). The RNFL consists of the unmyelinated ganglion cell axons that form the optic nerve, become myelinated posterior to the lamina cribrosa, and then extend as the optic tract to synapse in the lateral geniculate nucleus of the thalamus. Thus, SD OCT enables noninvasive assessment of central nervous system tissue via the retina, which is an extension of the diencephalon. Assessment of RNFL is generally based on segmentation of SD OCT images to produce an average RNFL thickness. This measurement has been studied extensively in the adult population as a biomarker for glaucoma and optic atrophy. In addition, average RNFL thickness is under investigation as a biomarker for neurodegenerative diseases such as multiple sclerosis, Alzheimer disease, and Parkinson disease, under the premise that anatomic abnormalities in the anterior visual pathway correlate with greater central nervous system disease burden. While previous studies in school-age children demonstrated differences in RNFL thickness by birth parameters, neither these relationships nor potential correlations between RNFL and neurologic health have been established during the neonatal period.
The introduction of portable, handheld SD OCT to the nursery allows for noncontact, bedside assessment of the nonsedated, supine infant’s retinal microanatomy, which provides insight into eye development and maturation. Correlations have been reported between these retinal and optic nerve metrics of development and the broader brain health of preterm infants. For example, subclinical macular edema has been identified as an ophthalmologic biomarker of poor neurodevelopment in very preterm infants. In another study, Tong and associates used SD OCT to reproducibly quantify optic nerve parameters in preterm infants that correlated with both brain pathology and subsequent neurodevelopmental abnormalities. Furthermore, average RNFL thickness has been measured reproducibly in healthy, term neonates as another metric of central nervous system tissue. In this study we aim to evaluate the relationship of ganglion cell anatomy to brain health and development by assessing RNFL thickness measurements, and to compare these data to standardized quantification of magnetic resonance imaging (MRI) brain lesion burden and neurodevelopmental outcomes in very preterm infants.
Methods
This prospective cohort study was approved by the Duke University Health System institutional review board and complied with the Health Insurance Portability and Accountability Act and all tenets of the Declaration of Helsinki. Infants were enrolled from September 8 th , 2009 to June 17 th , 2014 with the written consent of a parent or legal guardian. The healthy, term cohort has been previously described. Term infants in the newborn nursery were eligible if born between 37 and 42 weeks postmenstrual age and deemed clinically stable to undergo SD OCT imaging. Very preterm infants at the Duke University intensive care nursery were eligible for SD OCT imaging following clinically indicated retinopathy of prematurity (ROP) screening examination if deemed clinically stable at the time of eye examination by the intensive care nursery pediatric team. Criteria for ROP screening included: birth at or before 30 weeks postmenstrual age or birth weight at or under 1500 g, and at least 4 weeks of life at the time of first eye examination. All SD OCT imaging was performed following an age-specific protocol described by Maldonado and associates using a portable, handheld SD OCT system (either an early research system, the Envisu 2200, or the Envisu 2300; Bioptigen, Inc, Research Triangle Park, North Carolina). This protocol obtains volumetric rectangular OCT scans with both A-scans and B-scans 10 μm apart. Demographic information was collected from medical records, including gestational age, birth weight, sex, race, maximum ROP severity (stage), maximum plus disease status (whether or not plus disease was clinically diagnosed), and clinical need for ROP treatment (laser photocoagulation or intravitreal bevacizumab, an anti–vascular endothelial growth factor pharmaceutical used off label for ROP treatment).
One eye per infant was included in this study; all scans obtained from both eyes were considered, with whichever eye had the best SD OCT scan as selected by a trained pediatric SD OCT grader (A.L.R.) included. The best SD OCT scans were considered those with minimal eye movement, tilt, and rotation and with optimal alignment and differentiation of retinal layers for RNFL thickness analyses. The best SD OCT scan captured within the interval of 37 and 42 weeks postmenstrual age (term-equivalent age) that contained the optic disc and macula was used for each infant in the primary analysis, while the best scan obtained at 36 weeks postmenstrual age or less was included for a secondary analysis if available.
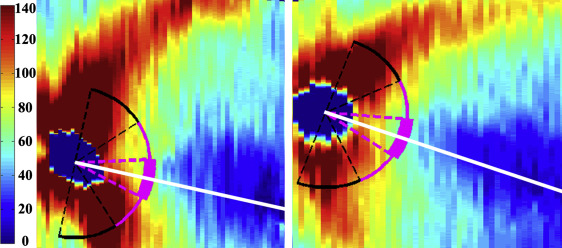
Average RNFL thickness was measured on all SD OCT scans using a previously described method that utilized several custom MATLAB scripts (Mathworks, Inc, Natick, Massachusetts, USA). To summarize, SD OCT scans were converted to tagged image file format and registered with ImageJ v 1.43r software (National Institutes of Health, Bethesda, Maryland, USA). The inner and outer boundaries of the RNFL were semi-automatically segmented with a custom script and manually corrected by 2 trained graders (A.L.R. and M.B.S.). These graders then marked the optic nerve center and fovea on each scan to create an organizing axis. The average RNFL thickness was calculated at a radial distance of 1.5 mm from the optic nerve center across the papillomacular bundle, defined as the arc from −15 degrees to +15 degrees relative to the organizing axis, as well as across the temporal quadrant, defined as the arc from −45 degrees to +45 degrees relative to the organizing axis ( Figure 1 ). Average RNFL thickness measurements were required to have a minimum of 90% of the specified arc segmented for inclusion. In 2 term and 1 very preterm infant, there were insufficient scan data to measure RNFL across the temporal quadrant. Presence of macular edema as well as quantitative parameters of macular edema severity (central foveal thickness, inner nuclear layer thickness, and the average foveal-to-parafoveal thickness ratio at a 1000 μm distance from the foveal center) were measured using the calipers tool of OsiriX v4.1.12 software (Pixmeo, Bernex, Switzerland) for every imaging session obtained on each very preterm infant by 2 trained graders (A.L.R. and S.M.) masked to RNFL data. The SD OCT scan with the greatest central foveal thickness was selected as the imaging session representing the greatest edema.
Each infant with brain MRI imaging while in the intensive care nursery (near term) had his or her de-identified brain MRI uploaded to a secure server and scored by a pediatric neuroradiologist (J.S.S.) for structural abnormalities using conventional T1- and T2-weighted images. Brain MRI was available for analysis when ordered as clinically indicated by the neonatology team and was not obtained on all very preterm infants. A modification of the brain MRI scoring system developed by Kidokoro and associates was used to generate brain lesion indices. The original scoring system was altered by excluding the corpus callosum measurement, since it was difficult to perform in our population; and the lateral ventricle measurement was done in the transverse plane, since the prescribed coronal views were not available. This provided a cerebral white matter, total cortical gray matter, deep gray matter, and cerebellar lesion burden subscore as well as a total global brain lesion burden index that correlates with the extent of brain injury.
Medical records were reviewed to assess for very preterm infant brain health and systemic health, including inflammation, which might impact neurodevelopment. Systemic health information including diagnoses of hydrocephalus, intraventricular hemorrhage and grade, bronchopulmonary dysplasia, necrotizing enterocolitis, use of postnatal hydrocortisone or dexamethasone, blood or cerebrospinal fluid culture-positive sepsis, culture-negative sepsis, urinary tract infection, and weight percentile at 36 weeks postmenstrual age on the Fenton Preterm Growth Chart were evaluated by neonatologists (C.M.C. and L.E.).
Bayley Scales scores were gathered for all very preterm infants in whom these were available. All very preterm infants from the intensive care nursery were referred to a special infant care follow-up clinic as part of standard intensive care nursery practice. This clinical tool, considered standard of care for neurodevelopmental assessment, provides composite scores in cognitive, language, and motor skills that are standardized to a mean of 100 and standard deviation of 15. A licensed psychologist and infant developmental specialist (K.E.G.) certified as a Bayley examiner by the National Institutes of Health Neonatal Research Network assessed the infants using the Bayley Scales of Infant and Toddler Development, Third Edition (Pearson, San Antonio, Texas, USA) at 18–24 months corrected age. The examiner was masked to all eye imaging data.
Statistical analysis was performed using JMP Pro v 10 (SAS, Cary, North Carolina, USA). Demographic parameters were compared between term and very preterm infants with 2-tailed t tests for continuous variables and Fisher exact tests for nominal variables. Demographics were compared between very preterm infants who had brain MRI imaging while in the intensive care nursery vs those who did not have MRI, and between those who underwent Bayley assessment and those who did not but were age-eligible at the time of analysis, using Wilcoxon rank-sum tests for continuous variables and Fisher exact test for nominal variables.
All analyses involving mean RNFL thickness were performed with both papillomacular bundle and temporal quadrant measurements. Mean RNFL thickness for term vs very preterm infants was compared by a 2-tailed t test. A matched-pairs analysis compared mean RNFL thickness for all very preterm infants with an adequate SD OCT scan at both <37 weeks postmenstrual age and term-equivalent age and was repeated by categorizing the very preterm infants by need for ROP treatment. Gestational age, age at imaging, and birth weight were compared to mean RNFL thickness across all infants and within the very preterm cohort by linear regression. Mean RNFL thickness was compared between maximum ROP stage and plus disease status by Kruskal-Wallis tests, while mean RNFL thickness and need for ROP treatment were compared by a Wilcoxon rank-sum test. Mean RNFL thickness was compared between very preterm infants with and without macular edema by a 2-tailed t test, and in relation to maximum central foveal thickness, inner nuclear layer thickness, and foveal-to-parafoveal thickness ratio by linear regression. Very preterm infants with previously characterized optic nerve parameters had their mean RNFL thickness compared to their cup-to-disc ratio by linear regression.
Mean RNFL thickness intragrader and intergrader reproducibility was assessed across the papillomacular bundle by intraclass correlation coefficients and 95% confidence intervals for 20 randomly selected very preterm infant SD OCT scans by 1 (A.L.R.) and 2 graders (A.L.R. and M.B.S.), respectively. Intravisit reproducibility was also assessed by regrading (A.L.R.) all very preterm infants with more than 1 adequate SD OCT scan at the same imaging session. All SD OCT scans used for reproducibility assessment were resegmented with their optic nerve and fovea remarked by graders masked to initial RNFL thickness measurements. Intragrader, intergrader, and intravisit reproducibility of healthy, full-term neonatal RNFL thickness have been previously reported.
The relationships between mean RNFL thickness and brain lesion indices were assessed by linear regression; cortical and deep gray matter scores were combined for a total gray matter injury subscore. Mean RNFL thickness was compared between the very preterm infants who did vs did not have a clinical MRI obtained and who did vs did not have Bayley Scales follow-up (2-tailed t test). Mean RNFL thickness was evaluated against the presence of systemic health factors with a Wilcoxon rank-sum test. It should be noted that with Bonferroni correction a P value < .005 is required for statistical significance for this sub-analysis. Cognitive, language, and motor Bayley Scales scores were compared to RNFL thickness by linear regression, as was global brain MRI lesion burden index vs Bayley Scales scores.
Multivariate analyses were used to assess the contribution of systemic health parameters toward the 2 outcomes of neurologic health: global brain lesion burden index and Bayley Scales scores. For each analysis, systemic health parameters were gestational age, birth weight, ROP treatment, macular edema, and mean RNFL thickness. Note that the global brain lesion burden index model contained only very preterm infants with MRI obtained in the intensive care nursery while the Bayley Scales model contained those with Bayley Scales follow-up as a toddler. Only significant parameters are included in the reported models. Values shown represent mean ± standard deviation or median (range) unless otherwise specified.
Results
Demographics
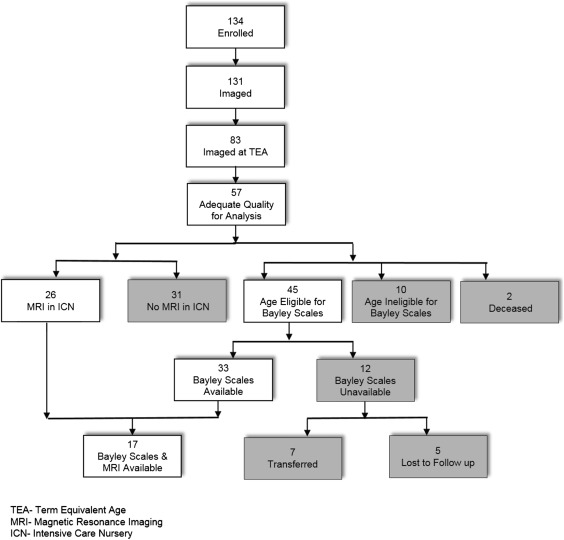
Fifty-seven term infants and 134 very preterm infants were enrolled in the prospective SD OCT imaging study, and parents withdrew 1 term and 3 very preterm infants prior to imaging ( Figure 2 ). Fifty of 56 term infants and 57 of 83 very preterm infants imaged at term-equivalent age had an SD OCT scan of adequate quality for RNFL analysis. Throughout these results, unless otherwise stated the RNFL measurements are at term-equivalent age. The term infants have been previously described. Basic demographic information for both cohorts is found in Table 1 . The mean gestational age and birth weight for the term vs very preterm infants were 39.2 ± 1.1 vs 25.9 ± 2.3 weeks postmenstrual age ( P < .001) and 3356 ± 458 vs 831 ± 243 grams ( P < .001), respectively. There was no significant difference in the age at SD OCT imaging or eye laterality between the 2 groups. There was a lower percentage of male infants in the term (44%) vs very preterm group (65%, P = .03). The racial/ethnicity compositions of the 2 groups differed ( P < .001) owing to the higher prevalence of Hispanics in the term (40%) compared to the very preterm group (5%). In addition, 20 very preterm infants (35%) had severe ROP requiring treatment; 18 had laser treatment prior to SD OCT imaging, while 1 infant received bevacizumab before imaging and 1 received bevacizumab after imaging.
| Term N = 50 | Very Preterm N = 57 | P Value a | |
|---|---|---|---|
| Gestational age (wk), mean (SD) | 39.2 (1.1) | 25.9 (2.3) | <.001 |
| Birth weight (wk), mean (SD) | 3356 (458) | 831 (243) | <.001 |
| Age at OCT imaging (wk), mean (SD) | 39.2 (1.1) | 38.8 (1.7) | .22 |
| Sex, n (%) | .03 | ||
| Male | 22 (44) | 37 (65) | |
| Race, n (%) | <.001 | ||
| African-American | 12 (24) | 28 (49) | |
| White | 18 (36) | 26 (46) | |
| Hispanic | 20 (40) | 3 (5) | |
| Eye, n (%) | .85 | ||
| OD | 26 (52) | 31 (54) | |
| Maximum ROP stage, n (%) | |||
| 0 | — | 9 (16) | |
| 1 | — | 5 (9) | |
| 2 | — | 19 (33) | |
| 3 | — | 22 (39) | |
| 4 | — | 2 (3) | |
| Plus disease, n (%) | |||
| No plus | — | 32 (56) | |
| Pre-plus | — | 14 (25) | |
| Plus | — | 11 (19) | |
| ROP treatment, n (%) | |||
| No treatment | — | 37 (65) | |
| Laser photocoagulation | — | 18 (32) | |
| Bevacizumab | — | 2 (3) |
a Two-tailed t test for gestational age, birth weight, and age at imaging; Fisher exact test for sex, race, and eye.
Retinal Nerve Fiber Layer Thickness in Term and Very Preterm Infants
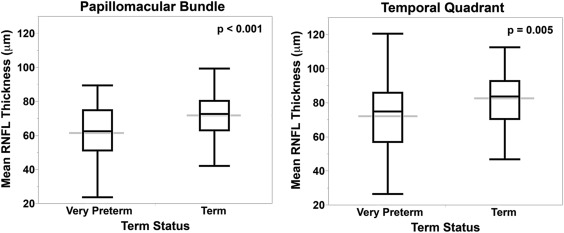
RNFL was thinner for very preterm vs term infants at the papillomacular bundle (61 ± 17 μm vs 72 ± 13 μm, P < .001) and temporal quadrant (72 ± 21 μm vs 82 ± 16 μm, P = .005, Figure 3 ). When considering both term and very preterm infants together, there was a significant but weak relationship between RNFL and both gestational age (papillomacular bundle: R 2 = 0.10, P = .008; temporal quadrant: R 2 = 0.07, P = .007) and birth weight (papillomacular bundle: R 2 = 0.10, P = .001; temporal quadrant: R 2 = 0.08, P = .003), respectively. Within the very preterm infant cohort, there were no significant differences in mean RNFL thickness across the papillomacular bundle or temporal quadrant by gestational age, age at imaging, birth weight, or ROP severity (data not shown).
Thirty-eight very preterm infants in the current study had their optic nerve parameters previously described. These very preterm infants exhibited an inverse correlation between cup-to-disc ratio and mean RNFL thickness across the papillomacular bundle (R 2 = 0.22, P = .002) and temporal quadrant (R 2 = 0.21, P = .006). Thirty-seven very preterm infants (37/57; 65%) had macular edema noted on at least 1 imaging session but there was no relationship found between mean RNFL thickness across the papillomacular bundle and temporal quadrant by presence of macular edema or severity of macular edema: maximum central foveal thickness, inner nuclear layer thickness, or foveal-to-parafoveal thickness ratio.
Twenty-seven very preterm infants also had RNFL imaging with SD OCT at a younger age, <37 weeks postmenstrual age. The mean ages at initial and subsequent (term-equivalent age) SD OCT imaging were 33.8 ± 1.4 and 38.3 ± 1.6 weeks postmenstrual age, respectively. The mean RNFL thickness measured from initial to subsequent SD OCT imaging (at term-equivalent age) increased across the papillomacular bundle as well as the temporal quadrant (mean increases of 15 ± 10 μm [n = 27] and 24 ± 15 μm [n = 26], respectively, P < .001 for each). The matched-pairs analysis results continued to demonstrate significant thickening from <37 weeks to term-equivalent age when dividing the very preterm infants into groups based on need for ROP treatment.
The intraclass correlation coefficient (95% confidence interval) for intergrader, intragrader, and intravisit reproducibilities for very preterm RNFL thickness across the papillomacular bundle were 0.95 (0.87–0.98), 0.95 (0.88–0.98), and 0.92 (0.72–0.98, based on 15 very preterm infants with 2 reliable SD OCT scans for RNFL analysis at the same imaging session), respectively.
Retinal Nerve Fiber Layer Thickness and Neurologic Health
Twenty-six of the 57 very preterm infants (46%) with full SD OCT data had a brain MRI ordered in the intensive care nursery and performed at a mean age 44 ± 4 weeks postmenstrual age. Both gestational age and birth weight were lower in those who did vs did not undergo MRI (median age 24 [23–31] vs 26 [24–31] weeks postmenstrual age, respectively, P = .001; median birth weight 645 [450–1290] vs 940 [580–1400] grams, P < .001, respectively). There was no significant difference in sex, race/ethnicity, or incidence of ROP requiring treatment between those very preterm infants who did and did not undergo brain MRI. There was a trend toward thinner mean RNFL across the papillomacular bundle in very preterm infants with (57 ± 3.3 μm) vs without MRI (66 ± 3 μm, P = .06), but not across the temporal quadrant ( P = .17).
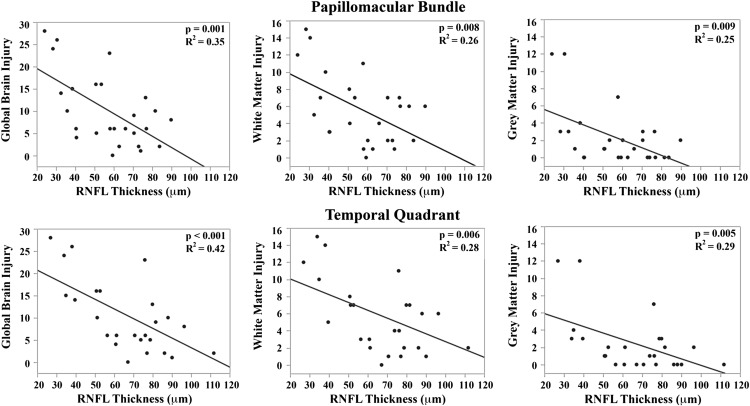
The mean brain injury scores for all very preterm infants with brain MRIs were as follows: global brain MRI lesion burden index of 10 ± 8, regional white matter injury subscore of 6 ± 4, and combined gray matter injury subscore of 2 ± 3. Thinner RNFL correlated with an increase in brain injury on MRI: there was an inverse relationship between mean RNFL thickness across the papillomacular bundle and global brain MRI lesion burden index ( P = .001), regional white matter injury subscore ( P = .008), and combined gray matter injury subscore ( P = .009, Figure 4 , Top). There was a similar inverse relationship between mean RNFL thickness across the temporal quadrant and global brain injury index ( P < .001), regional white matter injury subscore ( P = .006) and combined gray matter injury subscore ( P = .005, Figure 4 , Bottom). There was no significant relationship between global, white matter, or gray matter brain lesion indices and any macular edema parameters measured (data not shown). In a multivariate model, when considering mean RNFL across the papillomacular bundle, both RNFL ( P < .001) and birth weight ( P = .03) contributed to global brain lesion burden index (R 2 = 0.47, P < .001). This relationship was maintained when considering mean RNFL across the temporal quadrant: both RNFL ( P < .001) and birth weight ( P = .02) contributed to global brain lesion burden index (R 2 = 0.55, P < .001). The present study found no significant relationship between mean RNFL thickness in very preterm infants and systemic factors known to influence health outcomes ( Table 2 ).
| Diagnosis | Papillomacular Bundle | P Value a | Temporal Quadrant | P Value a | ||||
|---|---|---|---|---|---|---|---|---|
| n | Median μm | Range μm | N | Median μm | Range μm | |||
| Hydrocephalus | .02 | .02 | ||||||
| N | 48 | 65 | 31–90 | 47 | 76 | 35–112 | ||
| Y | 8 | 39 | 24–77 | 8 | 44 | 27–121 | ||
| Culture-positive sepsis | .10 | .07 | ||||||
| N | 43 | 65 | 28–90 | 42 | 76 | 34–121 | ||
| Y | 14 | 56 | 24–82 | 14 | 64 | 27–93 | ||
| Culture-negative sepsis | .79 | .80 | ||||||
| N | 24 | 64 | 30–89 | 24 | 74 | 37–112 | ||
| Y | 33 | 62 | 24–90 | 32 | 76 | 27–121 | ||
| Urinary tract infection | .77 | .49 | ||||||
| N | 29 | 64 | 30–89 | 28 | 76 | 35–106 | ||
| Y | 28 | 62 | 24–90 | 28 | 73 | 27–121 | ||
| Intraventricular hemorrhage | .30 | .14 | ||||||
| Grade 0–2 | 49 | 64 | 28–90 | 48 | 76 | 34–121 | ||
| Grade 3–4 | 7 | 54 | 24–82 | 7 | 53 | 27–88 | ||
| Bronchopulmonary dysplasia | .66 | .81 | ||||||
| N | 46 | 64 | 24–90 | 45 | 74 | 27–121 | ||
| Y | 11 | 62 | 28–81 | 11 | 76 | 34–93 | ||
| Postnatal steroids | .65 | .52 | ||||||
| N | 19 | 65 | 28–89 | 18 | 77 | 34–106 | ||
| Y | 38 | 62 | 24–90 | 38 | 74 | 27–121 | ||
| Necrotizing enterocolitis | .34 | .65 | ||||||
| N | 50 | 63 | 24–90 | 49 | 76 | 27–112 | ||
| Y | 7 b | 58 | 30–77 | 7 b | 70 | 38–121 | ||
| <5% 36-week weight c | .25 | .36 | ||||||
| No | 18 | 69 | 28–89 | 17 | 78 | 34–121 | ||
| Yes | 37 | 60 | 24–90 | 37 | 74 | 27–96 | ||
a P values calculated with Wilcoxon rank-sum test. Note with Bonferroni correction a P value < .005 is required for statistical significance.
b Includes 1 medical necrotizing enterocolitis and 6 surgical necrotizing enterocolitis cases.
c Weight at 36 weeks postmenstrual age unavailable for 2 infants.
Stay updated, free articles. Join our Telegram channel

Full access? Get Clinical Tree


