Purpose
To establish objective lower limits of normal optic nerve (ON) size in children based on high-resolution orbital magnetic resonance imaging (MRI).
Design
Case-control study of patients with ON hypoplasia vs normal controls.
Methods
A neuroradiologist made 4 measurements of each ON at 2 locations (5 mm posterior to the optic disc and just posterior to the optic canal) in patients with ON hypoplasia and controls aged 0–17 years from an academic eye center and children’s hospital. Primary analyses were performed using mixed linear models.
Results
Measurements were made in 26 cases of clinically confirmed ON hypoplasia and 31 controls (median age: ON hypoplasia, 1 year; controls, 5.5 years). Nine of 26 cases (35%) and 19 of 31 controls (61%) underwent high-resolution T2-weighted imaging of the orbits. Mean ON diameter was 1.36 mm (95% CI: 1.19–1.54; P < .001) smaller for clinically hypoplastic ONs than for controls. Optic nerve diameter increased by 0.05 mm per year of age (95% CI: 0.03–0.07; P < .001). A lower bound to the 95% prediction interval for normal optic nerves was (2.24 mm + 0.052 × [age in years]) mm and excluded all but 1 case.
Conclusions
Age was independently associated with normal ON size by MRI and should be taken into consideration when evaluating ON hypoplasia, based on MRI criteria. We have provided a formula to assist clinicians in objectively determining if ON hypoplasia is present.
Optic nerve (ON) hypoplasia is a leading cause of childhood visual impairment in the United States and Europe. Children with bilateral ON hypoplasia usually present in infancy with poor vision and nystagmus, while unilateral or asymmetric ON hypoplasia may be detected later owing to strabismus. Indirect ophthalmoscopy is usually sufficient to diagnose severe ON hypoplasia, but in mild to moderate cases diagnosis is more challenging. Even when the optic disc is seen or fundus photography is obtainable, apparent optic nerve size may be misinterpreted owing to distortion from refractive error or variability in the axial length of the globe.
While magnetic resonance imaging (MRI) is usually obtained for known or suspected ON hypoplasia to evaluate a child for associated central nervous system abnormalities, few studies have investigated the usefulness of MRI as a diagnostic modality for ON hypoplasia and none have used objective measurements of optic nerve size in a large group of known ON hypoplasia patients with matched controls. Our goals were to evaluate the role of high-resolution, orbital MRI in documenting optic nerve size; to compare optic nerve size of ON hypoplasia cases and controls; and to attempt to establish a lower limit of normal for optic nerve size in a pediatric population based on MRI imaging.
Materials and Methods
Emory University Institutional Review Board (IRB) approval was obtained for this retrospective and prospective case-control series performed at 2 tertiary referral centers, the Emory Eye Center and the Children’s Healthcare of Atlanta at Egleston Department of Radiology. The Emory University IRB approved retrospective chart review for case patients at the Emory Clinic and at Children’s Healthcare of Atlanta at Egleston and the prospective enrollment of control patients using approved Informed Consent and Assent documents. The study was conducted in accordance with Health Insurance Portability and Accountability Act regulations. The records of pediatric patients (aged 0–17 years) with the diagnosis of optic nerve hypoplasia were retrospectively collected via a query of 2 electronic databases, 1 within the Emory University School of Medicine Department of Ophthalmology and the other within the Children’s Healthcare of Atlanta at Egleston Department of Radiology, that queried MRI reports. The Emory Eye Center database was queried from 2009 to 2011 using the ICD-9 code 743.10 for optic nerve hypoplasia. The Children’s Healthcare of Atlanta at Egleston Department of Radiology database was queried for the same time period using a keyword search for “optic nerve hypoplasia.” The ophthalmic medical records of the patients identified at Emory Eye Center were then retrospectively reviewed to confirm the clinical diagnosis of ON hypoplasia and to ensure that each patient did not meet any exclusion criteria. Exclusion criteria consisted of any abnormality of the central nervous system or eye other than isolated ON hypoplasia, history of brain or ocular surgery, prematurity (<34 weeks), or history of conditions associated with increased intracranial pressure (eg, meningitis, hydrocephalus). The results of the Radiology database search were reviewed to ensure patients had had an MRI of the orbits that included a volumetric, heavily T2-weighted orbital sequence. Results from both sites were then cross-referenced to ensure that all study patients had clinically documented ON hypoplasia and appropriate MRI sequences available for review. All patients clinically diagnosed with optic nerve hypoplasia at Emory Eye Center are referred for neuroimaging consisting of an MRI of brain and orbits with and without gadolinium as part of their routine management to rule out any associated central nervous system abnormality.
Control patients were prospectively enrolled. Informed consent was obtained from the parents of all study participants. Control cases consisted of patients undergoing MRI of the brain for neurologic indications not expected to affect the optic nerves. Children receiving sedation had a complete history and physical examination performed by the sedating physician; otherwise, parents documented a brief past medical history and list of medications for their child. The MRI requisition completed by the referring physician was reviewed. For patients not meeting exclusion criteria, consent to perform an additional volumetric heavily T2-weighted sequence through the orbits was then obtained from the accompanying parent by a pediatric neuroradiologist (N.K.D.). Control patients were scanned on either a Siemens 3.0T TrioTim (Siemens, Erlangen, Germany) or Siemens 1.5T Aera (Siemens). All control patients with the exception of 1, regardless of scanner, underwent a 3D T2 SPACE (Sampling Perfection optimized Contrasts using different flip angle Evolutions) sequence (TR/TE/ST 1090/73/0.3, matrix 320 × 274 at 3.0T or 1200/266/0.6, matrix 320 × 323 at 1.5T) through the orbits. One patient underwent a 3D T2 CISS (Constructive Interference in Steady State) sequence (TR/TE/ST 5.34/2.37/0.4, matrix 320 × 323 at 1.5T) through the orbits.
A pediatric neuroradiologist (N.K.D.) reviewed the noted MRI sequence through the orbits for case and control patients. The neuroradiologist was masked to the clinical diagnosis, including the clinical laterality of ON hypoplasia and the original radiology report in retrospective cases. For each case patient, only the T2-weighted sequence through the orbits was reviewed, whereas for the control patients, brain and orbit images were reviewed. Images of the orbits were then loaded into an advanced postprocessing software program (General Electric Advanced Workstation version 4.0, GE Healthcare, Little Chalfont, United Kingdom) within our institution’s patient archiving and communication systems. Before measuring the optic nerve, the neuroradiologist recorded whether or not subjective ON hypoplasia was present and on which side.
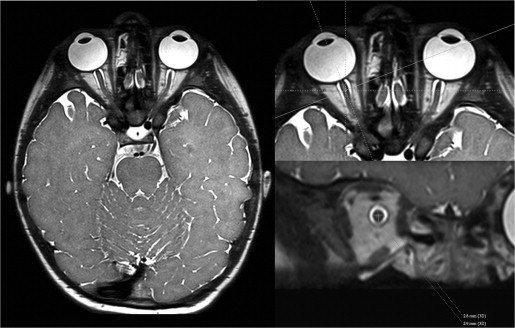
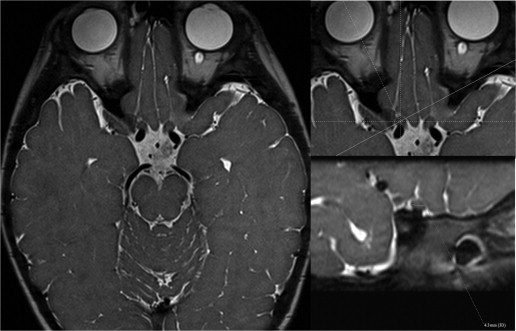
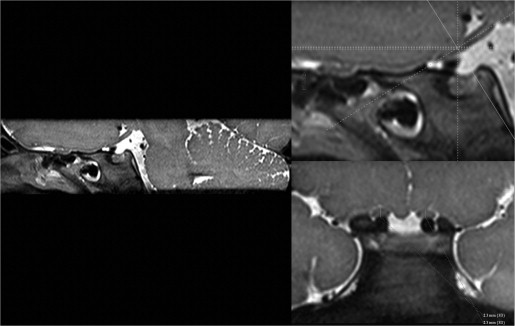
Bilateral measurements of the optic nerves were taken 5 mm posterior to the optic disc (intraorbital segment) and immediately posterior to the optic canal (prechiasmatic segment). Steps employed to ensure accurate and reproducible measurements orthogonal to the plane of the nerve included the following: For the intraorbital segment, a crosshair tool aligned along the anterior-posterior oblique plane of the nerve was used to reconstruct the nerve at 0.4–0.6 mm slice thickness in the orthogonal coronal oblique plane 5 mm posterior to the optic disc ( Figure 1 ). Within this plane, craniocaudal and transverse measurements were obtained on magnified images. Postprocessing was used to obtain an orthogonal measurement of the nerve. For the prechiasmic segment, the crosshair tool was aligned along the transverse oblique plane; the transverse measurement of the nerve was taken on magnified images immediately posterior to the posterior margin of the optic canal ( Figure 2 ). Postprocessing reconstruction to the craniocaudal axis was used to estimate the craniocaudal height just posterior to the posterior margin of the optic canal ( Figure 3 ).
Discrete margins of the nerve were required for measurements to be obtained. If the measurement could not be satisfactorily performed at the intended level or reasonably within 1–2 mm of the intended location, the nerve was deemed not measurable. The size of the optic canal in the transverse oblique plane was also recorded on the axial images. Once all measurements were recorded, the neuroradiologist reviewed his subjective preliminary diagnosis as to the presence and laterality of ON hypoplasia and determined whether or not the objective measurement would change his initial diagnosis. If applicable, a change in diagnosis was then recorded. Thirteen patients (26 eyes) consisting of a mix of cases and controls were randomly selected and remeasured in a masked fashion by the neuroradiologist. Patient demographics including sex and age of the patients at the time of the MRI study were also recorded.
Statistical Analysis
R: A Language and Environment for Statistical Computing (R Foundation for Statistical Computing; http://www.R-project.org ) was used for statistical analysis. Medians and interquartile ranges (IQRs) were reported for continuous data and percentages were reported for categorical data. Continuous variables were compared using the Mann-Whitney U or Kruskal-Wallis tests, as appropriate. Categorical variables were compared using χ 2 or Fisher exact test, as appropriate. Random intercept (for subject) mixed linear regression modeling was used for multivariate control with outcome of the mean of the 5 optic nerve measurements (craniocaudal and transverse intraorbital optic nerve, craniocaudal and transverse prechiasmatic, and transverse oblique optic canal). Intraclass correlation coefficients (ICC) were calculated to evaluate intra-observer agreement. P values less than .05 were considered significant.
Results
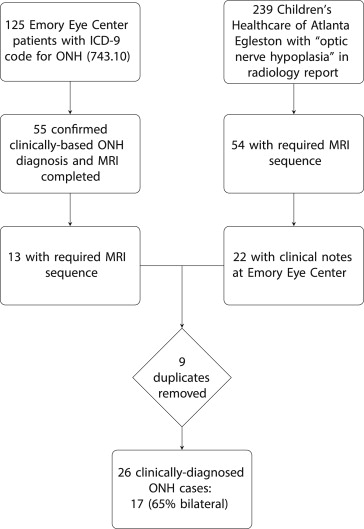
One hundred and twenty-five Emory Eye Center charts retrieved using the ICD-9 Code 743.10 (optic nerve hypoplasia) search 2009–2011 were reviewed ( Figure 4 ). Of these 125 patients, 55 (44%) had a clinical diagnosis of ON hypoplasia and documentation that MRI of the brain and orbits was performed. Thirteen of the 55 (24%) had appropriate MRI imaging sequences available for review at Children’s Healthcare of Atlanta at Egleston. Given the low yield of this search, the database of the Children’s Healthcare of Atlanta at Egleston Department of Radiology was also queried, using the same diagnosis code but for the time period 2007–2011. Fifty-four of 239 patients (23%) identified had the necessary imaging sequences available for review, and 22 of 54 (41%) had clinic notes available in the Emory Eye Center system. The patient lists resulting from the database searches at both institutions were cross-referenced and, once duplicates were excluded, a total of 26 cases with both retrievable clinical notes and the necessary MRI sequences confirming ON hypoplasia in 1 or both eyes had been identified.
Cases included 13 male and 13 female study patients with a median age of 1.1 years. In all 26 cases, the presenting complaint was eye misalignment, nystagmus, or apparent poor vision. Patients in the study group had undergone several similar types of volumetric high-resolution T2 sequences at a magnet strength of either 1.5T or 3.0T, as these patients underwent MRI at different time points over multiple years. Twelve patients underwent a 3D T2 FIESTA (Fast Imaging Employing Steady State Acquisition) sequence on a 1.5T GE Signa Excite. Four patients underwent a 3D T2 SPACE sequence and 5 patients underwent a 3D T2 CISS sequence on a 3.0T Siemens TrioTim.
Forty-two controls were screened, of whom 12 were excluded (6 owing to motion artifact, 3 owing to improper MRI sequence parameters, 1 with irretrievable images, 1 with previously abnormal MRI, and 1 with hemoglobin SC disease). Therefore, 30 control patients were analyzed (20 male/10 female, median age: 5.5 years). Indications for MRI included seizure without other medical problems, headache, and altered mental status. All control patients had normal MRI brain examinations and without abnormality on the obtained 3D T2 SPACE sequence through the orbits. Nineteen controls (63%) were evaluated using a 3.0 T magnet while the remainder were evaluated using a 1.5 T magnet. Intra-observer reliability for optic nerve measurements was very high (ICC: 0.98; 95% CI: 0.965–0.992).
Based on linear mixed-effects modeling controlling for age, case status, and magnet strength, mean optic nerve measurement was 1.36 mm (95% CI: 1.19 to 1.54; P < .001) smaller for clinically hypoplastic ONs than for controls ( Table ). Non-clinically affected optic nerves in patients with unilateral clinical ON hypoplasia had measurements that were 0.22 mm (95% CI: 0.002–0.44; P = .047) smaller than controls. ON size increased by 0.05 mm per year (95% CI: 0.03–0.07; P < .001). The linear lower bound to the 95% prediction interval for normal ONs was (2.24 mm + 0.052 × [age in years]) mm and discriminated all cases but 1 ( Figure 5 ).


