Purpose
Glaucoma accounts for more than 11% of all cases of blindness in the United States, but there have been few studies of economic impact. We examine incremental cost of primary open-angle glaucoma considering both visual and nonvisual medical costs over a lifetime of glaucoma.
Design
A decision analytic approach taking the payor’s perspective with microsimulation estimation.
Methods
We constructed a Markov model to replicate health events over the remaining lifetime of someone newly diagnosed with glaucoma. Costs of this group were compared with those estimated for a control group without glaucoma. The cost of management of glaucoma (including medications) before the onset of visual impairment was not considered. The model was populated with probability data estimated from Medicare claims data (1999 through 2005). Cost of nonocular medications and nursing home use was estimated from California Medicare claims, and all other costs were estimated from Medicare claims data.
Results
We found modest differences in the incidence of comorbid conditions and health service use between people with glaucoma and the control group. Over their expected lifetime, the cost of care for people with primary open-angle glaucoma was higher than that of people without primary open-angle glaucoma by $1688 or approximately $137 per year.
Conclusions
Among Medicare beneficiaries, glaucoma diagnosis not found to be associated with significant risk of comorbidities before development of visual impairment. Further study is necessary to consider the impact of glaucoma on quality of life, as well as aspects of physical and visual function not captured in this claims-based analysis.
Glaucoma accounts for more than 11% of all cases of blindness in the United States, making it the second most common cause of blindness in this country. The various glaucomas have been estimated to affect more than 2.2 million Americans older than 40 years, with primary open-angle glaucoma (POAG) being the most common form. Black persons are 3 to 5 times more likely to have the disease than white persons, and glaucoma is the leading cause of blindness among black persons. Despite the public health importance of glaucoma, there have been few studies of the economic impact of the disease in the United States, contributing to a belief that the disease has little impact on visual function or health care costs in its early stages.
Estimating the economic burden of disease to support decision making by health policy makers is the purpose of cost of illness studies. In the visual sciences, there recently have been a number of reports updating previous work in estimating the cost of visual impairment. Javitt and associates estimated the cost of visual impairment (defined as severe impairment in at least 1 eye) to the United States Medicare system, focusing on increased use of nonocular health services among those with visual impairment. Frick and associates examined the use of all health services, as well as informal care and loss of quality of life, among those who reported themselves as blind or visually impaired in the Medical Expenditure Panel Survey. Perhaps the most extensive recent effort was by Rein and associates, who used a modeling technique to estimate the total cost of vision problems in adults (including refractive error) in the United States, including direct and indirect medical costs, lost tax revenue, and productivity loss.
Each of these studies examined different aspects of the cost of visual impairment, and the reports by Javitt and associates and Frick and associates had an intriguing common finding. Both reports found a substantial increase in non–vision-related health care charges among people with visual impairment over those who did not report visual impairment. With one exception, which examined these relationships in commercial insurance patients, this relationship has remained unexplored among people with glaucoma, with most cost of illness studies focusing on direct medical costs related to glaucoma care (i.e., medication, examinations, and surgery).
In their investigations, Javitt and associates and Frick and associates both examined a limited aspect of the economic burden of visual impairment. Javitt and associates relied on Medicare claims data before 2003, a period during which there was limited coverage for prescription drugs used in care of vision problems. Additionally, Medicare has a very limited nursing home benefit. Frick and associates also relied on a home-dwelling sample, meaning their estimates did not consider costs associated with nursing home or skilled nursing facilities. However, previous work has shown that the visually impaired are at higher risk of nursing home admission. If it is shown that this also holds true among people in earlier stages of disease, the cost to payors (or the individual patient) would be substantial.
For this report, we examined the incremental cost of illness associated with POAG considering both direct and indirect medical costs over the lifetime of a person with glaucoma. We conducted our analyses from the payor’s perspective, using data from Medicare and Medicaid. We used a microsimulation decision analytic approach to model the disease process while incorporating data from numerous sources, in particular, the cost of prescription drugs and expenditures for long-term care services.
Methods
Data Source and Study Population
The probability of the events of interest (e.g., incidence of a comorbid condition, admission to a health service) and the annual cost of care of someone with the condition (other than a nursing home admission or the annual cost of pharmaceuticals) were estimated from a 5% random sample of Medicare beneficiaries in the Physician/Supplier Part-B files from January 1, 1999, through December 31, 2005 (the 5% Standard Analytical Files of the Medicare Limited Data Set; see http://www.resdac.umn.edu/Medicare/data_file_descriptions.asp ). A sample of beneficiaries 65 years of age or older was selected. For this study, the POAG cohort included beneficiaries in the 5% Standard Analytical Files with a claim that included the International Classification of Diseases, Ninth Edition (ICD-9), code of 365.11 in 2001, and a claim with the same code in 1999 or 2000. By doing this, we attempted to control for incorrect coding of cases in 2001. We excluded people with moderate or severe visual impairment from this sample. Therefore, anyone with a claim including the ICD-9 code for visual impairment (i.e., ICD-9 code 369.XX) from 1999 through 2001 was excluded. We created the control cohort by matching 1:1 with the POAG cohort for age, gender, race (black vs not black) and the participant’s Centers for Medicare and Medicaid Services region. In addition, we controlled for comorbidity between the 2 groups by calculating an unweighted Charlson index score. We matched participants by their Charlson score, based on a score of 0, 1, or 2 or more. Inclusion in the control cohort required that the person be without POAG in any year from 1999 through 2005 and without moderate or severe visual impairment from 1999 through 2001.
Additional exclusion criteria for both cohorts included a claim in 2001 for depression, dementia, hip fracture, or other fracture (nonhip; see Technical Appendix for an ICD-9 definition of each condition at http://ceem.wustl.edu/LinkClick.aspx?fileticket=OghOpmsKJCg%3d&tabid=85 ). We excluded people who filed claims for services at a nursing home or a skilled nursing facility or for home health care services during 2001, as well as anyone enrolled in a Medicare health maintenance organization from 1999 through 2005.
During the period considered in the study, Medicare did not provide pharmacy benefits, nor did the program provide substantial coverage for nursing home care. However, state Medicaid programs did provide coverage for medication and nursing home services during the study period. Therefore, we estimated the annual cost of pharmaceuticals for people with the conditions of interest and the health care costs of people with a nursing home admission using data from the California Medicaid (Medi-Cal) claims database. We made the assumption, supported by the work of Hunt and associates that this would represent a conservative estimate of the cost of medication compared with Medicare and private payors. The purpose of our investigation was to determine the incremental cost of nonvision care for people with glaucoma resulting from an increased risk of other systemic conditions. Therefore, both the control and POAG cohorts were assumed to begin with the same baseline costs, and no consideration was given to the increased cost of POAG because of ocular medications.
Markov Decision Model
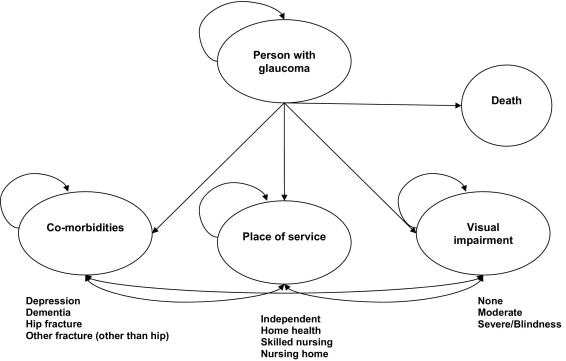
We modeled the lifetime cost of visual impairment resulting from POAG with an attributable cost approach by using a Markov decision model and a microsimulation process to compare the cost of care for people with POAG with that of a control group of people who did not have POAG. In this study, we defined attributable cost as the difference in cost between those beneficiaries with POAG and those without POAG that remains after accounting for other identifiable sources of difference other than POAG. For the purpose of this investigation, POAG is coded with 365.11 on Medicare claims using the ICD-9 convention. We modeled the increased risk and associated costs of the occurrence of the events reported to be associated with increased visual impairment. Specifically, we examined depression, dementia, hip fracture, fractures other than of the hip, nursing home admission, and home health use. We also considered skilled nursing facility admission and increased incidence of moderate and severe visual impairment and blindness. For this study, we defined moderate and severe visual impairment according to the standards of the ICD-9 codes (369.x). According to these standards, moderate vision loss is considered to be present if there is severe impairment in one eye and normal to near-normal vision in the other, whereas severe vision loss is considered to be present if there is severe impairment in the best-seeing eye. Blindness is considered to be present if there is profound impairment in both eyes.
The Markov model is an analytic tool that allows an investigator to estimate the costs and consequences of a disease process. We modeled the disease progression in a cohort of people with a particular condition from the time of diagnosis. During a Markov cycle (e.g., 1 year), each living cohort member is exposed to the risks, benefits, and costs associated with the progression and treatment of a disease as they progress through associated health states. During each cycle, a proportion of people die as estimated from actuarial sources. The Markov model used in this investigation is illustrated in the Figure .
Estimation of the Markov model was conducted using a microsimulation approach. In such an approach, the model is iteratively estimated at the level of the individual behavioral entity, in this case the patient. A hypothetical cohort of patients is followed throughout the study time horizon (in this case, the remainder of the hypothetical person’s life span), thus mathematically replicating the conditions of a clinical trial with each individual in the cohort preceding through the model on an individual basis. The microsimulation approach includes randomized individual patient characteristics and tracks the progress of individual patients through particular health states in terms of health outcomes and costs. Thus, it better replicates the degree of random variation seen in a natural setting than the traditional decision analytic modeling process.
The Markov model was stratified by age and gender, with the initial age and gender distribution of the individuals in the model equal to those of the people identified with POAG in the Medicare claims database. Each person in the Markov model began in a health state without moderate or severe visual loss, and we assumed that the distribution of severity of POAG among members of the POAG cohort at baseline reflected that seen in Medicare beneficiaries, and therefore we could rely on the rate of incidence of visual impairment seen in the Medicare sample to estimate the rate of progression from simple glaucoma to glaucoma with visual impairment. During a cycle, each cohort member was permitted to transition to a new health state that represents visual impairment, one or more of the following events, or both: depression, dementia, hip fracture, other fracture, home health use, skilled nursing facility admission, or nursing home admission. As there has been no strong evidence reported indicating differential mortality associated with glaucoma; the mortality rates used in the Markov model reflected those observed in the control sample drawn from the Medicare claims database. We made the assumption that those who die during a cycle die at the beginning of the year. All transition probabilities were calculated as Kaplan-Meier estimates of the number of people in the cohort subgroup having at least 1 claim for the condition of interest during the follow-up (2001 through 2005). To create a probabilistic estimate for the microsimulation model, the transition probability was parameterized using a binomial distribution. With the exception of those cohort members in whom dementia develops, the transition probability for a health event did not depend on whether the individual experienced any health events in the previous year. Because there is no known cure for dementia, a person who advanced to that condition remained in that state until death (while still facing risk of other events). In the same manner (and for the same reason), cohort members who progressed to moderate or severe visual impairment could not improve from that condition for their remaining lifetime.
When a condition first developed in a cohort member, they were assigned a cost that we refer to as the incidence cost. Cohort members in whom the condition developed a second or third time in a later cycle or, as in the case of dementia, continued to experience the disease in later cycles were assigned a lower cost (prevalence cost). We did this to recognize the increased cost in management of a condition when it is first diagnosed, as opposed to maintenance costs of a chronic condition. We made the conservative assumption that the cost of managing someone with a chronic condition is not influenced by their underlying POAG. Therefore, the cost associated with the comorbid conditions and other events were calculated from the claims records in the control cohort. Incidence costs were calculated based on the costs of care for 12 months after the first claim for an event. Prevalence costs were calculated by taking the average cost of care in 1 year for a cohort of people with a claim for that condition. Additionally, we calculated the incremental costs of each health event. Because costs for the health event included all costs that the beneficiary incurred in a given year, it would be easy to double-count healthcare costs if a person experienced 2 health events in 1 year. To account for this, we subtracted the cost of living 1 cycle without experiencing a health event from the cost of living a cycle with one of the aforementioned health events. This is an estimate of the cost of care related only to the health event.
The two simulated cohorts, each with 10 000 members individually walked through the Markov model, repeating cycles until they died. The cost and events experienced by each cohort member were recorded, and the mean and median difference in costs between the cohorts was estimated along with the 95% confidence interval (for the mean difference) and 95% range of values (for the median difference).
Further details of the methods and analyses in this study are provided in the Technical Appendix to this report, available at http://ceem.wustl.edu/LinkClick.aspx?fileticket=OghOpmsKJCg%3d&tabid=85 .
Results
The average starting age of the members of our constructed cohorts was 78.4 years, with 54.75% of members being female. Cohort members lived an average of 12.3 years. The incidence rates for events estimated from the Medicare claims records are detailed in Table 1 . The only events that were seen more frequently in one group rather than the other was home health care use and vision loss. In both cases, people with glaucoma were more likely to have the event than were members of the control cohort. Interestingly, people with glaucoma had lower mortality than did people without glaucoma. If we incorporated this lower mortality into the model, it would increase the cost of glaucoma because of greater exposure to health events in the POAG cohort. Because there is no evidence of differential mortality in people with glaucoma, we chose to incorporate the mortality estimates found in the control cohort for both groups to provide the most conservative estimate of the difference in cost between the 2 groups.
| Age at Baseline (years) | Sample Size | Annual Incidence Rates | |||||||||
|---|---|---|---|---|---|---|---|---|---|---|---|
| Depression | Dementia | Hip Fracture | Any Fracture a | Nursing Home | Skilled Nursing Facility | Home Healthcare | Moderate Visual Loss | Severe Visual Loss and Blindness | Death | ||
| Glaucoma cohort | |||||||||||
| Male | |||||||||||
| 65 to 69 | 1459 | 0.022 | 0.012 | 0.003 | 0.022 | 0.006 | 0.013 | 0.146 | 0.006 | 0.002 | 0.021 |
| 70 to 79 | 6799 | 0.027 | 0.024 | 0.006 | 0.031 | 0.014 | 0.031 | 0.171 | 0.006 | 0.004 | 0.036 |
| 80+ | 4085 | 0.048 | 0.064 | 0.017 | 0.050 | 0.048 | 0.085 | 0.217 | 0.011 | 0.012 | 0.093 |
| Female | |||||||||||
| 65 to 69 | 1802 | 0.035 | 0.011 | 0.004 | 0.037 | 0.007 | 0.014 | 0.164 | 0.005 | 0.002 | 0.012 |
| 70 to 79 | 9625 | 0.041 | 0.023 | 0.009 | 0.046 | 0.016 | 0.033 | 0.187 | 0.006 | 0.004 | 0.023 |
| 80+ | 7805 | 0.056 | 0.065 | 0.028 | 0.078 | 0.056 | 0.097 | 0.243 | 0.009 | 0.011 | 0.066 |
| Control cohort | |||||||||||
| Male | |||||||||||
| 65 to 69 | 1459 | 0.023 | 0.010 | 0.003 | 0.022 | 0.007 | 0.014 | 0.121 | 0.003 | 0.001 | 0.028 |
| 70 to 79 | 6799 | 0.028 | 0.023 | 0.005 | 0.028 | 0.015 | 0.032 | 0.154 | 0.003 | 0.001 | 0.042 |
| 80+ | 4085 | 0.043 | 0.066 | 0.016 | 0.048 | 0.042 | 0.086 | 0.212 | 0.005 | 0.004 | 0.103 |
| Female | |||||||||||
| 65 to 69 | 1802 | 0.031 | 0.010 | 0.004 | 0.035 | 0.007 | 0.018 | 0.139 | 0.002 | 0.002 | 0.018 |
| 70 to 79 | 9625 | 0.043 | 0.025 | 0.009 | 0.046 | 0.016 | 0.032 | 0.167 | 0.003 | 0.002 | 0.024 |
| 80+ | 7805 | 0.056 | 0.070 | 0.030 | 0.076 | 0.055 | 0.095 | 0.227 | 0.005 | 0.005 | 0.075 |
The costs of events are detailed in Table 2 . Among comorbidities, the event with the highest incidence cost was hip fracture, followed by depression and dementia. We found similar relationships among the prevalence costs. Among other events, admission to a nursing home or skilled nursing facility was the most costly. Home health care services, the event with the highest frequency, was found to have an incidence cost of $15 814 among men and $11 359 among women. For most conditions, men had a higher cost than women. This is a relationship that has not been reported previously.
| Comorbidity/Event | Male | Female | ||||||||||
|---|---|---|---|---|---|---|---|---|---|---|---|---|
| Incidence Cost | Prevalence Cost | Drug Cost | Incremental Incidence Cost | Incremental Prevalence Cost | Incremental Drug Cost | Incidence Cost | Prevalence Cost | Drug Cost | Incremental Incidence Cost | Incremental Prevalence Cost | Incremental Drug Cost | |
| Control a | — | $7586 | $1456 | — | — | — | — | $6127 | $1463 | — | — | — |
| Depression | $31 341 | $10 889 | $3936 | $23 755 | $3303 | $2480 | $18 135 | $8552 | $4177 | $12 008 | $2425 | $2714 |
| Dementia | $23 730 | $11 544 | $3231 | $16 144 | $3958 | $1776 | $20 321 | $8 538 | $3146 | $14 194 | $2412 | $1683 |
| Hip fracture | $31 828 | $15 022 | $3324 | $24 241 | $7436 | $1869 | $35 130 | $12 066 | $3290 | $29 003 | $5939 | $1826 |
| Any fracture (excluding hip) | $20 635 | $9744 | $3481 | $13 048 | $2157 | $2026 | $18 201 | $7891 | $3402 | $12 074 | $1764 | $1938 |
| Nursing home b | $48 679 | $16 560 | — | $41 092 | $8973 | — | $39 058 | $12 807 | — | $32 931 | $6680 | — |
| Skilled nursing facility | $47 792 | $19 670 | $3508 | $40 205 | $12 084 | $2053 | $39 566 | $16 329 | $3462 | $33 439 | $10 202 | $1999 |
| Home healthcare | $23 401 | $14 232 | $3020 | $15 814 | $6646 | $1564 | $17 689 | $12 351 | $3876 | $11 563 | $6224 | $2413 |
| Moderate visual impairment | $16 589 | $9183 | $2387 | $9003 | $1597 | $931 | $17 486 | $7492 | $3892 | $11 359 | $1365 | $2428 |
| Severe visual impairment or blindness | $24 496 | $9599 | $3841 | $16 910 | $2013 | $2385 | $16 543 | $9669 | $3257 | $10 416 | $3542 | $1794 |
Stay updated, free articles. Join our Telegram channel

Full access? Get Clinical Tree


