Purpose
To evaluate the effects of corneal biomechanical properties on intraocular pressure (IOP) measured with the ICare, and to compare IOP readings obtained with ICare, Ocular Response Analyzer (ORA), and Goldmann applanation tonometry (GAT) in normal-tension glaucoma (NTG) and normal subjects.
Design
Prospective, cross-sectional, comparative study.
Methods
IOP was measured with ICare, ORA, and GAT. All subjects had corneal hysteresis (CH) and corneal resistance factor (CRF), which were measured with ORA; and central corneal thickness (CCT), axial length, spherical equivalent, and keratometry.
Results
This study enrolled 97 eyes of 97 NTG patients and 89 eyes of 89 normal subjects. CCT, CH, and CRF in NTG patients were significantly lower than those in normal subjects ( P = .033, P = .006, and P = .003). The difference in IOP between techniques was highly significant in NTG patients ( P < .001), while there was no significant difference in IOP values between techniques in normal controls ( P = .931). ICare readings were significantly lower than corneal-compensated IOP in NTG patients ( P = .014). CH and CRF were significantly associated with IOP measurements with ICare in NTG and normal subjects ( P < .001). The greater difference between IOPcc and ICare in NTG patients was significantly influenced by the lower CH ( P < .001).
Conclusions
Since ICare is a convenient way to measure IOP, ICare is a reasonable option as an alternative tonometer in NTG patients. However, the clinician must consider that the corneal biomechanical characteristics in NTG can cause ICare to underestimate IOP.
The ICare rebound tonometer (Tiolat, Helsinki, Finland), which is based on the impact-induction principle, is becoming a widely used intraocular pressure (IOP)-measuring device. The corneal application of the tip with ICare is extremely fast and no corneal anesthesia is required; the ICare tonometer can be conveniently used to measure IOP in poorly cooperative patients and in children.
The Ocular Response Analyzer (ORA; Reichert Ophthalmic Instruments, Buffalo, New York, USA) is designed to measure IOP more accurately than other techniques by quantifying the differential inward and outward corneal response to an air pulse. In addition, the corneal biomechanical properties corneal hysteresis (CH) and corneal resistance factor (CRF) can be measured with the ORA. It has been suggested that changes in corneal biomechanical factors are associated with the development and progression of glaucoma.
IOP measurements can be influenced by central corneal thickness (CCT) and corneal biomechanical properties. Numerous studies demonstrated that the ICare tonometer agreed well with Goldmann applanation tonometry and was dependent on CCT.
Two studies have reported the relationship between ICare readings and corneal biomechanical properties. Chui and associates indicated that ICare readings were affected by CH and CRF but not by CCT. Jorge and associates reported that corneal hysteresis, corneal resistance factor, and CCT are significantly correlated with IOP levels as measured by ICare. However, normal volunteers alone were included as the subjects and the relationships between ICare and corneal biomechanical properties in glaucomatous eyes were not assessed.
Corneal hysteresis is significantly lower and corneal-compensated IOP is significant higher in normal-tension glaucoma (NTG) patients than in normal subjects. In addition, Goldmann applanation tonometry (GAT) and corneal-compensated IOP may be greater in NTG patients than in either normal- or high-tension glaucoma eyes. Therefore, the relationships between ICare and corneal-compensated IOP may be different in NTG eyes compared to normal eyes, but there are no published reports regarding the relationship between ICare and corneal-compensated IOP in glaucomatous eyes.
The purpose of this study is to investigate the effects of corneal biomechanical properties on IOP measurements with ICare and to compare IOP measurements that are made with ICare, ORA, and Goldmann applanation tonometry in patients with NTG.
Materials and Methods
This was a prospective, cross-sectional, comparative study. From January 3 through July 11 2013, glaucoma patients and healthy individuals were enrolled from the Glaucoma Clinic in the Pusan National University Hospital. Age-matched healthy controls were recruited among those who visited our hospital for regular health check-ups or refractive errors. They were defined as those with no history of ocular disease, IOP ≤21 mm Hg, an absence of glaucomatous optic disc appearance, and a normal visual field. After the purpose and procedures of the study were fully explained, each patient gave consent to participate in the study. The study was performed in accordance with the tenets set forth in the Declaration of Helsinki and was approved by the Institutional Review Board at Pusan National University Hospital. This study is registered as an International Standard Randomized Controlled Trial, number ISRCTN16912051. In cases in which both eyes of a subject were eligible, 1 eye was chosen randomly for inclusion.
All enrolled glaucoma patients and healthy individuals underwent a complete ophthalmologic examination, including measurement of best-corrected visual acuity (BCVA), slit-lamp examination, axial length, gonioscopy, and funduscopy. CCT was measured by ultrasonic pachymetry (Micropach; Sonomed, New Hyde Park, New York, USA). Keratometry and spherical equivalent were measured with an Auto Kerato-Refractometer (ARK-510A; NIDEK, Hiroishi, Japan). Automated visual field examination was performed on all subjects with the 30-2 SITA standard program on a Humphrey 740 Visual Field Analyzer (Carl Zeiss Meditec, Dublin, California, USA). All patients had red-free photographs, optic disc stereo photographs, and Fourier-domain optical coherence tomography (Cirrus; Carl Zeiss Meditec). The inclusion criteria for the subjects in the present study included age >18 years with clear corneas and clear ocular media, BCVA ≥20/40, refractive error within ±5.0 diopter (D) of 0, and astigmatism ±3.0 D of 0. Exclusion criteria included diabetes, uveitis, secondary glaucoma, corneal abnormalities, nonglaucomatous optic neuropathies, previous trauma, ocular surgery or laser treatment, or any other eye diseases other than glaucoma.
All subjects underwent IOP measurements in the sitting position with ICare, ORA, and Goldmann applanation tonometry by 2 observers who were masked to the IOP readings obtained. ICare and ORA measurement were conducted in random order. IOP measurements with Goldmann applanation tonometry and CCT measurements with ultrasonic pachymetry, which require topical anesthesia (Alcaine; Alcon, Ft Worth, Texas, USA), were carried out after the IOP measurements with ICare and ORA.
To take IOP measurements with the ICare tonometer, the subject was asked to look straight ahead, and the probe was placed within 5–8 mm of the cornea. Six readings were taken and an average value was generated automatically. The tonometer has a built-in system to indicate if there is any discrepancy among these 6 readings. For this study all measurements with any type of error sign (bar) were discarded. The 3 mean IOP measurements that were without error sign (bar) were obtained and averaged. Measurements were conducted on the central cornea.
The examiner carried out corneal hysteresis, corneal resistance factor, Goldmann-correlated IOP, and corneal-compensated IOP, using ORA. This method allows 2 applanation points during a single measurement process. The first applanation pressure point (P1) occurs as the air puff pushes the cornea inward and the second applanation pressure point (P2) occurs as the cornea returns from the applanated state to normal. Corneal hysteresis is defined as the difference between these 2 pressures (P1 − P2), and the average of the inward and outward applanation pressures is defined as the Goldmann-correlated IOP. Corneal-compensated IOP is a measure of IOP that uses the new information provided by the corneal hysteresis measurement to provide an IOP that is less affected by corneal properties. The corneal resistance factor is derived as a parameter that reflects the overall resistance of the cornea to deformation.
A minimum of 4 ORA readings of good quality with symmetric peak heights, a similar width, and a waveform score of more than 5.0 were required for study inclusion. An experienced investigator judged the response profile quality with the criteria provided by the manufacturer. The best signal value as selected by the computer software (ORA version 3.01) was used to eliminate selection bias.
After subjects were given topical anesthesia, the IOP was measured with Goldmann applanation tonometry, followed by measuring the CCT with ultrasonic pachymetry. Three reliable values within a range of ±2 mm Hg for GAT and ±5 μm for CCT were recorded.
The diagnosis of NTG was based on the following eligibility criteria: (1) untreated IOP ≤21 mm Hg at baseline visits, and at intervals of every 2 hours from 9 AM to 5 PM; (2) presence of glaucomatous optic nerve appearance, corresponding and typical visual field loss; and (3) open angles on gonioscopy. Patients with any IOP measurement greater than 21 mm Hg with GAT were excluded from the study.
All statistical analyses were performed with SPSS for Windows 21.0 (SPSS Inc, Chicago, Illinois, USA), except for the Bland-Altman analysis, which was performed with MedCalc version10.0 (MedCalc Software; Ostend, Mariakerke, Belgium). The assumption of data normality was checked with the Kolmogorov-Smirnov test. The Student t test or the Mann-Whitney U test was used to compare variables between the NTG and normal group. IOP readings were compared among ICare, corneal-compensated IOP, Goldmann-correlated IOP, and Goldmann applanation tonometry in each NTG group and the normal control group with repeated-measures analysis of variance (ANOVA), with the patient’s eye as a within-subject variable. Bonferroni correction was used to adjust the P values for multiple comparisons among different tonometers. The intraobserver reliability of IOP measurements with all IOP devices was assessed with the intraclass correlation coefficient (ICC). A Bland-Altman plot was applied to evaluate the agreements among IOP readings in both groups. Pearson correlation coefficients or Spearman rho were calculated to evaluate correlations between IOP measurements and multiple variables, including age, spherical equivalent, keratometry, CCT, corneal hysteresis, corneal resistance factor, and axial length. Multiple linear regression analysis with stepwise variable selection was used to identify significant associations. P values <.05 were considered statistically significant.
Results
This study enrolled 97 patients (97 eyes) with NTG who fulfilled the eligibility criteria and 89 subjects (89 eyes) in the normal healthy control group. At the time of enrollment, 50 eyes (51.5%) received monotherapy for lowering IOP, and combined therapies with ≥2 IOP-lowering medications were required in 47 eyes (48.5%). In 50 eyes with monotherapy, 30 cases used prostaglandin analogues as monotherapy, 15 cases received an α2-agonist, and 5 cases used a topical carbonic anhydrase inhibitor. In cases with combination treatment, 46 eyes were treated with a β-blocker, 41 eyes with a topical carbonic anhydrase inhibitor, 17 eyes with a prostaglandin analogue, and 17 eyes with an α2-agonist.
All demographic data of the subjects are summarized in Table 1 . There were no significant differences in sex, age, spherical equivalent, keratometry, and axial length between NTG patients and normal subjects. However, CCT, corneal hysteresis, and corneal resistance factor in NTG patients were significantly lower than in normal subjects ( P = .033, P = .006, and P = .003, respectively). Visual field mean deviation (MD), pattern standard deviation (PSD), and visual field index (VFI) were significantly worse in NTG patients than in normal controls ( P < .001).
| NTG Patients | Normal Controls | P Value | |
|---|---|---|---|
| Subjects (n) | 97 | 89 | |
| Male/female | 52/45 | 44/45 | .099 a |
| Age (y) | 52.24 ± 14.48 | 49.0 ± 16.07 | .151 b |
| Spherical equivalent (diopter) | −2.04 ± 3.23 | −1.81 ± 3.07 | .609 c |
| Keratometry (diopter) | 43.65 ± 1.68 | 43.54 ± 1.32 | .616 b |
| Axial length (mm) | 24.33 ± 1.68 | 23.99 ± 3.04 | .383 c |
| CCT (μm) | 548.3 ± 34.82 | 558.77 ± 31.19 | .032 b |
| CH (mm Hg) | 9.90 ± 1.66 | 10.59 ± 1.71 | .006 b |
| CRF (mm Hg) | 9.71 ± 1.84 | 10.53 ± 1.91 | .003 b |
| MD (dB) | −6.67 ± 3.62 | −1.63 ± 1.85 | <.001 b |
| PSD (dB) | 6.49 ± 4.77 | 2.04 ± 1.17 | <.001 b |
| VFI (%) | 84.92 ± 17.26 | 98.13 ± 3.42 | <.001 b |
The ICC of IOP readings with ICare, Goldmann-correlated IOP, corneal-compensated IOP, and Goldmann applanation tonometry were excellent in both groups. In the NTG group, ICCs were 0.985, 0.864, 0.941, and 0.918, respectively; and in normal subjects they were 0.949, 0.885, 0.925, and 0.903, respectively.
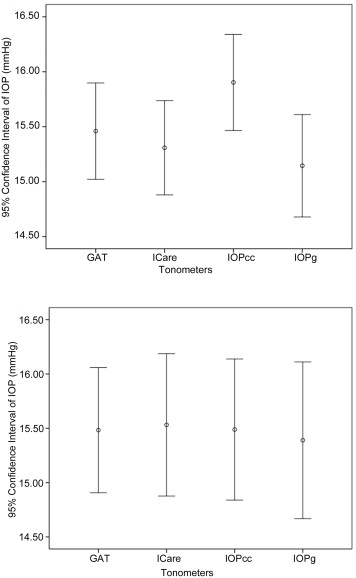
The mean IOP levels with ICare, Goldmann-correlated IOP, corneal-compensated IOP, and Goldmann applanation tonometry in both groups are shown in Table 2 . There was no significant difference in the IOP levels with ICare, Goldmann-correlated IOP, corneal-compensated IOP, and Goldmann applanation tonometry between the 2 groups. Because corneal hysteresis, corneal resistance factor, and CCT were significantly different between NTG patients and normal subjects, we compared these parameters with adjusted means of IOP measurements obtained with ICare, ORA, and GAT between the 2 groups with analysis of covariance (ANCOVA). The adjusted IOP levels with ICare, Goldmann-correlated IOP, corneal-compensated IOP, and Goldmann applanation tonometry were not significantly different between the 2 groups ( P = .382, P = .289, P = .691, and P = .723, respectively).
| NTG Patients | Normal Controls | P Value a Between NTG and Normal Groups | |
|---|---|---|---|
| ICare | 14.71 ± 3.19 | 15.53 ± 3.22 | .078 |
| IOPcc | 15.60 ± 3.25 | 15.49 ± 3.08 | .806 |
| IOPg | 14.47 ± 3.46 | 15.39 ± 3.42 | .069 |
| GAT | 14.94 ± 3.27 | 15.48 ± 2.73 | .221 |
| P value b among ICare, IOPcc, IOPg, and GAT | <.001 | .931 |
The difference in IOP between techniques was highly significant in NTG patients (repeated-measures ANOVA, P < .001). However, the difference in IOP between the techniques was not significant in normal control groups (repeated-measures ANOVA, P = .931) ( Table 2 ). Corneal-compensated IOP was significantly higher than IOP readings with ICare and Goldmann-correlated IOP in NTG patients ( P = .014, P < .001, respectively; adjusted by Bonferroni correction for multiple comparisons) ( Figure 1 ).
We compared the difference between ICare IOP and IOP readings with ORA and between ICare IOP and GAT (ICare − corneal-compensated IOP, ICare − Goldmann-correlated IOP, ICare − Goldmann applanation tonometry, respectively) in both groups ( Table 3 ). The difference between ICare and corneal-compensated IOP was −0.89 ± 2.80 in NTG patients and 0.04 ± 2.77 in normal controls. ICare demonstrated smaller values than corneal-compensated IOP in NTG patients and ICare was slightly higher than corneal-compensated IOP in normal controls ( P = .024).
| NTG Patients | Normal Controls | P Value a Between Groups | |
|---|---|---|---|
| ICare − IOPcc | −0.89 ± 2.80 | 0.04 ± 2.77 | .024 |
| ICare − IOPg | 0.25 ± 2.60 | 0.14 ± 2.50 | .783 |
| ICare − GAT | −0.23 ± 2.31 | 0.05 ± 2.28 | .415 |
| IOPcc − IOPg | 1.14 ± 1.95 | 0.10 ± 2.01 | <.001 |
| IOPcc − GAT | 0.66 ± 2.83 | 0.01 ± 2.61 | .101 |
Correlation coefficients were calculated to evaluate the effects of age, CCT, spherical equivalent, keratometry, axial length, corneal hysteresis, and corneal resistance factor on IOP measurements with ICare, ORA, and Goldmann applanation tonometry in both groups ( Tables 4 and 5 ). IOP readings with ICare were positively correlated with corneal resistance factor, CCT, and axial length in NTG patients ( P < .001, P < .001, P = .001, respectively), and corneal hysteresis, corneal resistance factor, and CCT ( P = .018, P < .001, P < .001, respectively) in normal controls. IOP readings with ICare were negatively correlated with age and spherical equivalent in NTG patients ( P < .001, P = .003, respectively) and with spherical equivalent in normal subjects ( P = .006).
| Age | SE | K | AXL | CCT | CH | CRF | ICare | IOPcc | IOPg | |
|---|---|---|---|---|---|---|---|---|---|---|
| SE | 0.697 a , c | |||||||||
| K | 0.246 a | 0.146 a | ||||||||
| AXL | −0.580 a , c | −0.731 a , c | −0.531 a | |||||||
| CCT | −0.385 a | −0.416 a , c | −0.014 | 0.414 a , c | ||||||
| CH | −0.075 | −0.098 c | 0.308 a | −0.049 c | 0.351 a | |||||
| CRF | −0.312 a | −0.288 a , c | 0.207 b | 0.167 a | 0.531 a | 0.812 a | ||||
| ICare | −0.418 a | −0.346 a , c | −0.023 | 0.275 a , c | 0.446 a | 0.025 | 0.452 a | |||
| IOPcc | −0.369 a | −0.287 a , c | −0.196 b | 0.333 a , c | 0.174 b | −0.425 a | 0.138 | 0.569 a | ||
| IOPg | −0.471 a | −0.396 a , c | −0.044 | 0.342 a , c | 0.474 a | 0.092 | 0.615 a | 0.689 a | 0.834 a | |
| GAT | −0.459 a | −0.446 a , c | −0.017 | 0.354 a , c | 0.601 a | 0.057 | 0.493 a | 0.771 a | 0.624 a | 0.774 a |
| Age | SE | K | AXL | CCT | CH | CRF | ICare | IOPcc | IOPg | |
|---|---|---|---|---|---|---|---|---|---|---|
| SE | 0.591 a , c | |||||||||
| K | 0.265 a | 0.203 b , c | ||||||||
| AXL | −0.167 | −0.597 a , c | −0.151 | |||||||
| CCT | −0.239 b | −0.227 b , c | −0.154 | −0.008 | ||||||
| CH | −0.178 b | −0.085 c | −0.033 | −0.014 | 0.388 a | |||||
| CRF | −0.165 | −0.129 c | −0.033 | 0.058 | 0.543 a | 0.849 a | ||||
| ICare | −0.173 | −0.163 b , c | −0.135 | 0.093 | 0.472 a | 0.223 b | 0.549 a | |||
| IOPcc | 0.036 | −0.125 c | −0.006 | 0.090 | 0.231 b | −0.372 a | 0.152 | 0.600 a | ||
| IOPg | −0.064 | −0.180 b , c | 0.002 | 0.131 | 0.489 a | 0.162 | 0.655 a | 0.711 a | 0.814 a | |
| GAT | −0.056 | −0.092 c | 0.052 | 0.055 | 0.580 a | 0.189 b | 0.555 a | 0.702 a | 0.605 a | 0.777 a |
Stay updated, free articles. Join our Telegram channel

Full access? Get Clinical Tree


