Purpose
To describe an economic (Ec) model for estimating the impact of screening and treatment for retinopathy of prematurity (ROP).
Design
EcROP is a cost-effectiveness, cost-utility, and cost-benefit analysis.
Methods
We surveyed caregivers of 52 children at schools for the blind or pediatric eye clinics in Atlanta, Georgia and 43 in Mexico City. A decision analytic model with sensitivity analysis determined the incremental cost-effectiveness (primary outcome) and incremental monetary benefit (secondary outcome) of an ideal (100% screening) national ROP program as compared to estimates of current practice. Direct costs included screening and treatment expenditures. Indirect costs estimated lost productivity of caretaker(s) and blind individuals as determined by face-to-face surveys. Utility and effectiveness were measured in quality-adjusted life years and benefit in US dollars. EcROP includes a sensitivity analysis to assesses the incremental cost-effectiveness and societal impact of ROP screening and treatment within a country or economic region. Estimates are based on evidence-based clinical data and region-specific economic data acquired from direct field survey.
Results
In both Mexico and the United States, an ideal national ROP screening and treatment program was highly cost-saving. The incremental net benefit of an ideal ROP program over current practice is $5556 per child ($206 574 333 annually) and $3628 per child ($205 906 959 annually) in Mexico and the United States, respectively.
Conclusion
EcROP demonstrates that ROP screening and treatment is highly beneficial for quality of life, cost saving, and cost-effectiveness in the United States and Mexico. EcROP can be applied to any country or region to provide data for informed allocation of limited health care resources.
Retinopathy of prematurity (ROP) is a vision-threatening disorder affecting premature infants resulting from abnormal retinal vascular development. In later stages, fibrovascular proliferation leads to retinal detachment, visual impairment, and blindness. The estimated incidence of any ROP is 68% in premature infants in the United States weighing less than 1251 g.
In the United States, the standard of care is to screen premature infants born at ≤30 weeks’ gestational age or weighing ≤1500 g for ROP. Screening guidelines vary internationally, with higher birth-weight thresholds recommended in developing nations. For example, screening is recommended in India and Mexico for infants weighing less than 1750 g or those born at <34 weeks’ gestation. Effective screening and treatment clearly reduces ROP-related blindness. Nevertheless, ROP represents a major burden and remains a leading cause of childhood blindness worldwide.
In countries where infant mortality rates (IMRs) are <9/1000 live births (United States, Europe, Japan, Australia, South Korea, etc), ROP is less common and is due to lower rates of prematurity and diligent neonatal intensive care unit (NICU) management, along with effective screening and treatment programs delivered by experienced, well-trained professionals. Alternatively, countries with very high IMRs (>60/1000), such as those in sub-Saharan Africa, have low rates of ROP because NICUs are either limited or nonexistent. Thus, most premature infants do not survive. The third epidemic of ROP is taking place in middle-income countries with intermediate IMRs ranging from approximately 9/1000 to 60/1000, predominantly located in Latin America, Asia, and Eastern Europe. In Mexico, approximately 24% of childhood blindness occurs as a result of ROP.
In Latin America, both low screening penetrance and limited resources contribute to this epidemic. A 2002 multicenter study of 11 NICUs in Latin America indicated that there is a 42% rate of ROP among very low birthweight (VLBW) infants, with only 68% screening penetrance. In Brazil, the 2014 screening penetrance was estimated to be approximately 52% ; our model assumes similar penetrance in Mexico.
The model we propose in this study is an economic (Ec) methodology for ROP screening and treatment analysis, or “EcROP,” that uses decision analytics and cost-utility analysis (CUA). Our cost analysis combines evidence-based data with face-to-face family surveys. Additionally, we interviewed local health care delivery teams to obtain relevant, local, country-specific financial information about labor and supply costs. Therefore, our cost analysis uses local economic data instead of relying on insurance rates that are not generalizable. In addition to cost analysis, EcROP includes quality-adjusted life years (QALYs) to determine the incremental cost-effectiveness of an ideal ROP screening and treatment program (100% penetrance) for a given country or economic region. Next, we expand our model to include a cost-benefit analysis (CBA) that assigns a dollar value to each QALY gained to determine the net savings resulting from implementation of an ideal screening and treatment program.
We tested the EcROP model in both a high- (United States) and middle-income (Mexico) nation. A middle-income nation has a Human Development Index (HDI) ranking of 31–100 (74 in Mexico). At the time of this publication, Mexico is affected by the third epidemic of ROP. By comparison, the United States ranks eigth in HDI, yet the burden of ROP remains significant. By applying EcROP in both countries, our analysis is able to estimate the financial impact of effective ROP screening and treatment in these representative middle- and high-income countries.
Methods
We performed a cost-utility and cost-benefit analysis for implementation of an ideal ROP screening and treatment program in both the United States and Mexico. We incorporated sensitivity analysis and measured for the relative impact of this intervention by using commonly accepted parameters for cost-effectiveness.
In addition to using published data, EcROP gathered country-specific economic data using local care standard-of-care clinical protocols combined with economic data from face-to-face family interviews of those affected. This approach differed from traditional insurance or social service (ie, Medicaid)-based analyses. While insurance-based financial references may allow for an assessment of direct costs and opportunity costs, they often are not generalizable between countries and do not fully assess productivity costs. By using a more direct survey instrument and incorporating productivity losses, EcROP could provide a more complete analysis of the utility and cost-effectiveness of ROP screening and intervention.
The surveys conducted in this study had prospective Institutional Review Board approval from Emory University along with regional hospital approval from Asociación para Evitar la Ceguera en México (APEC; The Association to Prevent Blindness in Mexico). Informed parental consent was obtained for each interview. The study was in full compliance with all federal and state laws of Mexico and the United States, was in full compliance with HIPAA regulations, and adhered to the tenets of the Declaration of Helsinki.
Decision Analytic Model
The CUA and CBA were created considering a societal perspective and were based on a decision analytic model using a software program (TreeAge Pro, Williamstown, Massachusetts, USA). A decision analytic model uses a decision tree to show all possible event pathways, the probabilities that each event will occur, and the consequences of these events in terms of cost and effect on utility.
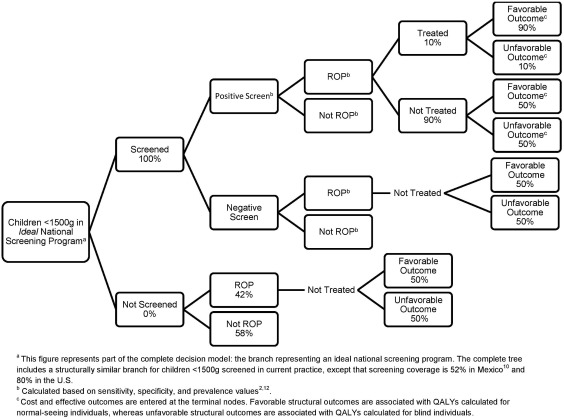
Our analysis compared 2 branches. For each country, we compared (1) current levels of screening and treatment of ROP to (2) an ideal national program with 100% screening coverage and appropriate management and treatment of all infants with ROP. Figure 1 shows a partial version of the decision tree that was constructed; only the branch for the ideal national program is shown in full. In the complete version of the decision tree, the branch for the current program uses the exact same decision pathway as the branch shown for the ideal national program, though the probabilities, costs, and utility values differ.
The specific probabilities, costs, utility values, and assumptions used in the decision tree are discussed in the sections below and data and details are found in Table 1 . Regionally collected data were extrapolated to estimate a national impact by using population data from each nation. The intervention timeframe was focused on the first year of life for a premature infant, when most direct costs are incurred. The analytic horizon was the lifetime of the affected individual. Assumptions were labeled as “Best Case” or “Worst Case” from the best and worst outcome in the EcROP model, as opposed to from the neonate or the disease perspective.
| Parameter | Mexico | United States | ||||
|---|---|---|---|---|---|---|
| Base Case | Best Case for EcROP | Worst Case | Base Case | Best Case for EcROP | Worst Case | |
| Prevalence of ROP in infants weighing <1500 g (%) | 42 | 99 | 1 | 42 a | 99 | 1 |
| Screening penetrance under current practice (%) | 52 | 0 | 68 | 80 a | 50 | 90 |
| Screening penetrance under ideal national program (%) | 100 e | 100 | 69 | 100 a | 100 | 91 |
| Probability of a favorable structural outcome in a treated child (%) (±10%) b | 90 | 99 | 81 | 90 | 99 | 81 |
| Probability of a favorable structural outcome in an untreated child (%) (±10%) b | 50 | 45 | 55 | 50 | 45 | 55 |
| Probability that a child who screens positive will be treated (%) (±10%) b | 10 | 20 | 0 | 10 | 20 | 0 |
| Sensitivity of screening (%) | 100 e | 100 e | ||||
| Specificity of screening (%) | 100 e | 100 e | ||||
| Discount rate (%) | 3 | 0 | 5 | 3 | 0 | 5 |
| Effectiveness input | ||||||
| QALY of a blind person | 0.61 | 0.39 | 0.80 | 0.61 | 0.39 | 0.80 |
| QALYs of being blind discounted/lifetime d | 18.1 | 11.7 | 23.8 | 18.2 | 11.7 | 23.9 |
| QALY of a normal-seeing person | 0.89 | 1.00 | 0.69 | 0.89 | 1.00 | 0.69 |
| QALYs normal-seeing discounted/lifetime d | 26.43 | 29.70 | 20.49 | 26.62 | 29.91 | 20.64 |
| Main costs c | ||||||
| Screening (±30%) b | 3228 | 2260 | 4197 | 9821 | 6874 | 12 767 |
| Treatment (±30%) b | 504 | 353 | 655 | 4037 | 2826 | 5249 |
| Follow-up (±30%) b | 2214 | 1550 | 2878 | 1538 | 1076 | 1999 |
| Raising a blind child (0, upper limit 95% CI) b | 24 413 | 67 803 | 0 | 84 586 | 239 307 | 0 |
| Productivity loss, caregivers (0, upper limit 95% CI) b | 305 584 | 926 331 | 0 | 817 996 | 2 329 654 | 0 |
| Productivity loss, blind individuals (±30%) b | 142 172 | 99 521 | 184 824 | 357 019 | 249 913 | 464 124 |
b Range used for sensitivity analysis, including best-case and worst-case analysis.
c Costs are discounted at 3% per year and adjusted for inflation in 2014 US dollars.
d QALYs were discounted at a rate of 3% over the expected lifespan (75 years in Mexico and 77 years in the United States).
Assumptions and Probability Inputs
Both current and ideal national programs assume screening and treatment of infants weighing ≤1500 g in both countries. We assume 100% screening coverage in an ideal national program. There is a paucity of data regarding current ROP screening coverage in the United States and Mexico. Our best estimate of current screening coverage is 80% and 52% in the United States and Mexico, respectively. We also assumed that all infants who qualified, received treatment; no infant deaths occurred after ROP screening; and the sensitivity and specificity of ROP screening was 100%.
The decision tree incorporated published natural history data and the known effectiveness of current treatments. In order to populate the decision tree using appropriate probabilities, the natural history of ROP (without treatment) from the control arm of the Cryotherapy for ROP (CRYO-ROP) study was compared to the current standards of successful treatment, using the evidence-based care from the laser treatment arm of the Early Treatment for Retinopathy of Prematurity (ETROP) study. Other probability inputs were determined from either the peer-reviewed, published literature or expert opinion, as cited in Table 1 .
Effectiveness Measures
A QALY is the measurement unit of utility (0 = death and 1 = perfect health). We calculated the cost per QALY saved by screening and treating ROP. Studies have found the utility factor for blindness ranging between 0.39 and 0.80, with a mean of 0.61, and a utility factor for sight ranging between 0.69 and 1.0, with a mean of 0.89. These QALYs were discounted at a 3% annual rate over the lifetime of the child. Discounting adjusts the future value of the QALY and is based on the concept that the benefit is better now than in the future (positive time preference).
Costs
In this study, EcROP included both direct and indirect costs that were discounted at an annual rate of 3% and reported in 2014 US dollars ($). Two cost values, the direct cost of raising a blind child and the productivity loss of a caregiver, were derived from our country-specific survey data. The variability in survey data was calculated using a 95% confidence interval (CI).
Direct Costs
Direct costs are defined as the required expenses specifically related to disease management and include all disease-related expense for the individual. Direct costs of raising a blind child included the family and societal expenses for the individual and also the individualized EcROP survey that assessed the educational costs per child and other family-incurred expenditures that result from child blindness. Examples included transportation, Braille equipment and supplies, and white canes. Clearly, these expenses would not be incurred for a sighted child. The average Supplemental Security income received by each child was also included. We estimated that the total direct cost of raising a blind child from birth to age 18 is $24 413 in Mexico and $84 586 in the United States ( Supplemental Table 1 , available at AJO.com ).
The direct cost of ROP screening included all equipment and labor expenses associated with evidence-based ROP screening, treatment, and follow-up. The data outlined below were used to calculate the final cost of treating each ROP neonate that met criteria. The equipment necessary to treat included a solid-state diode laser with an indirect delivery system (eg, the Iridex IQ-810; Iridex Corp, Mountain View, California, USA), an indirect ophthalmoscope, a condensing lens, and dilating drops, equipment fees, maintenance contracts, and applicable import taxes. Assuming that 15 neonates are treated per year, 10 are screened for every neonate treated, and equipment costs depreciate over 8 years, the cost per-neonate treated in Mexico was $3228 and in the United States was $9821 ( Supplemental Table 2 , available at AJO.com ).
The direct costs for US labor including ophthalmology, nursing, and anesthesia salaries were determined for the time spent on both screening and treatment. Physician salary labor costs were estimated using data from a 2012 report published by the Medical Group Management Association (MGMA). Nursing salaries were reported from the Bureau of Labor Statistics. Facility and operating room costs included the estimated space and time allocation with institutional overhead applied and the related major equipment costs depreciated over 8 years. In the United States, the standard of care for treatment of ROP includes the use of an indirect diode laser–delivered panretinal photocoagulation. The cost of laser treatment for ROP in the United States, as outlined in Supplemental Table 3 (Supplemental Material available at AJO.com ), was $4037. The costs of pharmacologic, intravitreal injections using either bevacizumab or ranibizumab in the United States are $603 and $2572, respectively ( Supplemental Table 4 , available at AJO.com ).
The direct treatment costs in Mexico were calculated using country-specific labor, medication, and equipment costs. In order to best represent the direct costs of screening and treatment in Mexico, calculations were based on current clinical practices at the study site, APEC in Mexico City, using identical data collection methodologies as performed in the United States. However, in Mexico, local care practices are more reliant on low-dose bevacizumab as compared to laser-based US treatment. The costs associated with treatment failure for bevacizumab is difficult to determine because there is limited outcome data from this treatment for prethreshold ROP. Therefore, we conservatively estimate a $123 treatment failure cost based on 2 of 70 infants treated with bevacizumab who would require additional laser treatment. The total cost per neonate for treatment with bevacizumab in Mexico was $504, as outlined in Supplemental Table 4 .
The direct costs related to follow-up care after treatment are calculated in Supplemental Table 5 (Supplemental Material available at AJO.com ). We considered the nursing and physician labor, and estimated loss of productivity owing to the time required of the caregiver(s). Panretinal laser photocoagulation, as performed in the United States, requires an average of 4 follow-up visits. The number of follow-up appointments required by neonates treated with bevacizumab is not known. Since longer-term monitoring is required, until the retina is vascularized, we conservatively estimated that infants may require up to 20 follow-up visits and multiplied this by the cost per each follow-up in Mexico. The follow-up cost per neonate treated in Mexico was estimated to be $2214 while the cost per follow-up visit for laser treatment in the United States (4 visits) was $1538 ( Supplemental Table 5 ).
Combining all direct costs for the United States and Mexico, we estimated the total cost of treatment per neonate to be $15 396 and $5946, respectively ( Supplemental Table 6 , available at AJO.com ).
Indirect Costs
Indirect costs are defined as the cost to society related to disease-specific morbidity. These include costs of loss in productivity from caregivers and affected individuals as a result of ROP-related blindness.
Our survey data were derived from each family’s expenses for raising a blind or visually impaired child, as opposed to a sighted child, and included the societal costs of a caretaker’s lost productivity. We administered the EcROP survey in person to the parents and/or guardians of 52 children at schools for the blind and pediatric eye clinics in Atlanta and of 43 children in Mexico City (APEC). After informed consent was obtained, surveys were administered in private, one-on-one interviews with a study author (M.I.R., R.R., B.P., or D.B.). Data collected included demographic information, parental income, time missed from work, and other expenses associated with raising a blind child.
We calculated the overall cost to society by considering the demands of a caregiver raising a blind child. Each caregiver’s lost wages were multiplied by their average hours of work missed per week by a country-specific national average of contribution to gross domestic product (GDP) per hour of work. In Mexico, cost data were gender-adjusted by multiplying the parent’s lost GDP by a country-specific factor for income distribution. In the United States, the costs were adjusted by the relative participation in workforce by gender.
The costs to caregivers of blind children do not end when the child reaches adulthood. Blind individuals often require additional care over their entire lifetime. In the United States, blind adults require 15 days more informal care per year than average adult children. This marginal cost of 15 days per year (after age 20) was gender-adjusted to account for the documented predominance of female caregivers in the United States. Similar data do not exists in Mexico. Therefore, we inquired with known experts and combined the EcROP survey data collected from parents who continued to care for blind children into their adulthood. We found an increased likelihood of multigenerational cohabitation among the Latin American population, and we found that annual caretaker expenditures for teenage blind children are similar for adults. Therefore, over 44 years from birth to retirement, we found a combined parental indirect cost of $305 584 in Mexico and $817 996 in the United States ( Supplemental Table 7 , available at AJO.com ).
GDP per capita was used to calculate the societal cost due to loss in productivity by blind individuals. The annual loss of productivity from blindness was calculated by multiplying the country’s annual GDP per capita by the difference in job participation rates between vision-impaired and fully sighted individuals. This number was then multiplied by the average years spent in the workplace in order to estimate the labor-related loss of the individual’s productivity over a work-lifetime. We found that the lifetime loss of productivity resulting from a blind individual was $142 172 in Mexico and $357 019 in the United States ( Supplemental Table 8 , available at AJO.com ). We acknowledge that there may be variation in visual impairment.
Analysis
A CUA was used to determine the incremental cost-effectiveness ratio (ICER), our primary outcome. ICER reflects the ratio of the change in costs to incremental benefits of a given therapeutic intervention or treatment. The benefit in our analysis was defined as QALYs gained as a result of the intervention. We then performed a CBA that calculated the net monetary benefit of an intervention with respect to willingness to pay (WTP). Incremental net monetary benefit, our secondary outcome, was calculated using the following equation: (additional QALYs gained × WTP/QALY) − additional cost.
Variability and Uncertainty
We accounted for variability and assessed uncertainty in the model by performing both probabilistic and deterministic sensitivity analyses. Sensitivity analyses use a range for each input to test sensitivity of the model to variability. The ranges used for each cost, probability, and utility value are shown in Table 1 . Cost of raising a blind child and productivity loss of a caregiver were derived from survey data. Therefore, the range used in sensitivity analysis for these 2 variables was zero to the upper limit 95% CI. All other costs were varied ±30%. Other input ranges were determined from published data or varied ±10%, as indicated.
For probabilistic analysis, we used the decision tree ( Figure 1 ) to perform a Monte Carlo simulation on the base case, with subsequent best- and worst-case analysis. This simulation incorporated a triangular probability distribution for the variables with the highest uncertainty. The simulation ran 10 000 random samples to determine the probability of different ICERs and net benefits.
Deterministic analysis was performed to consider the possible variation in the ICER and incremental net monetary benefit by using a 1-way sensitivity analysis of direct costs with variation in the base case inputs. Threshold analysis was performed to determine the value for different variables at a point when the national program becomes the dominant strategy as compared to the current program.
Stay updated, free articles. Join our Telegram channel

Full access? Get Clinical Tree


