Purpose
To evaluate the intraocular pressure (IOP) distribution and its regional association in the South Korean population.
Design
Cross-sectional, epidemiologic study.
Methods
All participants underwent interview and the following ocular examinations: visual acuity measurement, autorefraction, pachymetry, anterior segment evaluation, slit-lamp examination, Goldmann applanation tonometry, binocular optic disc evaluation, fundus photography, and visual field test. Patients with ocular diseases other than mild senile cataract or with history of ocular surgery were excluded.
Results
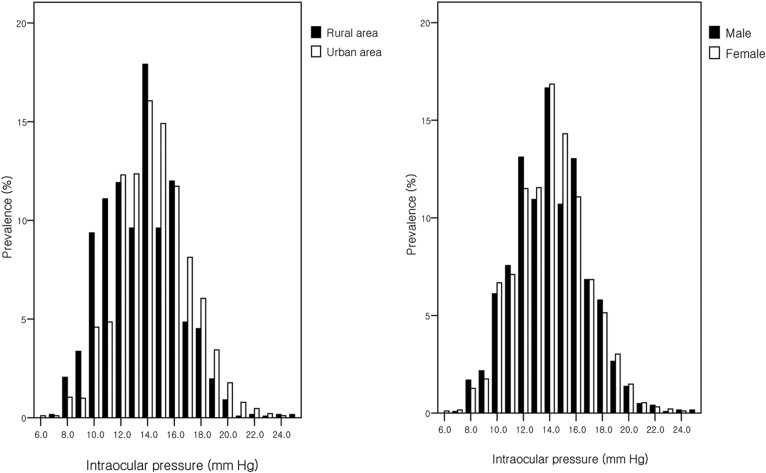
A total of 3191 subjects residing in urban and rural areas were recruited. Mean IOP of patients from the urban area was significantly higher than that of those from the rural area (14.45 ± 2.67 mm Hg vs 13.53 ± 2.76 mm Hg, P < .05). There was regional difference of mean IOP, even after controlling for different demographic factors in the 2 areas ( P < .05). Average IOP in the right eye of the investigated sample of South Korean population was 14.10 ± 2.74 mm Hg. Multiple regression analysis showed positive correlation between mean IOP and central corneal thickness, vertical cup-to-disc ratio, history of hypertension, smoking, and female sex, whereas IOP tended to decrease by approximately 0.2 mm Hg when age increased by 10 years.
Conclusions
This is the first population-based epidemiologic study measuring IOP in the South Korean population. Mean IOP of the urban area was found to be significantly higher than the corresponding value of the rural area. Therefore, the regional difference, as well as other various factors, has to be considered in epidemiologic study of the distribution of IOP.
Intraocular pressure (IOP) is known as one of the most important factors in the pathogenesis of glaucoma. “Normal” IOP is currently defined as the level of pressure that does not lead to glaucomatous damage to the optic nerve head. Although all human eyes do not respond in the same way to a measurable level of pressure, we can anticipate a relatively safe IOP range by determining the distribution of IOP in the general population. In 1958, Leydhecker and associates conducted an IOP study that included 10 000 participants with no diagnosed eye disease. The authors reported a mean IOP of 15.5 ± 2.57 mm Hg using Schiøtz tonometers. Subsequent IOP screening studies have, in general, demonstrated agreement with their published results; however, results from these studies varied and were shown to be dependent on several considerations in the experimental design, including population selection, testing methods, and other variables. Various factors, including race, are also thought to influence IOP distribution. For example, African and Asian populations included in the research were found to have higher mean IOPs (15.39 ± 4.42 mm Hg) than those of European or American descent. However, a recent study conducted in Japan reported an average IOP of 14.5 mm Hg, which is a significant decrease in IOP compared to data reported in other countries. In addition, a study conducted in Tehran also reported a measured IOP mean of 14.5 mm Hg, which is further evidence of a lower IOP when compared to those of western countries. In still another Asian population-based IOP study, Xu and associates reported a mean IOP within the sampled Chinese population of 16.11 ± 3.39 mm Hg, which is a higher value than that reported in the Japanese population. In addition, dissecting out the IOP distribution of the population further, it was found that there was no difference between the measured IOP of residents in rural vs urban areas.
Several studies have reported different results regarding the risk factors associated with elevated IOP. In particular, the association between patient age and IOP has been reported in several recent studies; there were reported increases in IOP with increasing age in black, white, and Chinese populations, whereas IOP was found to decrease with age in studies in Japan and Taiwan. However, these reports followed a cross-sectional population design and only 1 longitudinal study reported an increase of IOP with increased age in the Japanese population. In addition to age, various risk factors, including sex, high blood pressure, body mass index, central corneal thickness, diabetes, and refraction were investigated in numerous studies.
Although these were large-scale population studies, we doubt that the epidemiologic experimental design conducted in only 1 specific geographic location can represent the general population of the included country. Therefore, to confirm compatibility, we investigated the IOP distribution of study participants that reside in 2 separate areas, that is, a rural area and an urban area in South Korea. We further assessed systemic and ocular factors that demonstrated a correlation with IOP within the South Korean population. The objective of our study is to determine a potential regional difference in the IOP distribution within the South Korean population and to further analyze the association of IOP with various factors.
Methods
Residents aged 40 years or older in 2 different areas of South Korea (Bangbae-dong in Seoul city and Namil-myon, a rural agricultural area) underwent a screening examination during the period from June 2005 to February 2008. Participants were notified and recruited both in person and via posters. A screening center was established at the township office. There was no pattern of individuals who chose not to participate. Participants received no monetary reimbursement and participation, which included eye examinations, was strictly voluntary. Of the 3104 total residents of Namil-myon (an inland, low-mountainous, rural, and agricultural area of 47.14 km located in central South Korea), 1928 inhabitants were 40 years of age or older and the screening included 1532 persons. In comparison, 2179 participants were included in the screening test in Bangbae-dong (an urban area in Seoul city, capital of South Korea), with a total of 6725 residents. Screening examinations included an interview and ophthalmic examinations. For investigation of normal ophthalmologic subjects, patients with ocular diseases, including glaucoma; subjects with limited visual acuity of less than 0.7 (because of the possibility of fixation error); participants that wore contact lenses within 1 week prior to the examination; and subjects with a narrow anterior chamber under grade 2 through the Van Herick method were excluded. However, patients with mild senile cataracts that could not influence the examination results were included. During the course of our examinations, when glaucoma was indicated, patients were referred for further medical treatment and diagnoses were confirmed by glaucoma specialists.
Medical Interviews
The medical and ophthalmologic history was recorded for each subject using a standardized questionnaire. Each subject was interviewed on subjects regarding the patient’s general health conditions, including history of intraocular disease, ocular surgical treatment, systemic disease (with or without treatment), and current medications, as well as their smoking habits. Any family history of glaucoma was also recorded.
Ocular Examinations
Screening examinations included visual acuity, refractive error, central corneal thickness (CCT), axial length, central anterior chamber depth (ACD), slit-lamp biomicroscopy, measurement of IOP, gonioscopy with a Goldmann-type lens, binocular optic disc evaluation, fundus photography, and visual field (VF) test with frequency-doubling technology (FDT) perimetry. Visual acuity was measured using the Landolt broken ring visual acuity chart with correction at a distance of 5 m. Refractive error was measured using an autorefractometer (KR-8100; Topcon, Tokyo, Japan). CCT was measured using a contact-type ultrasound pachymeter (IOPac; Heidelberg Engineering, Heidelberg, Germany). Central ACD and axial length were measured using a partial coherence interferometer (IOL Master; Carl Zeiss Meditec, Oberkochen, Germany). Digital color photographs of the fundus were taken with a digital fundus camera system (TRC-NW200; Topcon). The visual field was evaluated using the FDT perimeter (N30-1 screening, Humphrey Matrix; Carl Zeiss Meditec Inc., Dublin,California, USA). The aforementioned ocular examinations were performed by ophthalmology technicians and monitored by glaucoma specialists. Slit-lamp examination, including measurement of peripheral ACD with the van Herick method, IOP measurements with the Goldmann applanation tonometer, binocular optic disc evaluation, and gonioscopy were performed by glaucoma specialists (members of the Korean Glaucoma Society). The average value of 3 IOP measurements in each eye was recorded. To compensate for CCT, we analyzed IOP distribution with 3 different aspects: IOP measured with a Goldmann applanation tonometer, and numerical calculation by method 1 (central corneal thickness 14 μm: 1.0 mm Hg ▵IOP) and by method 2 (central corneal thickness 50 μm: 1.0 mm Hg ▵IOP). In methods 1 and 2, IOP was added to the measured IOP by 1 mm Hg, when CCT was increased by either 14 μm (method 1) or 50 μm (method 2) from the standard value of 530 μm. Alternatively, IOP was subtracted from the measured IOP by 1 mm Hg when CCT was decreased by either 14 μm (method 1) or 50 μm; the authors set the reference CCT value as 530 μm, which was the average CCT of nonglaucomatous patients in the previously described South Korean population study.
The optic disc and posterior pole were examined using a +90 diopter lens (Volk, Mentor, Ohio, USA) and a stereoscopic optic disc photograph was taken. The angle status for all subjects was evaluated and documented using both static and dynamic gonioscopy with a Goldmann-type lens. Visibility of the posterior trabecular meshwork (the occludable angle was defined as the angle with less than 90 degrees of visible posterior trabecular meshwork) and angle width were evaluated during static gonioscopy. Peripheral anterior synechiae was defined as the iridocorneal contact area that could not be detached during dynamic gonioscopy.
Definitive examinations for glaucoma were performed when the findings from the screening tests met 1 or more of the following criteria: IOP ≥20 mm Hg; at least 1 abnormal test point with less than 1% probability or low test reliability in the FDT VF test; abnormal optic nerve head feature include a vertical C/D ratio ≥0.6, difference of the vertical C/D ratio of ≥0.2 between the 2 eyes, violation of the ISNT rule (that normal eyes show a characteristic configuration for disc rim thickness of inferior > superior > nasal > temporal), optic disc hemorrhage; retinal nerve fiber layer defect; and suspected or definitive angle closure by gonioscopy.
Definitive examinations included a visual field test using the Humphrey visual field analyzer SITA Standard 30-2 program (HFA II 720; Carl Zeiss Meditec Inc, Dublin, California, USA) and retinal nerve fiber analysis using optical coherence tomography (Stratus OCT; Carl Zeiss Meditec, Dublin, California, USA) or scanning laser polarimetry (GDx-VCC; Carl Zeiss Meditec, Dublin, California, USA). The Humphrey visual field test was considered reliable when there were less than 20% fixation errors and less than 33% false-positive and false-negative errors. When an abnormal result or poor reliability was found on the Humphrey visual field test, retinal nerve fiber layer analysis was performed.
Statistical Analysis
PASW software version 17.0 (SPSS, Inc, Chicago, Illinois, USA) was used for statistical analyses. The χ 2 test, Fisher exact test, or independent t test were used, as required, for comparison of the intraocular pressure and other demographic characteristics in the 2 selected geographic areas. In the total population, associations between IOP and various factors were analyzed using multiple linear regression analysis, in which independent variables included area, sex, age, central corneal thickness, refractive error, vertical cup-to-disc ratio, family history of glaucoma, history of diabetes mellitus, hypertension, cardiovascular disease, and smoking habits. To investigate the exact influence of age on IOP, we calculated the statistical residual of IOP, which excludes the influence on IOP of all other factors. This value reflects the effect of age only. This calculated IOP value was defined as “residual IOP.” The association between age and this value was plotted. A P -value of less than .05 was considered statistically significant.
Results
Comparison of Intraocular Pressure Between South Korean Rural and Urban Area Populations
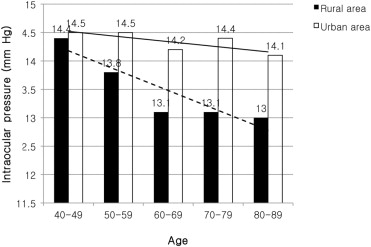
A total of 3191 ophthalmologically normal members of the population were included in the experimental analysis, with 1246 subjects included in the rural area population and 1945 subjects included in the urban area population ( Table 1 ). The average age of participants was higher in the rural area (62.5 ± 11.0 years) compared to the urban area (56.2 ± 8.8 years, P < .05) and women were more prevalent in the urban area ( P < .05). In terms of refraction, vertical cup-to-disc ratio, frequency of family history of glaucoma, and smoking history, a statistically significant difference was observed between participants from the rural area and urban area populations ( P < .05). However, there was no statistically significant difference between the subjects in the 2 areas in patients with regard to diabetes, hypertension, and cardiovascular disease. The mean IOP of the urban area participants was significantly increased compared to those residing in the rural area (14.45 ± 2.67 mm Hg vs 13.53 ± 2.76 mm Hg, P < .05). The absolute difference in IOP between the subjects from the 2 areas averaged 0.92 mm Hg (95% confidence interval [CI] 0.73 to 1.12). The IOP corrected by method 1 and method 2 also exhibited higher values in subjects from the urban area than those from the rural area. Distribution of the IOP in each geographic location is shown in Figure 1 . The mean IOP of urban subjects was higher for each decade of age than the corresponding value calculated from rural area participants and this difference was statistically significant ( P < .05) ( Figure 2 ). Multiple regression analysis was performed after controlling for other separate factors, in order to ascertain whether there was still a difference in the mean IOP between subjects from the 2 areas ( Table 2 ). In the multiple regression analysis, the participant IOP demonstrated a significant association with geographic area ( P < .05). That is, even though the different factors between the 2 locations including sex; age; central corneal thickness; refraction; vertical cup-to-disc ratio; family history of glaucoma: presence of systemic disease such as diabetes mellitus, hypertension, and cardiovascular disease; and smoking habit were controlled, there was still a difference in the subject IOP distribution between the 2 areas. Specifically, the mean IOP of the urban area participants was still significantly higher than that of rural area subjects after excluding the influence of other factors ( P < .05) ( Table 2 ).
| Rural Population (N = 1246) | Urban Population (N = 1945) | Total Population (N = 3191) | P Value a | |
|---|---|---|---|---|
| Mean ± SD age (y) (range) b | 62.5 ± 11.0 | 56.2 ± 8.8 | 58.7 ± 10.2 | <.05 |
| Male : female (%) d | 44.5 : 55.5 | 36.8 : 63.2 | 39.8 : 60.2 | <.05 |
| Intraocular pressure (mm Hg) b c | 13.53 ± 2.76 | 14.45 ± 2.67 | 14.10 ± 2.74 | <.05 |
| Corrected IOP with method 1 b | 14.53 ± 3.14 | 15.10 ± 3.10 | 14.88 ± 3.13 | <.05 |
| Corrected IOP with method 2 b | 13.81 ± 2.69 | 14.63 ± 2.61 | 14.32 ± 2.67 | <.05 |
| Central corneal thickness (μm) b | 530.9 ± 31.5 | 535.8 ± 31.6 | 533.9 ± 31.6 | <.05 |
| Refractive error (spherical equivalent) (diopter) b | 0.198 ± 2.37 | −0.491 ± 2.13 | −0.226 ± 2.253 | <.05 |
| Vertical cup-to-disc ratio b | 0.42 ± 0.13 | 0.40 ± 0.14 | 0.41 ± 0.14 | <.05 |
| Family history of glaucoma (%) d | 1.5 | 4.5 | 3.3 | <.05 |
| History of diabetes (%) d | 10.0 | 8.1 | 8.9 | >.05 |
| History of hypertension (%) d | 27.9 | 25.6 | 26.5 | >.05 |
| History of cardiovascular disease (%) d | 2.8 | 1.6 | 2.1 | >.05 |
| Smoking history (%) d | 60.4 | 70.1 | 66.3 | <.05 |
a P value is the comparison between the clinical parameters of participants from the rural area and those of the urban area.
c Intraocular pressure is recorded value of right eye.