Purpose
To provide an update of cataract data and barriers to cataract surgery in Latin America.
Design
Review and longitudinal study.
Methods
Cataract surgery rates and other related indicators that have been reported to the VISION 2020 Latin America program since 2005 were reviewed. PubMed was searched for publications concerning regional epidemiologic studies related to cataract, cataract surgery, barriers, outcomes, and cataract prevalence between January 2012 and October 2013 to obtain the most up-to-date data from 19 countries.
Results
The weighted mean regional cataract surgery rate has increased by an impressive 70% since 2005, from 1562 to 2672 cataract surgeries per 1 million inhabitants. The weighted mean number of ophthalmologists per 1 million inhabitants in the region is approximately 62. Cataract surgery coverage varies widely in Latin America, from a meager 15% in El Salvador to a more satisfactory 77% in Uruguay. Five recent surveys indicate that lack of awareness of cataract and the surgery treatment option as well as the cost of the surgery are the main barriers to cataract surgery.
Conclusions
In spite of the increasing rates of cataract surgery and the more-than-adequate number of ophthalmologists in Latin America, it is not known how many ophthalmologists actually perform surgery. Coverage remains less than satisfactory across the region. Barriers to cataract surgery hinder the efforts of eye care programming. More comprehensive eye care programs and training centers are needed so that they can focus on reaching the underserved and unaware communities, increase surgery output and uptake, and improve outcomes.
Since 1999, the VISION 2020: The Right to Sight initiative of the World Health Organization and the International Agency for the Prevention of Blindness has served as the global partnership for the elimination of avoidable blindness with the collaboration of international nongovernmental organizations, professional associations, eye care institutions, and industry. The basis of this initiative was to curb the frightening rise in global blindness by eliminating all avoidable blindness by the year 2020.
According to the World Health Organization, approximately 39 million people in the world have blindness, and 246 million have moderate or severe visual impairment. Cataract is the main cause of global blindness, accounting for 51% of the cases reported and one third of visual impairment. According to the 2010 Global Burden Disease Study, standardized national prevalence rates of blindness in the population 50 years of age or older (the age group most at risk for cataract blindness) in Latin America range from 1.1% in Uruguay to 3.8% in Guatemala. The prevalence rates of moderate or severe visual impairment in the same age group in Latin America range from 7.5% in Argentina to 4.4% in Brazil.
Latin America has been considered one of the global regions with the highest number of epidemiologic studies of blindness and visual impairment since 1999. Cataract data and related indicators have been reported annually to the VISION 2020 Latin America program since 2005. In 2010, we reported progress in the regional cataract surgery rates, noting a general increase in rates in Latin American countries between 2005 and 2008. In 2012, the most comprehensive Latin American review to date concerning the prevalence of blindness and visual impairment resulting from all causes of blindness, including cataract, was carried out by Furtado and associates. The purpose of this current study is to provide an update of the cataract situation in Latin America, including a longitudinal review of cataract data from 2005–2012, and to review the barriers to cataract surgery based on the most recent epidemiologic studies.
Methods
A longitudinal review of cataract data in Latin America was carried out for 2005–2012 with an updated literature review of epidemiologic studies of blindness and visual impairment in the region. Latin America is referred to in this study as the 19 countries of VISION 2020 Latin America: Argentina, Bolivia, Brazil, Chile, Colombia, Costa Rica, Cuba, Dominican Republic, Ecuador, El Salvador, Guatemala, Honduras, Mexico, Nicaragua, Panama, Paraguay, Peru, Uruguay, and Venezuela. The methodology for collection of cataract data was previously described in the first longitudinal review of Latin American data for 2005–2008 ; the current study updated the data review through 2012. Country representatives from the national VISION 2020 committees, national committees for the prevention of blindness, national societies of ophthalmology, and the ministries of health continue to report annually the data concerning cataract surgery. The cataract surgery rate is an indicator of cataract surgery services; it is the annual number of cataract surgeries carried out per 1 million people. The representatives also report annually on the number of ophthalmologists working in each country. These data are available with data about other key health personnel, infrastructure, pricing, economic, and demographic facts that are also reported periodically and updated on the VISION 2020 Latin America website: http://www.v2020la.org/StatPlanet/StatPlanet.html .
PubMed was also searched for publications concerning Rapid Assessment of Cataract Surgery Services and Rapid Assessment of Avoidable Blindness studies from Latin America related to cataract, cataract surgery barriers, outcomes, and cataract prevalence from January 2012 through October 2013. The search of epidemiologic studies was limited specifically to Rapid Assessment of Cataract Surgery Services and Rapid Assessment of Avoidable Blindness studies because they are considered the standard methodologies and provide directly comparable data. Also included were data from the recent Rapid Assessment of Avoidable Blindness reports from 2011 onward, which have not yet been published but were submitted to the International Agency for the Prevention of Blindness and the World Health Organization. Authors provided their authorization through e-mail communications to allow their data to be used in this study. Publications previously reviewed were also reviewed for the prevalence of blindness, causes of blindness and cataract surgery coverage.
Cataract surgery coverage is another indicator of cataract surgery services; it is the annual “proportion of people, blind or visually-impaired due to cataract, which have been operated in one or both eyes” in a given area. Cataract surgery coverage reflects the distribution and equity of services across various regions and populations. The cataract surgery coverage used in this study is based on the number of people with cataract who need surgery at the following visual acuity (VA) thresholds: <6/18, <6/60 and <3/60.
Results
Cataract Surgery Rates in Latin American Countries, 2005–2012
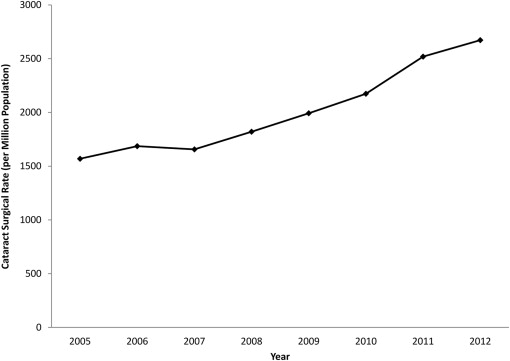
In Table 1 , it is demonstrated that all countries have increased their cataract surgery rates since 2005, with the exception of Guatemala and Honduras. Ten countries have an increase in cataract surgery rate that is greater than 100%, and Argentina has an impressive rate increase of 263.5%. Only 2 countries have experienced a decrease, Guatemala and Honduras, with cataract surgery rates down by 7.2% and 11.7%, respectively. The weighted mean regional cataract surgery rate ( Figure 1 ) has increased by an impressive 70% since data were first collected in 2005, from 1562 to 2672 cataract surgeries per 1 million inhabitants. The weighted mean regional cataract surgery rate has increased by nearly 47% since 2008 (cataract surgery rate = 1820), when our last longitudinal study concluded.
| Country | 2005 | 2006 | 2007 | 2008 | 2009 | 2010 | 2011 | 2012 | % Rate Change 2005 vs 2012 | Reference |
|---|---|---|---|---|---|---|---|---|---|---|
| Argentina | 1769 | 2100 | 2089 | 2350 | 2650 | 2622 | 5100 | 5953 | 263.5 | Nano ME, e-mail communication, March 2013 |
| Bolivia | 563 | 602 | 667 | 800 | 900 | 930 | 930 | 930 | 61.2 | Moya Saldias J, e-mail communication, March 2013 |
| Brazil | 2448 | 2352 | 2212 | 2200 | 2400 | 2700 | 2900 | 3277 | 33.9 | Arieta C, Zin A, Furtado F, e-mail communications, March 2013 |
| Chile | 1751 | 1930 | 2132 | 2820 | 3200 | 3450 | 3789 | 4100 | 134.2 | Barria F, Meza P, e-mail communications, March 2013 |
| Colombia | 1189 | 1350 | 1278 | 1350 | 1510 | 1590 | 1752 | 1752 | 47.4 | Peña FY, Silva JC, e-mail communications, March 2013 |
| Costa Rica | 1400 | 2049 | 2144 | 2800 | 2950 | 3000 | 3200 | 3140 | 124.3 | Martinez J, e-mail communication, March 2013 |
| Cuba | 1600 | 2219 | 3125 | 2324 | 2037 | 2428 | 2708 | 2827 | 76.7 | Rio Torres M, e-mail communication, March 2013 |
| Dominican Republic | 710 | 682 | 779 | 900 | 1000 | 1,247 | 1432 | 2000 | 181.7 | Battle J, e-mail communication, March 2013 |
| Ecuador | 801 | 831 | 856 | 1050 | 1350 | 1490 | 1737 | 842 | 17.6 | Chiriboga F, e-mail communication, March 2013 |
| El Salvador | 1104 | 1151 | 1411 | 1050 | 1100 | 1150 | 1743 | 2100 | 90.2 | Garcia M, e-mail communication, March 2013 |
| Guatemala | 824 | 900 | 875 | 900 | 920 | 990 | 800 | 765 | −7.2 | Yee M, e-mail communication, March 2013 |
| Honduras | 940 | 558 | 631 | 750 | 700 | 800 | 878 | 830 | −11.7 | Alvarado D, e-mail communication, March 2013 |
| Mexico | 958 | 1200 | 1138 | 1300 | 1450 | 1550 | 1720 | 1950 | 103.6 | Gomez P, Martinez-Castro F, e-mail communications, March 2013 |
| Nicaragua | 460 | 822 | 999 | 1300 | 1430 | 1610 | 1790 | 1790 | 289.1 | Rivas F, e-mail communication, March 2013 |
| Panama | – a | 1180 | 1159 | 1197 | 1321 | 1693 | 1882 | 1410 | 19.5 | Lopez M, e-mail communication, March 2013 |
| Paraguay | 800 | 895 | 957 | 1000 | 1100 | 1311 | 1351 | 1539 | 190.3 | Quintana LM, e-mail communication, March 2013 |
| Peru | 761 | 863 | 880 | 1429 | 1572 | 1400 | 1599 | 1682 | 121.0 | Montjoy E, e-mail communication, March 2013 |
| Uruguay | – a | 2000 | 1898 | 3933 | 4150 | 4419 | 4699 | 4699 | 135.0 | Gallareta M, Balier A, e-mail communications, March 2013 |
| Venezuela | – a | 960 | 1754 | 2750 | 2950 | 3483 | 3650 | 2038 | 112.3 | Bermudez I, Belisario M, e-mail communications, March 2013 |
The Number of Ophthalmologists Per Country
Data have likewise been reported on the number of ophthalmologists per 1 million inhabitants in each country. The weighted mean number of ophthalmologists per 1 million people in the region is approximately 62. The number of ophthalmologists per 1 million inhabitants in each country in 2005 vs 2012 is shown in Figure 2 . Chile is the only country that experienced a decrease in practitioners (from 50 ophthalmologists to 46 ophthalmologists per 1 million residents), whereas the number of ophthalmologists in 2012 in Paraguay (n = 32) was reduced to more or less the same number as in 2005 (n = 28). Cuba’s noticeable increase could be attributed to government efforts to increase medical practitioners both at home and abroad.
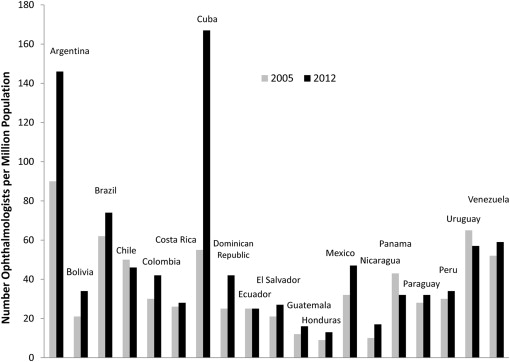
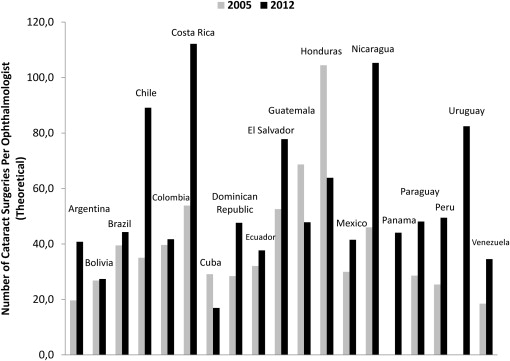
The number of ophthalmologists in Latin American countries ( Figure 2 ) should provide adequate coverage, assuming that the majority are performing cataract surgery. It is not known, however, how many ophthalmologists are actually performing cataract surgery or how many surgeries are carried out per ophthalmologist. By dividing the cataract surgery rate by the number of ophthalmologists, the theoretic number of surgeries performed per ophthalmologist per country is estimated ( Figure 3 ). Costa Rica has one of the lower numbers of ophthalmologists in Latin America ( Figure 2 ), but it still has one of the highest number of cataract surgeries (approximately 112 surgeries) performed per ophthalmologist per year ( Figure 3 ). Honduras and Guatemala show a considerable decrease in the theoretic number of surgeries per ophthalmologist. However, the lowest numbers of ophthalmologists per 1 million people are found in Honduras and Guatemala, at 16 and 13, respectively, and still they outperform Argentina, Bolivia, Brazil, Colombia, the Dominican Republic, Ecuador, Mexico, Panama, and Venezuela in the theoretic number of surgeries per ophthalmologist. These data provide only a very approximate indication of productivity and output of ophthalmologists in various countries.
Cataract Surgery Coverage Rates and Surgery Outcomes in Latin American Countries
Cataract surgery coverage indicates the percentages of cataract surgeries that are being carried out based on the VA and cataract surgery needs of the population. This indicator is reported by epidemiologic studies, most of which have been reviewed previously. The literature search found 2 Rapid Assessment of Avoidable Blindness studies published since January 2012, in Mexico and Paraguay. Two additional studies of Rapid Assessment of Avoidable Blindness were carried out in El Salvador and Peru in 2011 and published on the websites of their respective Ministries of Health. One additional Rapid Assessment of Avoidable Blindness study has also been reported to VISION 2020 Latin America during this time frame from Uruguay (Gallarreta M., e-mail communication, December 2, 2013). Table 2 summarizes the key results of every Rapid Assessment of Avoidable Blindness and Rapid Assessment of Cataract Surgery Services study in Latin America. Cataract surgery coverage ranges from as low as 15% of cataract patients in El Salvador to as high as 77% of all cataract patients (for all VA thresholds) in Uruguay (Gallarreta M., e-mail communication, December 2, 2013).
| Country | Study Type, Year | Population Examined | Prevalence of Blindness (%) | Cataract, % of Blindness | Cataract Surgical Coverage | |
|---|---|---|---|---|---|---|
| Visual Acuity Threshold | Cataract Patients Who Underwent Operation (%) | |||||
| Argentina | Rapid Assessment of Cataract Surgical Services, 2004 | 4302 | 0.9 | 54 | <3/60 | 74 |
| <6/60 | 66 | |||||
| <6/18 | 47 | |||||
| Brazil | Rapid Assessment of Cataract Surgical Services, 2004 | 2224 | 2.0 | 41 | <6/60 | 82 |
| <6/18 | 93 | |||||
| Chile | Rapid Assessment of Avoidable Blindness, 2007 | 2715 | 1.6 | 57 | <3/60 | 76 |
| <6/60 | 71 | |||||
| <6/18 | 45 | |||||
| Colombia | Rapid Assessment of Avoidable Blindness, 2008 | 4082 | 1.8 | 68 | – a | 50 |
| Cuba | Rapid Assessment of Avoidable Blindness, 2005 | 2760 | 2.3 | 51 | – a | 73 |
| Dominican Republic | Rapid Assessment of Avoidable Blindness, 2008 | 3873 | 2.1 | 64 | <3/60 | 63 |
| <6/60 | 50 | |||||
| <6/18 | 28 | |||||
| Ecuador | Rapid Assessment of Avoidable Blindness, 2009 | 4012 | 1.7 | 74 | <3/60 | 83 |
| <6/60 | 64 | |||||
| <6/18 | 46 | |||||
| El Salvador | Rapid Assessment of Avoidable Blindness, 2011 | 3399 | 2.7 | 69 | – a | 15 |
| Guatemala | Rapid Assessment of Cataract Surgical Services, 2004 | 4806 | 4.1 | 68 | <3/60 | 38 |
| <6/60 | 29 | |||||
| <6/18 | 15 | |||||
| Mexico | Rapid Assessment of Cataract Surgical Services, 2005 | 3780 | 1.5 | 67 | – a | 51 |
| Rapid Assessment of Avoidable Blindness, 2010 | 2864 | 2.3 | 63 | ≤3/60 | 69 | |
| ≤6/60 | 63 | |||||
| ≤6/18 | 42 | |||||
| Paraguay | Rapid Assessment of Cataract Surgical Services, 1999 | 2316 | 3.1 | 59 | <3/60 | 37 |
| <6/60 | 28 | |||||
| <6/18 | 22 | |||||
| Rapid Assessment of Avoidable Blindness, 2011 | 2862 | 1.0 | 44 | <3/60 | 44 | |
| <6/60 | 36 | |||||
| <6/18 | 32 | |||||
| Peru | Rapid Assessment of Cataract Surgical Services, 2002 | 4782 | 4.0 | 53 | <3/60 | 24 |
| <6/60 | 12 | |||||
| <6/18 | 7 | |||||
| Rapid Assessment of Avoidable Blindness, 2011 | 4852 | 2.1 | 58 | <3/60 | 67 | |
| <6/60 | 57 | |||||
| <6/18 | 42 | |||||
| Uruguay | Rapid Assessment of Avoidable Blindness, 2011 b | 3956 | 0.9 | 48 | <3/60 | 91 |
| <6/60 | 86 | |||||
| <6/18 | 54 | |||||
| Venezuela | Rapid Assessment of Avoidable Blindness, 2004 | 3317 | 3.5 | 65 | – a | 59 |
a – indicates no data available.
The 2011 Rapid Assessment of Avoidable Blindness studies in El Salvador and Uruguay were the countries’ first epidemiologic surveys. In addition to their cataract surgery coverage rates’ being at the opposite ends of the regional spectrum, they demonstrate other differences in their levels of development of the eye health system. Surgery outcomes are important indicators of the quality of cataract surgery. A good visual outcome following cataract surgery is defined as >6/18; a poor outcome (with available correction) is defined as <6/60. If more than 10% of patients have postoperatory VA <6/60, then further research is recommended to investigate the causes of such poor outcomes, which can be a major deterrent to cataract uptake. In El Salvador, only slightly more than half of the patients (56%) operated on could see better than 20/60, and 23% had poor outcomes, which was consistent with the visual outcomes of patients operated on during the 3 years prior to the study. In Uruguay, visual outcomes were considerably better, with 70% of patients having VA of at least 20/60 and 15% having poor outcomes (Gallarreta M., e-mail communication, December 2, 2013). However, even in a more advanced country like Uruguay, the percentage of poor outcomes still crosses the worrisome threshold of more than 10%.
Mexico, Paraguay and Peru have performed multiple studies ( Table 2 ). The most recent Rapid Assessment of Avoidable Blindness study in Mexico, from 2010, was the first study to be carried out in Chiapas, one of the most impoverished and remote states. An earlier Rapid Assessment of Cataract Surgery Services from 2005 was carried out in the more developed northern state of Nuevo Leon. Therefore, it is not surprising to find a prevalence of cataract blindness of 1.5% in Chiapas, which is 50% more than the 1.0%% reported in Nuevo Leon. Only 61% of the patients with cataract who were operated on in Chiapas had good outcomes after surgery (with available correction), and 21% had poor outcomes.
The 2011 Rapid Assessment of Avoidable Blindness in Paraguay was a follow-up national survey to the 1999 Rapid Assessment of Cataract Surgical Services, which was the first performed in Latin America. The prevalence of blindness decreased significantly from 3.1% in 1999 to 1.0% in 2011 ( Table 2 ). The percent of blindness caused by cataract also decreased considerably, from 59% to 44%, despite the fact that the population 50 years of age or older increased by nearly 50% during this time. The prevalence of bilateral blindness caused by cataract decreased drastically, by 71%, from 2% in 1999 to 0.3% in 2011. The number of people who were operated on for cataract increased by nearly 5-fold, and good surgery outcomes increased by more than 40%, to 77% of all eyes operated for cataract (90% with pinhole). Only 7.7% could not see 6/60 in the Paraguay study.
In Peru, a follow-up national Rapid Assessment of Avoidable Blindness to the 2002 regional Rapid Assessment of Cataract Surgical Services was performed in 2011. The original assessment took place in the northern coastal departments of Piura and Tumbes that border Ecuador, where high unemployment, above-average poverty rates, and limited access to the most basic public services are observed. The 2011 survey results show a nearly 50% decrease in blindness prevalence at the national level (2.1%–4%), but an increase in cataract as a cause of blindness from 53%–58%. Although, cataract surgery coverage doubled from 25%–50% of cataract patients, coverage remains low ( Table 2 ). Surgery outcomes also need to be improved. Only 61% of patients operated on had a VAs ≥6/18, and as many as 19% had VAs <6/60 with available correction.
Patient-Reported Cataract Surgery Barriers
2Cataract surgery coverage can be hindered by patients’ low uptake of cataract surgery. A questionnaire about barriers to cataract surgery is provided to patients during the Rapid Assessments of Avoidable Blindness. The reported barriers to cataract surgery services and coverage in each country are summarized from the findings of the most recent surveys ( Table 3 ). The Uruguay study is not included because a very small percentage of patients operated on were surveyed for barriers (Gallarreta M., e-mail communication, December 4, 2013). Lack of awareness of cataract disease and of surgery and cost are reported by the patients to be the predominant barriers ( Table 3 ). It should be noted that cost does not refer merely to the cost of surgery and surgery consumables, such as the intraocular lens, it also includes the additional out-of-pocket costs of the patients, such as transportation to and from the surgery center, accommodations, and the costs of postoperatory follow-up visits and medication.


