Purpose
To evaluate the newly developed Ocular Surface Thermographer (TOMEY Corporation) for dry eye screening.
Design
Prospective, controlled study.
Methods
We studied 30 eyes of 30 patients diagnosed with dry eye (mean age ± standard deviation, 52.9 ± 17.1 years) and 30 eyes of 30 normal subjects (42.7 ± 17.0 years). The ocular surface temperature was measured immediately after eye opening and every second during 10 seconds of eye opening. The reliability of the measurements was determined by calculating intraclass correlation coefficients. Then, the correlations between the change in the ocular surface temperature and tear film break-up time, Schirmer I test values, and fluorescein staining scores were determined.
Results
The measurements of the ocular surface temperature had a high degree of reliability. Immediately after eye opening, the temperature in the dry eye did not differ significantly from that in normal eyes in any of the 3 regions tested. The decrease in the ocular surface temperature in dry eyes was significantly greater than that in normal eyes ( P < .001) at 10 seconds after eye opening. The decrease in the temperature of the cornea was correlated significantly with the tear film break-up time ( r = −0.572; P < .001). When the changes in ocular surface temperature of the cornea were used as an index for dry eye, the sensitivity was 0.83 and the specificity was 0.80 after 10 seconds.
Conclusions
Measurements of the ocular surface temperature obtained with our newly developed Ocular Surface Thermographer after 10 seconds of eye opening may provide a simple, noninvasive screening test for dry eyes.
Dry eye is a multifactorial disease of the tears and ocular surface that results in symptoms of discomfort, visual disturbances, and tear film instability and that has the potential to damage the ocular surface. The diagnosis of dry eye is based on the results of a comprehensive evaluation of the key findings: decrease in tear secretion, instability of the tear film, and corneal or conjunctival epithelial cell disorder identified by vital staining. However, the discomfort of patients during the Schirmer test and tear film break-up time (TBUT) test, and the toxicity of rose bengal staining are factors that need to be considered when these diagnostic tests are used. Therefore, a screening test for dry eyes that is objective, noninvasive, and rapid is needed.
Thermography is a noninvasive method for measuring the surface temperature of an object. Thermography was applied to the eye first in 1968 by Mapstone. In 1995, Morgan and associates used thermography to measure ocular surface temperature in patients with dry eyes. They reported that the surface temperature was significantly higher in dry eyes than in normal eyes and that the temperature at the center of the cornea of dry eyes became lower than that in normal eyes after sustained eye opening. Subsequently, several groups reported on the difference between the surface temperatures of normal eyes and dry eyes, and this led to the suggestion that thermography might be used for diagnosing dry eye. However, attempts to use the existing medical thermographic devices to screen for dry eye had many problems. For example, to measure the ocular surface temperature with the existing devices, the tests had to be carried out in a specialized room with tightly controlled temperature and humidity. In addition, considerable skill was necessary to make the measurements under special conditions such as those necessary for serial radiography. Finally, a large amount of time was required for data analysis after the test.
We have developed a thermographic instrument specialized to measure surface temperature which is based on the design of the TOMEY autorefractor/keratometer (TOMEY Corp, Nagoya, Japan). In addition to measuring the surface temperature, our device also incorporates data analyzing features.
Thus, the purpose of this study was to determine whether our newly developed thermographer can provide reliable values of surface temperature and whether it can be used to screen for dry eye. To accomplish these goals, we measured the surface temperature in 30 patients who were diagnosed with dry eye by conventional examinations and compared their findings with those obtained from 30 individuals with no signs of dry eye.
Methods
Development and Specifications of Ocular Surface Thermographer
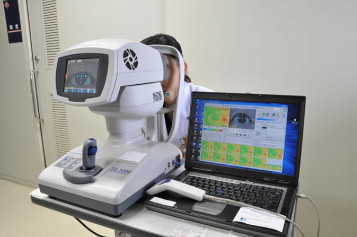
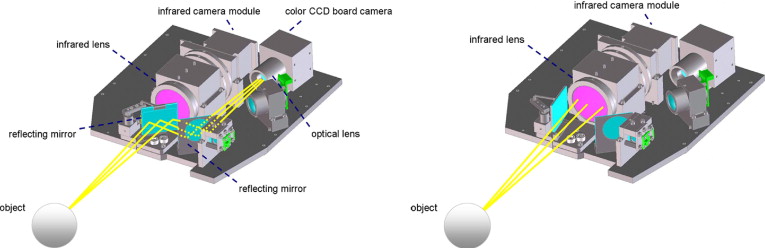
The newly developed Ocular Surface Thermographer (TOMEY Corp) is shown in Figure 1 . The instrument is equipped with an infrared camera module (HX0830M1; NEC, Tokyo, Japan) and a color charged coupled device board camera (PKD-101; Pacific CO, Tokyo, Japan). Light can be directed into either an infrared camera or a visible light camera. The direction of the light is changed by a rotating mirror, and both infrared and visible light images can be recorded coaxially ( Figure 2 ). The two mirrors are positioned with their optical axes displaced by 90 degrees, and the position of one mirror is fixed while the other mirror is rotated 45 degrees every 0.25 seconds to direct light alternately into the infrared camera ( Figure 2 , Right) or into the visible light camera ( Figure 2 , Left). The cameras and the controllers are mounted within a modified version of the optical head of an autorefractor/keratometer (RC-5000; TOMEY Corp). The infrared radiation detector module is sensitive to infrared radiation between 8 and 12 μm. The infrared camera has a Germanium lens with a 90-mm working distance and can record images at a resolution of 320 × 240 pixels with a pixel size of 23.5 × 23.5 μm and spatial resolution of 70 μm at 0.1 C. The maximum recording rate is 6 frames/second. Color images are obtained with a 1/4-inch charged coupled device video camera that can record images at a resolution of 640 × 480 pixels, pixel size of 5.6 × 5.6 μm, and a detection range of 0.5 lux at 1/30 frames/second. To correct for background radiation entering the infrared camera, a black body plate is inserted automatically to cover the sensor immediately before beginning the measurements. To correct for changes in the temperature of the interior of the instrument during the measurements, a sensor was embedded in the camera and a program was installed in the instrument to correct for changes in the internal temperature. An autoalignment function is incorporated in the instrument to ensure that the instrument and object are maintained in a fixed location relative to each other. With this autoalignment function, the position of the cameras with respect to the object to be measured can be held constant, which allows measurements of the ocular surface temperature to be performed at the same position. There is virtually no human error involved in operating the Ocular Surface Thermographer. This feature is identical to that of the RC-5000 Autorefractor/Keratometer, which recognizes the pupil and aligns the pupil in the center of the screen when the examiner touches the center of the touch panel. The head of the Ocular Surface Thermographer also moves along the z-axis automatically to maintain the instrument at a fixed distance from the eye.
The images recorded by the Ocular Surface Thermographer are immediately fed to a Dell-compatible microcomputer to be stored and manipulated automatically by appropriate software. Monochromatic thermal images (65 536 grayscale increments) are recorded and analyzed with a computer program and are displayed on a monitor in up to 24-bit color. It required only 10 seconds to display the results of a measurement that has been analyzed.
Subjects
Thirty eyes of 30 patients with dry eye who were recruited from the outpatients of the Department of Ophthalmology, Ehime University Graduate School of Medicine (7 men and 23 women; mean age ± standard deviation, 52.9 ± 17.1 years; range, 20 to 74 years), were examined. Thirty eyes of 30 normal subjects who were healthy volunteers (12 men and 18 women; mean age, 42.7 ± 17.0 years; range, 20 to 81 years) served as controls. Individuals who had a history of atopy; allergic diseases; Stevens-Johnson syndrome; or chemical, thermal, or radiation injury were excluded. Subjects also were excluded if they had any other ocular or systemic disorders or had undergone any ocular surgery or contact lens use that would create an ocular surface problem or dry eye.
Diagnostic Criteria
The diagnosis of dry eye was based on the diagnostic criteria of the Japanese Dry Eye Research Group. Subjects who fulfilled the following 3 criteria were diagnosed as having dry eye: subjective symptoms related to dry eye elicited during the examination or medical interview, Schirmer I test results of less than 5 mm or TBUT in fewer than 5 seconds, and positive staining of the cornea and conjunctiva by fluorescein, rose bengal, or lissamine green, as described below. The fluorescein, rose bengal, and lissamine green staining were graded from 0 to 3 at the cornea, nasal conjunctiva, and temporal conjunctiva with a possible total score between 0 and 9 points, with a score of more than 3 points considered to be abnormal. The normal subjects had clear corneas and conjunctiva on slit-lamp biomicroscopy and displayed no signs or symptoms of dry eye or other ocular diseases.
Measurement of Ocular Surface Temperature
Ocular surface temperature was measured using the new Ocular Surface Thermographer in a standard clinical room at a relatively constant temperature (26.5 ± 1.5 C), humidity (42.5 ± 2.5%), and brightness (300 lux). The subject’s head was placed in a standard ophthalmic chin and head rest, and the subject was instructed to look straight ahead. The measurements were performed under the conditions described by Mori and associates: the subject blinked normally, then closed both eyes for 5 seconds, and then kept the eyes open for more than 10 seconds. Ocular surface temperature was measured immediately after the eye was opened, and then every second during the 10 seconds of continuous eye opening.
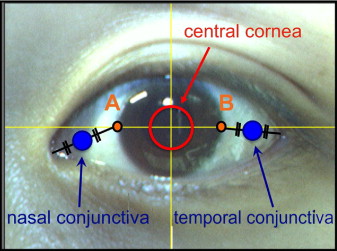
The temperature was measured in 3 regions: the central cornea, the nasal conjunctiva, and the temporal conjunctiva ( Figure 3 ). The center of the cornea was defined as a circular area 4 mm in diameter at the center of the cornea. To determine the nasal and temporal conjunctival regions, a horizontal line was drawn through the center of the cornea extending to both canthi. Then, the intersection of the line and the nasal and temporal corneal limbus were designated as points A and B, respectively. The nasal conjunctiva was defined as a circular region 2 mm in diameter, with its center at the midpoint of the line connecting the inner canthus with point A. Likewise, the temporal conjunctiva was defined as a circular region 2 mm in diameter with its center at the midpoint of the line connecting the lateral canthus with point B. The surface temperature was recorded over each region, and an average value for each region was calculated. Additionally, we recorded the body temperature immediately after we measured the ocular surface temperature.
Reliability of Ocular Surface Thermographer Measurements under Various Conditions
One ophthalmic technician (M.M.) was instructed on the operation protocol for the Ocular Surface Thermographer. After the examiner became proficient with the device, she was instructed to perform the measurements masked to the type of patient. We first determined the reliability of the measurements of the Ocular Surface Thermographer and the effect of various conditions on the reliability of the measurements. Ten healthy volunteers were asked to blink naturally for at least 10 seconds and then to close their eyes. Then, the ocular surface temperature was measured immediately after the eye was opened. Next, subjects were asked to close their eyes for 5 seconds, and ocular surface temperature was measured immediately after the eye was opened. In the third trial, the subjects were instructed to keep their eyes closed for 10 seconds before opening. In all 3 trials, the measurements were repeated 5 times for each volunteer, with at least a 5-minute interval between each measurement. Discrepancies between the 5 measurements obtained at the center of the cornea, nasal conjunctiva, and temporal conjunctiva were examined in each of the 10 subjects, and the reliability of the measurements was determined statistically.
Statistical Analyses
The reliability of ocular surface temperature measurements obtained by the Ocular Surface Thermographer was determined by calculating the intraclass correlation coefficients. Measurements were considered reliable when the intraclass correlation coefficient was more than 0.7. The temperature measured immediately and 10 seconds after eye opening and the change in temperature observed over a 10-second period of sustained eye opening are presented as the means ± standard deviations. Unpaired t tests were used to examine differences between ocular surface temperatures in patients with dry eye and those found in normal subjects. Multiple comparisons for temperature values found at the 3 regions of the ocular surface were made with the Tukey-Kramer test. A P value less than .05 was considered significant. The Spearman rank correlation test was performed to determine the correlations between the change in temperature at the center of the cornea and the results of other tear function examinations, including the Schirmer I test, TBUT, and the fluorescein staining score. The receiver operating characteristic curve technique was used to evaluate the sensitivity and specificity of the Ocular Surface Thermographer measurements of change in temperature each second after eye opening as a diagnostic index for dry eye.
Results
Display of Measurements on Ocular Surface Thermographer Monitor
A display of the Ocular Surface Thermographer measurements is shown in Figure 4 . The infrared and visible light images obtained when the eye was first opened are displayed in the upper left area of the screen. This feature enables easy identification of areas of interest during the data analyses, because placing the cursor on the infrared image automatically will display the corresponding portion of the visible light image. The infrared images obtained every second over a 10-second period are displayed at the bottom of the screen. The images are color coded so that changes in temperature can be seen as changes in the color of the images. In the upper right area of the screen, a graph plotting the changes in the temperature over the 10-second period at the surface of the white circular region and the value of net change in the temperature in that area are shown.
Reproducibility of Measurements
The intraclass correlation coefficients for the temperatures are shown in Table 1 . When the measurements were made immediately after eye opening after a 10-second period of natural blinking, the intraclass correlation coefficients were 0.900, 0.860, and 0.948 for the center of the cornea, nasal conjunctiva, and temporal conjunctiva, respectively. The intraclass correlation coefficients for the measurements performed immediately after eye opening after a 5-second period of eye closure were 0.947, 0.931, and 0.960, and the coefficients for measurements carried out after a 10-second period of eye closure were 0.958, 0.926, and 0.967 for the 3 regions, respectively. All values were more than 0.7. Even when the subjects were allowed to blink naturally before the measurements, it was possible to obtain reliable measurements of the ocular surface temperature. However, the measurements obtained after subjects closed their eyes for 5 seconds had the highest degree of reliability.
| Central Cornea | Nasal Conjunctiva | Temporal Conjunctiva | |
|---|---|---|---|
| Normal blinking a | 0.900 | 0.860 | 0.948 |
| After closing the eyes for 5 sec b | 0.947 | 0.931 | 0.960 |
| After closing the eyes for 10 sec c | 0.958 | 0.926 | 0.967 |
Stay updated, free articles. Join our Telegram channel

Full access? Get Clinical Tree


