Purpose
To investigate the retinal vessel diameter and evaluate the relationship of the retinal nerve fiber layer (RNFL) thickness with retinal vessel diameter and intraocular pressure (IOP) in patients with normal-tension glaucoma (NTG).
Design
A prospective, cross-sectional study.
Methods
This study included 60 previously untreated patients with NTG (60 eyes) and 45 age- and sex-matched healthy controls (45 eyes) that had no history of systemic vascular disease at a single institution. The diameters of the central retinal arteries and veins were measured on retinal photographs. The central retinal arteriolar equivalent (CRAE) and central retinal venular equivalent (CRVE) were calculated using the revised Parr-Hubbard formula. The RNFL thickness was measured using Stratus optical coherence tomography.
Results
The mean central retinal arteriolar ( P = .000) and venular ( P = .000) diameters were significantly smaller in the eyes with NTG than in the normal eyes. Multivariate linear regression analysis demonstrated a significant positive correlation between the RNFL thickness and CRAE ( P = .014), and a negative correlation between the RNFL thickness and IOP ( P = .005) in the eyes with NTG. However, there was no significant correlation between the RNFL thickness and the independent variables in the control group ( P = .112).
Conclusion
The patients with NTG had smaller diameters of the central retinal vessels than the normal subjects. Both IOP and CRAE were significantly associated with RNFL thickness in the patients with NTG. Our results suggest that narrower retinal vessels and higher IOP may be related to the thinning of the RNFL in patients with NTG.
Primary open-angle glaucoma (POAG) is a progressive, chronic optic neuropathy where intraocular pressure (IOP) and other currently unknown factors contribute to damage of the eyes; in the absence of other identifiable causes, there is characteristic acquired atrophy of the optic nerve as well as loss of retinal ganglion cells and their axons. Normal-tension glaucoma (NTG) is often defined as chronic open-angle glaucoma (OAG) with an IOP that always measures within the statistically normal range. The pathogenesis of NTG is considered to be multifactorial, although the underlying mechanisms have not been specifically defined. Elevated IOP is widely recognized as 1 of the risk factors for progression of NTG; its significant influence on the progression of visual field or neuroretinal rim damage in NTG has been documented. However, increasing evidence suggests that vascular mechanisms may play a role in this disease. Drance and associates found that low-tension glaucoma had a significantly higher rate of hemodynamic crisis, low systemic blood pressure, and low ophthalmic blood pressure. Rankin and Drance reported that chronic OAG and NTG had a higher prevalence of focal arteriolar narrowing than did ocular hypertension and normal groups. Berisha and associates found that a thinner retinal nerve fiber layer (RNFL) was associated with higher retinal blood flow in patients with early-stage NTG. Population-based studies have found a lower ocular perfusion pressure as a risk factor for OAG. The Barbados Eye Studies study group found that lower ocular perfusion pressures were related to the development of OAG. Choi and associates demonstrated that circadian mean ocular perfusion pressure fluctuation was the most consistent clinical risk factor for glaucoma severity in eyes with NTG. Sung and associates found that 24-hour mean ocular perfusion pressure fluctuation was the most consistent prognostic factor for NTG progression.
Among the studies supporting the vascular theory of glaucoma pathogenesis, some have focused on the diameter of the retinal vessels. Rader and associates found that the general narrowing of the caliber of retinal arteries was related to the severity of optic nerve damage in eyes with classic glaucoma and NTG. Mitchell and associates also demonstrated that eyes with OAG had a significantly smaller retinal arteriolar diameter, and that there was no significant difference in the mean retinal arteriolar diameter between the eyes with low- and high-pressure glaucoma. However, there is a paucity of studies that have evaluated the effects of IOP and retinal vascular diameter on glaucomatous damage. Therefore, we investigated the relationship between the retinal vascular diameter and the RNFL thickness and also evaluated the influence of IOP on RNFL in NTG.
Methods
This prospective study was conducted at the Department of Ophthalmology, Korea University Guro Hospital. Sixty previously untreated patients with the diagnosis of NTG and 45 age- and sex-matched control subjects were included in this study. Patients from 30 to 70 years of age who had no history of hypertension, diabetes, or other vascular diseases, and who had never had glaucoma treatment, were included in this study. Patients with high myopia greater than −6 diopters, peripapillary atrophy over 1 disc diameter, or a history of previous intraocular surgery were excluded from this study.
A detailed eye examination including Goldmann applanation tonometry, Humphrey central 30-2 threshold testing (Zeiss-Humphrey, San Leandro, California, USA), dilated 30-degree stereoscopic photograghy and 50-degree red-free photography using a Zeiss FF450 IR plus (Carl Zeiss Meditec, Inc, Dublin, California, USA), and measurement of retinal nerve fiber layer thickness with Zeiss Stratus optical coherence tomography (OCT) version 3.0 (Carl Zeiss Meditec, Inc) was performed in both eyes of the study subjects.
NTG was diagnosed when glaucoma hemifield test results were outside the normal limits or the standard deviation had a P value less than .05, or there was a cluster of 3 points or more in the pattern of the deviation plot in a single hemifield with a P value less than .05, 1 of which had to have a P value less than .01 on the Humphrey 30-2 test and/or a nerve fiber layer defect combined with a corresponding optic disc change. In addition, the IOP measured by Goldmann applanation tonometer was consistently less than 21 mm Hg. Gonioscopy excluded angle closure, rubeosis, and secondary glaucoma.
Untreated IOPs in the NTG patients and IOPs in the control subjects were taken on the first visit during 1 of the following 3 time periods: from 8 AM to 11 AM, from 11 AM to 2 PM, or from 2 PM to 5 PM. Two additional IOP measurements were obtained at different time periods on the next visits within 2 weeks. The median of 3 consecutive measurements was recorded each time. Most of the glaucoma evaluations other than IOP measurements (visual field test, photography, and OCT) were also done at the first visit. However, sometimes they were done within a 2-week interval of the first visit on the same day of the additional IOP measurements. Among the recorded IOPs from 3 separate occasions within a 2-week interval, the IOP measured within 2 hours of the fundus photography was used for the statistical analysis.
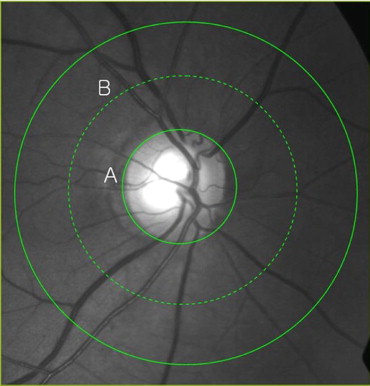
After confirming bilateral NTG patients and normal controls, 1 eye was randomly selected from each subject. Digitized 30-degree retinal photographs centered on the discs were obtained from all participants. Measurement of the retinal vessel diameter has been described elsewhere. In brief, the photographs were projected onto a 21-inch computer monitor ( Figure ). All arterioles and venules passing completely through a circumferential zone 0.5 to 1 disc diameter from the optic disc margin were measured in micrometers using computer-assisted software (Visupac/System Software version 4.2; Carl Zeiss, Pirmasens, Germany). One trained grader, masked to participant characteristics, performed all vessel measurements. The magnification of the optic media in an eye was corrected according to Littmann’s method, taking into account the refractive error. The anterior corneal curvature radius was set at 7.8 mm, which has been reported to be the mean for those of white and Chinese ethnicities. The central retinal arteriolar equivalent (CRAE) and central retinal venular equivalent (CRVE) were calculated using the revised Parr-Hubbard formula developed by Knudtson and associates. Reproducibility of the vessel diameter measurements was evaluated in this study; the intraclass correlation coefficient (95% confidence interval) was 0.854 for CRAE and 0.956 for CRVE.
Statistical analyses were performed using SPSS version 12.0 (SPSS Inc, Chicago, Illinois, USA). Outcome variables were compared between the NTG patients and control subjects by the independent t test and χ 2 test. The possible correlations between IOP, CRAE, CRVE, age, gender, refractive error, and RNFL thickness were evaluated using the stepwise multiple linear regression analysis in both groups. Data are presented as the mean ± standard deviation (SD). In all statistical analyses, a P < .05 was considered statistically significant. A sample size of 60 obtained 86% power to detect an R-squared (Rsq) of 0.23 attributed to 6 independent variables using the F test with a significance level of 0.05 (PASS2008 Ver 08.0.5; NCSS, LLC, Kaysville, Vermont, USA).
Results
The demographic and clinical characteristics of the NTG patients and control subjects are shown in Table 1 . There were no significant differences between the 2 groups except for the RNFL thickness, CRAE, and CRVE. The mean arteriolar diameter of the eye (CRAE) was significantly smaller in the NTG group (109.8 ± 12.0 μm) than in the control group (120.0 ± 11.3 μm, P = .000). The mean venular diameter (CRVE) was also significantly smaller in the NTG group (158.5 ± 17.6 μm) compared to the control group (176.8 ± 21.1 μm, P = .000).
| NTG a | Control a | P Value | |
|---|---|---|---|
| Sex (M:F) | 30:30 | 23:22 | .910 b |
| Age (years) | 53.7 ± 9.9 | 50.5 ± 7.2 | .074 c |
| IOP (mm Hg) | 14.8 ± 2.3 d | 14.1 ± 1.9 d | .079 c |
| RNFL thickness (μm) | 89.6 ± 12.9 | 109.9 ±12.0 | .000 c |
| CRAE (μm) | 109.8 ± 12.0 | 120.0 ± 11.3 | .000 c |
| CRVE (μm) | 158.5 ± 17.6 | 176.8 ± 21.1 | .000 c |
| AVR | 0.70 ± 0.09 | 0.69 ± 0.08 | .283 c |
| Refractive error (D) | −1.09 ± 2.3 | −0.64 ± 1.9 | .276 c |
| Total (n) | 60 | 45 |
a Data are presented as mean ± standard deviation.
The multivariate linear regression analysis was used to evaluate the association between several independent variables and the measured RNFL thickness in both groups. The chosen variables were age, gender, IOP, refractive error, CRAE, and CRVE. This model showed statistically significant results (Rsq = 0.225, P = .030); among these variables the CRAE and IOP revealed significant correlation with the RNFL thickness in the NTG eyes. The CRAE had a positive correlation with RNFL thickness (B = 0.383, P = .014), and the IOP had a negative correlation with the RNFL thickness (B = −2.108, P = .005) ( Table 2 ). In addition to the IOP and CRAE, there were no significant correlations between the RNFL and age, gender, refractive error, and CRVE in the NTG eyes ( Table 2 ). In the control group, however, there were no significant correlations between RNFL thickness and all of the chosen independent variables ( P = .112).
| Regression Coefficient (B) | 95% Confidence Interval | P Value | |
|---|---|---|---|
| Sex (M vs F) | 5.578 | −1.446∼12.602 | .117 |
| Age | −0.005 | −0.364∼0.354 | .978 |
| IOP | −2.108 | −3.536∼−0.679 | .005 |
| CRAE | 0.383 | 0.080∼0.687 | .014 |
| CRVE | −0.063 | −0.260∼0.134 | .526 |
| Refractive error (D) | 0.475 | −1.086∼2.036 | .544 |
Stay updated, free articles. Join our Telegram channel

Full access? Get Clinical Tree


