Purpose
To examine relationships of age, sex, and systemic and ocular conditions with retinal thickness measured by spectral-domain ocular coherence tomography (SD OCT) in participants without retinal disease.
Design
Longitudinal study.
Methods
setting : Population-based cohort. study population : Persons aged 43–86 years living in Beaver Dam, Wisconsin in 1988–1990. observation procedures : Retinal thickness was measured via SD OCT at the Beaver Dam Eye Study examination in 2008–2010. Retinal disease was determined by ophthalmoscopy, fundus photography, or SD OCT. main outcome measures : Retinal thickness from the inner limiting membrane to the Bruch membrane.
Results
The retina was thickest in the inner circle (mean 334.5 μm) and thinnest in the center subfield (285.4 μm). Mean retinal thickness decreased with age in the inner circle ( P < .0001) and outer circle ( P < .0001). Adjusting for age, eyes in men had thicker retinas than eyes in women in the center subfield ( P < .001) and inner circle ( P < .001). Sex, axial length/corneal curvature ratio, and peak expiratory flow rate were associated with center subfield thickness. Sex and peak expiratory flow rate were associated with retinal thickness in the inner circle. Alcohol consumption, age, axial length/corneal curvature ratio, cataract surgery, ocular perfusion pressure, and peak expiratory flow rate were associated with retinal thickness in the outer circle.
Conclusions
This study provides data for retinal thickness measures in eyes of individuals aged 63 years and older without retinal disease. This information may be useful for clinical trials involving the effects of interventions on retinal thickness and for comparisons with specific retinal diseases affecting the macula.
Spectral-domain optical coherence tomography (SD-OCT) is a noninvasive, quantitative method of imaging that is widely used in clinical practice. SD OCT has been used in clinical trials to measure retinal thickness of the macula and document the presence of anatomic changes in retinal diseases. Description of SD OCT changes in eyes with and without retinal disease has been limited, coming largely from small studies of select groups of patients often younger than 75 years of age who attended ophthalmology clinics or participated in clinical trials where severe disease was over-represented. Additionally, normative data provided by SD OCT manufacturers are limited because details about the populations used to create these datasets are not publicly available.
There are few SD OCT measurements in the general population of morphologic features of eyes with and without retinal disease and these reports are especially lacking for persons aged 85 years and older, who are particularly at risk of developing age-related retinal disease. Because SD OCT thickness of the macula is the primary outcome measure in many current clinical trials, a well-described set of retinal thickness data would be of value for purposes of planning these trials and evaluating their findings. In this report, we examine relationships of age, sex, and systemic and ocular conditions with SD OCT–measured retinal thickness in participants aged 63 years and older without retinal disease in the Beaver Dam Eye Study.
Methods
Population
Methods used to identify the population and descriptions of the population have appeared in previous reports. In brief, there were 5924 persons identified in a private census of whom 4926 participated in the baseline examination between March 1, 1988 and September 15, 1990. Subjects were invited to 4 follow-up examinations spaced 5 years apart. The analyses and findings reported here are limited to the 3032 eyes from 1544 individuals who participated in the 20-year follow-up in 2008–2010, the first examination at which SD OCT scans were obtained. Comparisons between participants and nonparticipants at each examination have appeared elsewhere. Ninety-nine percent of the population was white. Approval for this study was granted by the Institutional Review Board at the University of Wisconsin. Informed consent was obtained from each participant before every examination. The tenets of the Declaration of Helsinki were observed.
Procedures
A standardized interview and examination were administered. Information on demographic characteristics and other risk factors, including smoking and drinking habits, were obtained from the questionnaire. Height, weight, refraction, blood pressure, pupil size, peak expiratory flow rate, and visual acuity were measured by trained examiners. Refraction was only measured in individuals who did not have a history of cataract surgery. Stereoscopic 30-degree color fundus photographs centered on the disc (Diabetic Retinopathy Study standard field 1) and macula (Diabetic Retinopathy Study standard field 2) were obtained for each eye. Intraocular pressure was measured by applanation tonometry using a Goldmann tonometer. Axial length and corneal curvature were measured by the Zeiss IOL Master (Carl Zeiss Meditec Inc, Dublin, California, USA). Glycosylated hemoglobin A1c was measured by RXL Dimension immunoassay (Siemens Medical Solutions USA, Inc., Malvern, Pennsylvania). Oxygen saturation was measured by pulse oximetry.
Methods used to photograph and grade the lens for cataract and the retina for retinal disease have been described in detail elsewhere. Presence of cataract surgery was determined by history along with the date of surgery and was corroborated by red reflex photographs. Retinopathy was graded in a masked fashion using an abbreviation of the modified Airlie House classification scheme.
SD OCT images were obtained at the 20-year examination using the Topcon SD OCT (Topcon 3D-OCT 1000-Mark II, Topcon Corporation, Tokyo, Japan) and were processed with Topcon 3D-OCT software (version 3.32). Using a universal OCT viewer (version 1.01.04, a universal SD OCT viewing program created by one of the authors of this report [YH]), the grader centered an Early Treatment of Diabetic Retinopathy Study grid on the center of the fovea, at which point the thickness of the retina was measured between the internal limiting membrane and Bruch membrane using the Topcon 3D-OCT segmentation algorithm. The grader then reviewed the segmentation in the scan and assessed the reliability of the retinal and retinal pigment epithelium (RPE) thickness segmentation in the central subfield, the inner circle, and the outer circle. Each region (central, inner, and outer) was graded as “acceptable,” “unacceptable,” or “cannot grade.” Any region for which the grade was “unacceptable” or “cannot grade” was excluded for analysis for all subfields within the region (eg, if the grade for the inner circle was unacceptable, then the grade for all 4 subfields within the inner circle as well as the inner subfield thickness average was excluded from analysis). The tissue contrast index (TCI), which measures image quality based on the signal-to-noise ratio in the image, was calculated by the Universal OCT software. Eyes with TCI < 5, corresponding to the threshold SD OCT manufacturers recommended for use of an image, were excluded from analyses.
Definitions
Retinal thickness was defined as the thickness of the retina between the internal limiting membrane and Bruch membrane. Mean arterial blood pressure (MABP) was defined as systolic blood pressure + (2 × diastolic blood pressure) ÷ 3. Pulse pressure was defined as the systolic minus the diastolic blood pressure. Ocular perfusion pressure in each eye was defined by the following formula: OPP = (D + [S − D] ÷ 3) − IOP, where OPP = ocular perfusion pressure, S = systolic blood pressure, D = diastolic blood pressure, and IOP = intraocular pressure. Diabetes status was defined as self-report of physician diagnosis with or without use of hypoglycemic medications or elevated (≥6.5%) glycosylated hemoglobin level. Body mass index was calculated by dividing a participant’s weight in kilograms by height in meters squared. Current smokers were identified as persons having smoked ≥100 cigarettes in their lifetime and were smoking at the time of the examination. Past smokers had smoked in the past but had stopped at the time of the examination. Pack-years smoked was defined as the average number of cigarettes smoked in a day divided by 20 and multiplied by the number of years the individual smoked. Never smokers were considered to have smoked 0 pack-years. Current heavy drinking was defined as consuming 4 or more servings of alcoholic beverages daily; a serving was defined as 12 fluid ounces of beer, 4 fluid ounces of wine, or 1.5 fluid ounces of liquor. Past heavy drinkers had consumed 4 or more servings of alcohol per day in the past but had stopped by the time of the examination.
Eyes with moderate early or more severe age-related macular degeneration (levels 30–50 on the Three Continent Consortium severity scale), epiretinal membranes, macular holes or cysts, posterior vitreoretinal traction, moderate nonproliferative or more severe diabetic retinopathy (more severe than Early Treatment of Diabetic Retinopathy Study severity level 31), macular edema, focal or scatter laser treatment in the macula, retinal vein or arterial occlusion, macular dystrophy, myopic degeneration, histoplasmosis or toxoplasmosis, retinal and chorioretinal inflammatory conditions, and coloboma/staphyloma as determined by ophthalmoscopy, fundus photography, or SD OCT were considered to have retinal disease. An individual with at least 1 eye with retinal disease was considered to have retinal disease. The axial length/corneal curvature ratio was defined as the axial length divided by the corneal curvature measurement.
Statistical Analysis
Measures of retinal thickness and covariates were obtained at the fifth Beaver Dam Eye Study examination and analyzed cross-sectionally. Thickness measures from the center subfield, the average of the 4 inner subfields (inner circle), and the average of the 4 outer subfields (outer circle) were used in analyses. Analyses were done in each eye separately, and relationships between each covariate and retinal thickness measure were modeled using generalized estimating equations with an exchangeable working correlation structure to account for correlation between the 2 eyes from a single participant. Relationships of covariates to each retinal thickness measure (center subfield, inner circle, and outer circle) were first modeled linearly, adjusting only for age and sex. Quadratic and third-order terms were tested for continuous risk factors, and significant higher-order associations, adjusted for age and sex, were plotted for ease of interpretation. Because it is highly dependent on age and sex, peak expiratory flow rate was analyzed in sex-specific quartiles comparing the highest 3 quartiles to the lowest quartile.
We then created a separate multivariate model for the thickness measure in each subfield/region in 4 steps. First, we compared the Quasi-likelihood under Independence Model Criterion (QIC) for each age/sex-adjusted model to determine which measure of eye size and shape (axial length alone, corneal curvature alone, axial length and corneal curvature as independent terms in the same model, or axial length/corneal curvature ratio) best captured the association of eye size and shape to each thickness measure. We did not consider models with refraction because refraction was not measured in eyes with a history of cataract surgery. Second, we added to each model all the other factors that were associated with the thickness measure, including significant higher-order terms, in age/sex-adjusted analyses (full model). Third, we used backward selection to arrive at a final multivariate model for the retinal thickness measure in each subfield/region (reduced model). Finally, because peak expiratory flow rate is highly correlated with age, sex, and body size, model selection was done without peak expiratory flow rate as a covariate. SAS version 9.3 (SAS Institute, Cary, North Carolina, USA) was used for all analyses.
Results
Participant Characteristics
There were 3032 eyes from 1544 individuals who had macular SD OCT scans at the 20-year follow-up. Of these, 95 eyes were excluded because the grader could not appropriately center the grid or determined that all measurements in the center subfield and inner and outer circles were unreliable, and 171 eyes were excluded for having TCI less than 5. Of the 2766 eyes with gradable scans, 928 eyes were considered to have a retinal disease or condition. Twenty had macular edema, 31 had a traumatic injury, 19 had laser treatment, 6 had a retinal vein occlusion, 7 had macular dystrophy, 8 had myopic degeneration, 5 had presumed ocular histoplasmosis syndrome, 1 had a chorioretinal inflammatory condition, 609 had an epiretinal membrane, 292 had moderate early or more severe age-related macular degeneration, 71 had a macular hole, 89 had a retinal cyst, 25 had posterior vitreoretinal traction, and 60 had moderate or more severe diabetic retinopathy greater than level 31 (not mutually exclusive). Further, 68 center subfields, 27 inner circles, and 94 outer circles were excluded for poor reliability, leaving 1838 eyes (1770 center subfields, 1811 inner circles, and 1744 outer circles) from 977 individuals eligible for analyses. The mean TCI for these images was 6.36 (standard deviation [SD] = 0.56). Reliability was graded as very reliable (there were no complications in scan quality, eg, mirror or motion artifact) in 1680, 1716, and 1217 images and moderately reliable (there was a complication in scan quality but it did not affect the reliability of the thickness measures) in 90, 95, and 527 images in the center subfield, inner circle, and outer circle, respectively.
Compared to individuals/eyes excluded from analyses, those included were younger (mean age 72.6 vs 76.4 years) and, after adjusting for age and sex, had lower glycosylated hemoglobin (mean 5.9% vs 6.0%), a smaller axial length/corneal curvature ratio (mean 3.08 vs 3.09), better contrast sensitivity (mean 1.6 vs 1.5 log contrast sensitivity), a higher TCI (mean 6.36 vs 6.18), and a thinner retina in the center subfield and inner and outer circles ( Table 1 ). Individuals/eyes included were less likely to have had cataract surgery (18.3% vs 34.3%), have diabetes present (17.3% vs 23.0%), have an increasing number of “C” risk alleles for Complement Factor H Y402H rs1061170 gene (11.8% vs 15.8% with the C/C genotype), have an increasing number of “T” risk alleles for Age-related Maculopathy Susceptibility 2 rs10490924 gene (3.3% vs 6.1% with the T/T genotype), and have visual impairment (1.4% vs 6.3%). There were no significant differences found between those included and excluded from analyses in sex distribution, smoking status, history of cardiovascular disease, or presence of nuclear cataract.
| Covariate | Mean (SD), %, or Ratio | P Value a | |
|---|---|---|---|
| Included N = 977 Individuals/1838 Eyes | Excluded N = 525 Individuals/928 Eyes | ||
| Age, y | 72.6 (6.3) | 76.4 (7.5) | .001 |
| Sex, male | 44.6 | 41.9 | .76 |
| Height, in | 64.8 (3.8) | 64.3 (4.0) | .94 |
| Weight, lb | 182.8 (42.1) | 177.3 (42.0) | .89 |
| Body mass index, kg/m² | 31.3 (6.3) | 30.8 (6.2) | .89 |
| Positive history of current smoking | 7.3 | 6.1 | .95 |
| Pack-years smoked | 14.4 (23.9) | 13.3 (24.5) | .84 |
| Glycosylated hemoglobin A1c, % | 5.9 (0.7) | 6.0 (0.8) | .02 |
| Diabetes present | 17.3 | 23.0 | .01 |
| Mean arterial blood pressure, mm Hg | 93.4 (11.0) | 91.5 (10.7) | .11 |
| Intraocular pressure, mm Hg | 15.8 (3.0) | 15.5 (2.8) | .30 |
| Ocular perfusion pressure, mm Hg | 46.6 (7.5) | 45.5 (6.9) | .16 |
| Vertical cup-to-disc ratio | 0.4 (0.1) | 0.4 (0.1) | .02 |
| Peak expiratory flow rate, L/min | 362.4 (134.7) | 336.2 (129.8) | .95 |
| Cardiovascular disease present | 14.6 | 18.5 | .24 |
| Positive history of myocardial infarction | 9.2 | 11.8 | .33 |
| Positive history of stroke | 2.1 | 2.5 | .72 |
| Positive history of angina | 7.1 | 9.2 | .59 |
| Refraction, diopters | 0.6 (2.2) | 0.3 (2.6) | <.001 |
| Axial length/corneal curvature ratio | 3.1 (0.1) | 3.1 (0.1) | .006 |
| Pupil size, cm | 0.6 (0.1) | 0.6 (0.1) | >.99 |
| Central cataract present | 18.6 | 26.5 | .63 |
| Positive history of cataract surgery | 18.3 | 34.3 | <.001 |
| Visual impairment worse than 20/40 | 1.4 | 6.3 | <.001 |
| Contrast sensitivity, Log CS | 1.6 (0.1) | 1.5 (0.2) | <.001 |
| CFH genotype | .03 b | ||
| T/C | 47.9 | 48.1 | |
| T/T | 11.8 | 15.8 | |
| ARMS2 genotype | .03 b | ||
| G/T | 36.9 | 38.7 | |
| T/T | 3.3 | 6.1 | |
| Center subfield thickness, μm | 287.5 (27.0) | 294.1 (39.9) | <.001 |
| Inner circle thickness, μm | 335.0 (17.2) | 335.7 (22.6) | .04 |
| Outer circle thickness, μm | 289.9 (14.5) | 291.5 (16.3) | .003 |
| Tissue contrast index | 6.4 (0.6) | 6.2 (0.6) | <.001 |
Variability of Retinal Thickness by Subfield, Age, and Sex
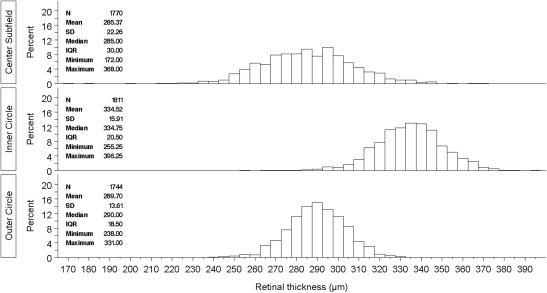
Figure 1 shows the distribution of retinal thickness in the center subfield and inner and outer circles. The retina was thickest in the inner circle (mean 334.5 μm, median 334.8 μm) and thinnest in the center subfield (mean 285.4 μm, median 285.0 μm). Retinal thickness was most variable in the center subfield (SD 22.3 μm, range 172.0–368.0 μm) and least variable in the outer circle (SD 13.6 μm, range 238.0–331.0 μm). The retina was thickest in the nasal subfield (341.3 ± 17.9 μm and 306.0 ± 17.0 μm in the inner and outer circles, respectively), and was thinnest in the temporal subfield in the inner circle (329.0 ± 17.2 μm) and in the inferior region of the outer circle (281.3 ± 14.7 μm, Table 2 ). Retinal thickness was highly symmetric between eyes of the same subject. The correlation in thickness measures between the eyes was 0.89 for the center subfield and 0.87 and 0.88 for the inner and outer circles, respectively.
| Subfield | Mean | SD | Minimum | Maximum |
|---|---|---|---|---|
| Center (1770 eyes) | 285.4 | 22.3 | 172.0 | 369.0 |
| Inner (1811 eyes) | ||||
| Inferior | 332.9 | 17.2 | 226.0 | 480.0 |
| Nasal | 341.3 | 17.9 | 113.0 | 400.0 |
| Superior | 334.9 | 15.9 | 243.0 | 387.0 |
| Temporal | 329.0 | 17.3 | 180.0 | 384.0 |
| Outer (1744 eyes) | ||||
| Inferior | 281.3 | 14.7 | 206.0 | 341.0 |
| Nasal | 306.0 | 17.0 | 181.0 | 355.0 |
| Superior | 288.3 | 13.8 | 205.0 | 335.0 |
| Temporal | 283.2 | 15.1 | 194.0 | 332.0 |
Mean retinal thickness decreased with age in the inner circle (youngest vs oldest age group, P value for trend per increasing age group: 337.8 vs 325.7 μm, P < .0001) and outer circle (292.4 vs 282.7 μm, P < .001) but not the center subfield (286.9 vs 279.9 μm, P = .07; Table 3 ). Adjusting for age, men had thicker retinas than women in the center subfield (men vs women, P value: 289.5 vs 273.8 μm, P < .001) and inner circle (337.1 vs 332.5 μm, P < .001) but not the outer circle (290.7 vs 288.9 μm, P = .08). Adjusting for age, macular thickness in women taking oral estrogen (n = 38) was on average 4.0 μm, 3.3 μm, and 4.4 μm greater in the center subfield, inner circle, and outer circle, respectively, than in women not taking oral estrogen, although these differences were not statistically significant.
| Area of Measurement | Age, Years | Male | Female | Overall | P Values | |||||||
|---|---|---|---|---|---|---|---|---|---|---|---|---|
| N | Mean | SD | N | Mean | SD | N | Mean | SD | Age Trend | Male vs Female a | ||
| Center subfield | 63–69 | 342 | 295.3 | 21.8 | 360 | 279.0 | 20.0 | 702 | 286.9 | 22.4 | .07 | <.001 |
| 70–74 | 215 | 290.9 | 20.8 | 289 | 278.1 | 20.1 | 504 | 283.6 | 21.4 | |||
| 75–79 | 122 | 290.6 | 21.7 | 161 | 281.8 | 23.6 | 283 | 285.6 | 23.2 | |||
| 80–84 | 71 | 287.7 | 24.4 | 131 | 285.4 | 22.1 | 202 | 286.2 | 22.9 | |||
| ≥85 | 31 | 289.5 | 18.9 | 48 | 273.8 | 18.8 | 79 | 279.9 | 20.3 | |||
| Overall | 781 | 292.4 | 21.8 | 989 | 279.8 | 21.0 | 1770 | 285.4 | 22.3 | |||
| Inner circle | 63–69 | 351 | 340.8 | 16.0 | 364 | 334.8 | 14.9 | 715 | 337.8 | 15.7 | <.001 | <.001 |
| 70–74 | 216 | 336.0 | 16.8 | 299 | 332.0 | 14.5 | 515 | 333.7 | 15.6 | |||
| 75–79 | 127 | 332.1 | 15.5 | 165 | 332.4 | 14.8 | 292 | 332.2 | 15.1 | |||
| 80–84 | 73 | 333.2 | 15.0 | 135 | 331.4 | 15.6 | 208 | 332.0 | 15.4 | |||
| ≥85 | 31 | 331.1 | 17.9 | 50 | 322.4 | 16.6 | 81 | 325.7 | 17.5 | |||
| Overall | 798 | 337.1 | 16.5 | 1013 | 332.5 | 15.2 | 1811 | 334.5 | 15.9 | |||
| Outer circle | 63–69 | 336 | 293.6 | 13.0 | 351 | 291.2 | 13.4 | 687 | 292.4 | 13.3 | <.001 | .08 |
| 70–74 | 208 | 290.1 | 13.8 | 289 | 288.5 | 13.0 | 497 | 289.2 | 13.4 | |||
| 75–79 | 125 | 287.0 | 13.4 | 161 | 287.8 | 12.4 | 286 | 287.5 | 12.8 | |||
| 80–84 | 68 | 288.0 | 14.2 | 128 | 287.5 | 13.6 | 196 | 287.7 | 13.8 | |||
| ≥85 | 31 | 284.5 | 18.3 | 47 | 281.5 | 13.8 | 78 | 282.7 | 15.7 | |||
| Overall | 768 | 290.7 | 13.9 | 976 | 288.9 | 13.3 | 1744 | 289.7 | 13.6 | |||
Relationships of Retinal Thickness With Ocular and Systemic Characteristics
Adjusting for age and sex, a greater axial length ( P = .03) and a greater axial length/corneal curvature ratio ( P = .0001) were linearly associated with a thicker retina in the center subfield. A greater corneal curvature ( P = .005), being a past compared to never smoker ( P = .004), having a greater number of pack-years smoked ( P = .02), and having a lower peak expiratory flow rate ( P = .002) were linearly associated with a thinner retina in the center subfield ( Table 4 ). More hyperopic refraction ( P < .001) was linearly associated with a thicker retina in the inner circle, and a longer axial length ( P < .001), a greater corneal curvature ( P = .01), a greater number of pack-years smoked ( P = .01), a history of past heavy drinking ( P = .04), and a lower peak expiratory flow rate ( P < .001) were associated with a thinner retina in the inner circle. A more hyperopic refraction ( P < .001) and a history of current heavy drinking ( P = .005) were linearly associated with a thicker retina in the outer circle and a longer axial length ( P < .001), a greater corneal curvature ( P < .001), a greater axial length/corneal curvature ratio ( P < .0001), a history of cataract surgery ( P = .003), a higher ocular perfusion pressure ( P = .01), a higher MABP ( P = .02), and a lower peak expiratory flow rate ( P < .001) were associated with a thinner retina in the outer circle. The relationship of peak expiratory flow rate to retinal thickness in the inner and outer circles remained after further adjustment for oxygen saturation level and when analyses were restricted to nonsmokers. No associations were found between pupil size, intraocular pressure, height, body mass index, weight, current history of diabetes, or glycosylated hemoglobin in nondiabetic persons and any of the retinal thickness measures.
| Covariate | Center Subfield | Inner Circle | Outer Circle | |||||||||
|---|---|---|---|---|---|---|---|---|---|---|---|---|
| N | Mean (SD) | β (95% CI) | P Value a | N | Mean (SD) | β (95% CI) | P Value a | N | Mean (SD) | β (95% CI) | P Value a | |
| Axial length, per mm | 1.3 (0.1, 2.4) | .03 | −1.8 (−2.7, −0.9) | <.001 | −3.1 (−3.9, −2.4) | <.001 | ||||||
| Corneal curvature, per mm | −6.4 (−10.8, −1.9) | .005 | −5.4 (−8.7, −2.1) | .002 | −6.3 (−9.2, −3.5) | <.001 | ||||||
| Axial length/corneal curvature ratio, per mm | 18.0 (8.8, 27.2) | <.001 | −5.7 (−12.0, 0.5) | .07 | −13.8 (−19.3, −8.4) | <.001 | ||||||
| Refraction, per diopter | −0.4 (−0.9, 0.1) | .11 | 0.8 (0.4, 1.2) | <.001 | 1.1 (0.8, 1.5) | <.001 | ||||||
| Cataract status | ||||||||||||
| None | 1191 | 286.3 (22.0) | Referent | 1212 | 336.1 (15.8) | Referent | 1182 | 291.2 (13.2) | Referent | |||
| Nuclear cataract | 253 | 282.7 (21.3) | 0.1 (−3.3, 3.5) | .97 | 264 | 332.1 (14.6) | −0.2 (−2.1, 1.7) | .86 | 248 | 288.0 (13.8) | −0.7 (−2.2, 0.8) | .34 |
| Cataract surgery | 320 | 284.1 (23.8) | 0.7 (−3.6, 5.0) | .74 | 329 | 330.7 (16.6) | −1.7 (−4.4, 1.1) | .23 | 308 | 285.4 (14.1) | −3.2 (−5.4, −1.1) | .003 |
| Pupil size, per mm | −0.9 (−16.5, 14.7) | .91 | 4.2 (−7.3, 15.8) | .47 | −1.8 (−12.0, 8.5) | .73 | ||||||
| IOP, per 5 mm Hg | 0.7 (−0.7, 2.2) | .33 | −0.2 (−1.4, 1.0) | .77 | 0.6 (−0.5, 1.7) | .29 | ||||||
| OPP, per 5 mm Hg | −0.7 (−1.5, 0.1) | .10 | −0.3 (−0.9, 0.3) | .36 | −0.7 (−1.2, −0.8) | .01 | ||||||
| Smoking status | ||||||||||||
| Never | 868 | 285.8 (22.0) | Referent | 883 | 335.1 (15.5) | Referent | 849 | 290.0 (13.8) | Referent | |||
| Past | 772 | 285.4 (22.4) | −3.7 (−6.3, −1.1) | .005 | 795 | 333.9 (16.4) | −1.9 (−3.8, −0.0) | .05 | 765 | 289.3 (13.6) | −0.6 (−2.3, 1.1) | .47 |
| Current | 130 | 282.2 (23.5) | −3.6 (−8.9, 1.6) | .18 | 133 | 334.1 (15.7) | −1.7 (−5.4, 2.0) | .37 | 130 | 289.8 (12.5) | −1.0 (−4.0, 1.9) | .49 |
| Pack-years smoked, per 5 | −0.3 (−0.5, −0.0) | .02 | −0.3 (−0.5, −0.1) | .005 | −0.1 (−0.2, 0.1) | .45 | ||||||
| History of heavy drinking | ||||||||||||
| Never | 1527 | 284.4 (22.2) | Referent | 1566 | 334.5 (15.7) | Referent | 1506 | 289.7 (13.6) | Referent | |||
| Past | 218 | 290.7 (22.4) | −0.3 (−4.3, 3.8) | .91 | 220 | 333.8 (17.4) | −3.7 (−6.9, −0.5) | .02 | 213 | 288.7 (13.9) | −2.5 (−5.1, 0.1) | .06 |
| Current | 24 | 297.0 (18.8) | 4.7 (−4.8, 14.2) | .33 | 24 | 343.7 (12.3) | 7.1 (−0.7,14.9) | .07 | 24 | 298.3 (8.4) | 7.7 (2.4, 13.0) | .005 |
| Height, per in | −0.3 (−0.8, 0.2) | .17 | −0.0 (−0.4, 0.3) | .92 | −0.1 (−0.4, 0.19) | .47 | ||||||
| BMI, per 3 kg/m² | −0.1 (−0.67, 0.51) | .79 | −0.3 (−0.7, 0.2) | .26 | −0.1 (−0.5, 0.3) | .53 | ||||||
| Weight, per 10 lb | −0.1 (−0.5, 0.2) | .46 | −0.1 (−0.4, 0.1) | .27 | −0.1 (−0.3, 0.1) | .38 | ||||||
| Diabetes status | ||||||||||||
| Absent | 1413 | 285.1 (22.5) | Referent | 1449 | 334.8 (16.2) | Referent | 1394 | 290.1 (13.8) | Referent | |||
| Present | 309 | 287.7 (21.4) | 0.7 (−2.5, 4.0) | .66 | 312 | 333.2 (15.1) | −1.9 (−4.2, 0.5) | .13 | 301 | 288.0 (13.0) | −1.9 (−4.0, 0.1) | .07 |
| HbA1c, per % b | −1.3 (−6.4, 3.8) | .63 | 1.7 (−2.0, 5.5) | .36 | 2.3 (−0.8, 5.3) | .15 | ||||||
| MABP, per 5 mm Hg | −0.4 (−1.0, 0.2) | .23 | −0.2 (−0.7, 0.2) | .27 | −0.4 (−0.8, −0.1) | .03 | ||||||
| PEFR, L/min | ||||||||||||
| F: >241, M: >371 | 1291 | 286.9 (22.4) | Referent | 1317 | 336.6 (15.3) | Referent | 1274 | 291.1 (13.1) | Referent | |||
| F: ≤240, M: ≤370 | 467 | 281.2 (21.5) | −5.5 (−8.4, −2.6) | <.001 | 481 | 328.9 (16.5) | −6.5 (−8.7, −4.2) | <.001 | 457 | 285.7 (14.4) | −4.4 (−6.4, −2.4) | <.001 |
| Oxygen saturation, per % | 0.2 (−0.4, 0.9) | .50 | 0.1 (−0.4, 0.6) | .74 | −0.0 (−0.5, 0.4) | .84 | ||||||
Stay updated, free articles. Join our Telegram channel

Full access? Get Clinical Tree


