Purpose
To compare the retinal sensitivity at the junctional zone and uninvolved retina of eyes with geographic atrophy (GA) due to age-related macular degeneration (AMD).
Design
Cross-sectional, observational study.
Methods
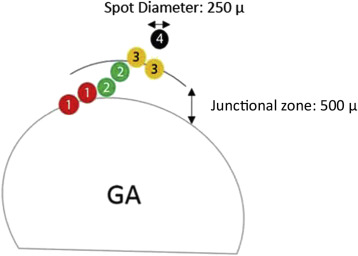
Patients with dry AMD were evaluated by microperimetry and Cirrus optical coherence tomography (OCT). The GA lesion was segmented on en face OCT images and registered to color images with the microperimetric sensitivity values. The junctional zone, a ring 500 μm in width, surrounding the region of atrophy was further subdivided into “subzones”: Zone 1 at the precise border of atrophy; Zone 2 as the center of this junctional region; Zone 3 at the border between the junctional zone and adjacent “normal” retina. An additional Zone 4 was defined as “normal” retina, at least 500 μm from the edge of the GA lesion. The mean sensitivities of all stimuli within each of these zones (across the entire cohort) were compared.
Results
In 36 eyes with GA, the mean retinal sensitivity in the various subzones was as follows: Zone 1 = 13.7 ± 4.7, Zone 2 = 20.3 ± 3.9, Zone 3 = 20.9 ± 3.9, and Zone 4= 21.1 ± 4.1 (all in dB). Zone 1 (atrophic margin) sensitivity was significantly lower than all other zones ( P < .001 for all comparisons), but there were no differences between the other zones.
Conclusion
Retinal sensitivity appears to drop precipitously at the margins of GA lesions. The retinal sensitivity in the bulk of the junctional zone is similar to apparently uninvolved distant regions.
Geographic atrophy (GA), which is the end-stage manifestation of nonexudative age-related macular degeneration (AMD), has been described as an ongoing process that involves loss of the retinal pigment epithelium (RPE) as well as the associated choriocapillaris and overlying photoreceptors. Loss of these structures and the development and progression of GA have traditionally been monitored by stereoscopic color fundus photographs, and more recently by fundus autofluorescence (FAF) and/or spectral-domain optical coherence tomography (SDOCT).
For decades, best-corrected visual acuity has been the main indicator of visual function in retinal diseases; however, as it is based on responses from the foveal cones, it does not represent a comprehensive assessment of macular function. This is particularly true for GA patients whose entire visual function depends on the amount and location of the atrophic lesions, and as such, the extent of GA typically does not correlate with visual acuity unless the foveal center is involved.
Functional testing in and around the areas of GA may provide additional useful information regarding the severity and extent of disease in the macula, and the potential impact of new therapeutic agents. More recently, microperimetry has effectively provided fundus-correlated functional testing, test-retest reliability for the same test point, precise assessment of the location and stability of fixation, and compensation for ocular movements. By incorporating these features, microperimetry has become the clinical investigation of choice to assess residual visual function and functional vision beyond the fovea in macular diseases.
Assessing the visual function by microperimetry in GA trials has addressed some of the limitations of relying on visual acuity for evaluating functional therapeutic response in clinical trials. For example, in a GA trial in which OT-551 was topically administered as a possible treatment of GA, although visual acuity suggested a possible beneficial effect of the treatment, microperimetry demonstrated that progressive visual sensitivity loss was occurring that mirrored the anatomic progression of the atrophy.
In another study microperimetry was able to demonstrate changes in regional sensitivity in 12 months in eyes with progressive atrophic macular disease and stable acuity.
Meleth and associates showed that the macular sensitivity undergoes progressive change during the GA progression, reflecting alterations in macular function extending beyond the GA lesion. They suggested that microperimetry might provide useful functional outcome measures for the clinical study of GA. Change in mean sensitivity and the number of absolute scotomatous points were suggested as endpoints for GA trials by them.
The first microperimeter (SLO 101; Rodenstock, Ottobrunn, Germany), which was introduced in the year 1982, did not have an eye tracker. This limitation has been overcome by Nidek MP-1 (Nidek Technologies, Padova, Italy), which was introduced to the market in 2003 as the first fundus perimeter with an eye tracker that compensates for eye movements based on an initial frame. The MP-1, however, was limited by the dynamic range of stimulus attenuation (0–20 dB), which could potentially hinder the detection and evaluation of regions with only mild depressions in sensitivity relative to normals. Recently, the next generation of this microperimeter, Nidek MP-3 (Nidek Technologies), has been introduced and provided a wider range of stimulus intensities (0–34 dB). In this study, we sought to use the greater stimulus dynamic range to more precisely map the functional integrity of the retinal regions surrounding areas of GA.
Methods
For this cross-sectional, observational study, subjects with nonneovascular AMD (of various stages: early, intermediate, and advanced) were recruited from the medical retina clinics (single physician, S.R.S.) of the Doheny – UCLA Eye Center in Pasadena, California from June 5, 2015 to November 25, 2015. The stage of the disease (drusen only or presence of atrophy) was determined by the examining physician. The research was approved by the Institutional Review Board of the University of California – Los Angeles and adhered to the tenets set forth in the Declaration of Helsinki. All patients signed written informed consent. Patients with prior or current evidence of choroidal neovascularization or other chronic diseases (eg, glaucoma, diabetic retinopathy), or significant media opacity (“significant” defined as having an impact on vision in the opinion of the treating physician) and patients who were not able to cooperate with the microperimetry examination, such as patients with significant movement disorders (which precluded their ability to depress response button), were excluded from the study.
All participants were dilated with tropicamide 1% and phenylephrine 2.5% before OCT imaging and microperimetry. SDOCT imaging in both eyes was performed using the Cirrus HD-OCT (Carl Zeiss Meditec, Inc, Dublin, California, USA) with a 512 × 128 macular cube protocol (6 × 6 mm centered on the fovea). The Cirrus OCT was chosen because it includes FDA-cleared software for visualization and quantification of GA from en face OCT images.
Retinal sensitivity measurements were obtained with the Nidek MP-3 (Nidek Technologies), using the manufacturer-specified instructions for testing. As the testing conditions were mesopic, no dark or light adaptation was used prior to testing, and the testing was performed in a darkened and quiet room.
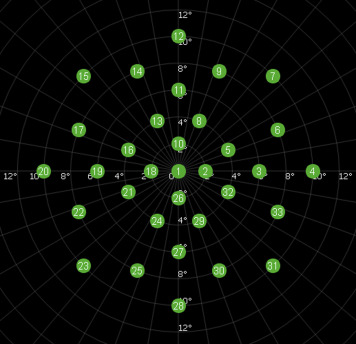
After instructions were given for the microperimetry testing, patients were tested using a standardized protocol for all patients. All tests were conducted by 2 experienced microperimetry examiners who had performed more than 20 tests with the MP-3 prior to enrolling subjects in the current study. A red cross was used as a fixation target, and Goldman III–sized stimuli (0.43 degrees, or approximately 125 μm) with a duration of 200 ms was presented against a white background of 31.4 asb using a 4-2 staircase threshold strategy. The examiner viewed the fundus on the instrument monitor in real time as the examinee was shown the stimuli; the maximum possible sensitivity of the stimulus was 34 dB of attenuation. A custom grid designed to assess the macular region was used and consisted of 33 points located at 0, 2, 4, 6, 8, and 10 degrees from fixation ( Figure 1 ).
The MP-3 instrument (Nidek Technologies) also has an option that allows the examiner to add additional test points to the standardized examination. Because the GA lesion could be visualized in the live monitor (infrared image with a resolution of 640 × 480 pixels), for cases where fewer than 5 of the 33 sensitivity points fell within the junctional zone and normal-appearing retina, additional test points were added by the examiner to the nonatrophic regions of the macula to ensure that every lesion/eye had at least 5 point beyond the atrophic area. Thus, the mean number of stimulus points tested per subject was 39 rather than 33. After completion of the sensitivity testing, a color fundus image with the superimposed sensitivity values was exported from the device.
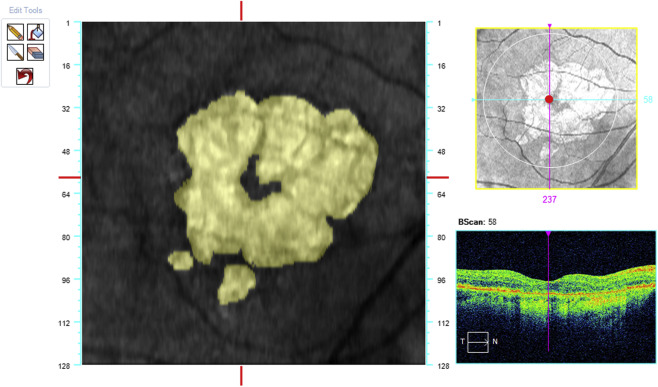
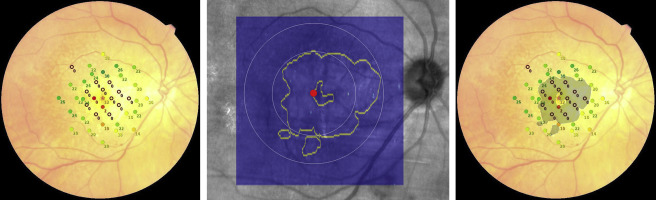
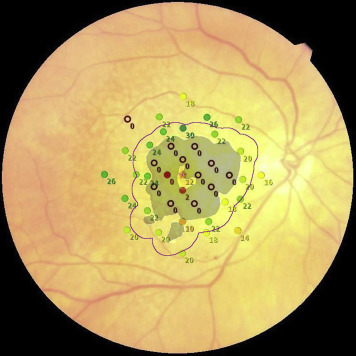
The acquired OCT images were evaluated in Cirrus review software (version 7.5.0.56). The clinician (S.R.S.) assessment of the AMD stage was also verified by using the Cirrus Advanced RPE Analysis Tool of Cirrus HD-OCT review software to assess for drusen as well as to delineate and quantify the area of GA ( Figure 2 ). Eyes with a reported GA area of zero but with any reported value for drusen area or volume by the Advanced RPE Analysis Tool were considered as mild or intermediate AMD. Eyes with the reported GA area larger than 0.1 mm 2 (>250 μm in longest linear dimension) were considered as GA cases. The OCT images were also used to exclude the presence of fluid or irregular elevations of the RPE, which might be indicators of choroidal neovascularization. The en face OCT images were registered with the color images containing the microperimetric sensitivity values using ImageJ software (available at http://imagej.nih.gov/ij ). Retinal vessel crossing points were used as invariant landmarks to facilitate this registration ( Figure 3 ). The junctional zone (a ring 500 μm in width surrounding the GA lesions) was marked on these registered images ( Figure 4 ). This region was further subdivided into “subzones,” as shown in Figure 5 .
The mean retinal sensitivity of every zone in GA cases was calculated for every eye separately and the averages of these means were compared across all ayes with GA by performing 1-way analysis of variance and post hoc Games-Howell test. In addition, the mean sensitivity of the points located at 10 degrees from fixation (the outermost part of the retina at which sensitivity was measured) in eyes with mild or intermediate AMD was calculated and compared with the mean sensitivity of the normal-appearing fundus in eyes with GA by performing a Student t test. Significance was set at P < .05 for the test. Statistical analyses of the data were performed using commercial software (Statistical Package for Social Science, version 19.0; SPSS Inc, Armonk, New York, USA).
Stay updated, free articles. Join our Telegram channel

Full access? Get Clinical Tree


