Purpose
To evaluate macular retinal ganglion cell thickness in patients with neovascular age-related macular degeneration (AMD) and intravitreal anti–vascular endothelial growth factor (VEGF) therapy.
Design
Retrospective case series with fellow-eye comparison.
Methods
Patients with continuous unilateral anti-VEGF treatment for subfoveal and juxtafoveal neovascular AMD and a minimum follow-up of 24 months were included. The retinal nerve fiber (RNFL) and retinal ganglion cell layer (RGCL) in the macula were segmented using an ETDRS grid. RNFL and RGCL thickness of the outer ring of the ETDRS grid were quantified at baseline and after repeated anti-VEGF injections, and compared to the patients’ untreated fellow eye. Furthermore, best-corrected visual acuity (BCVA), age, and retinal pigment epithelium (RPE) atrophy were recorded and correlated with RNFL and RGCL.
Results
Sixty eight eyes of 34 patients (23 female and 11 male; mean age 76.7 (SD ± 8.2) with a mean number of 31.5 (SD ± 9.8) anti-VEGF injections and a mean follow-up period of 45.3 months (SD ± 10.5) were included. Whereas the RGCL thickness decreased significantly compared to the noninjected fellow eye ( P = .01), the decrease of the RNFL was not significant. Visual acuity gain was significantly correlated with RGCL thickness (r = 0.52, P < .05) at follow-up and negatively correlated (r = −0.41, P < .05) with age. Presence of RPE atrophy correlated negatively with the RGCL thickness at follow-up (r = −0.37, P = .03).
Conclusion
During the course of long-term anti-VEGF therapy there is a significant decrease of the RGCL in patients with neovascular AMD compared to the fellow (untreated) eye.
Age-related macular degeneration (AMD) is one of the leading causes of visual impairment in individuals over the age of 55 years in developed countries. The neovascular form of AMD, with vascular endothelial growth factor (VEGF) as one of the key factors, causes severe and irreversible vision loss, frequently resulting in legal blindness. In recent years, VEGF inhibition by anti-VEGF antibodies has significantly improved visual outcomes in patients with neovascular AMD. However, in many patients with neovascular AMD anti-VEGF needs to be continuously administered over many years to persistently suppress disease activity and maintain visual function.
The need for long-term treatment with anti-VEGF agents has also become evident in the extension studies, where long-term outcomes 7-8 years after initiation of intensive ranibizumab therapy suggest that many patients require long-term treatment with anti-VEGF agents. However, despite the beneficial effect of anti-VEGF therapy, long-term side effects are not clarified yet and are a matter of ongoing controversy. There is evidence that repeated long-term anti-VEGF treatment may accelerate atrophy of different ocular tissues. Retinal pigment epithelium atrophy, as well as scleral thinning, has been reported. In the last years, several studies have investigated the effect of intravitreal anti-VEGF injections on the peripapillary retinal nerve fiber layer (RNFL). There exists some controversy regarding the effect of anti-VEGF agents on retinal ganglion cells (RGCs). In mice, some reports suggest severe damage to RGCs after local treatment with VEGF binding agents, while another report did not find any changes within the retinal ganglion cell layer (RGCL) after VEGF receptor blockade in mice. Because most studies have analyzed peripapillary optical coherence tomography (OCT) scans, these reports have focused on RNFL change after anti-VEGF treatment. However, several studies focusing on glaucoma patients have shown that RGCL thickness changes may be a more sensitive marker for global and regional visual field sensitivities.
In the present study, we investigated RNFL and RGCL changes in the macular area in eyes receiving long-term intravitreal anti-VEGF treatment for neovascular AMD using spectral-domain optical coherence tomography (Spectralis SDOCT; Heidelberg Engineering, Heidelberg, Germany) and automated segmentation of macular scans.
Methods
This study is an institutional retrospective case series with fellow-eye comparison and was conducted in accordance with the Declaration of Helsinki and approved by the local Ethics Committee (KEK-Nr. 093/13). Medical records of the Department of Ophthalmology at the University Hospital Bern, Bern, Switzerland, were screened for patients with exudative AMD under continuous anti-VEGF treatment. The need for written consent from each individual patient was waived because of the retrospective nature of the study. All data used in this study were collected as part of the normal treatment protocol. Study data were collected and managed using the REDCap electronic data management tool hosted at our institution. REDCap (Research Electronic Data Capture) is a secure, web-based application designed to support data capture for research studies. Patients were included in this retrospective study if they had unilateral exudative AMD and had received at least 15 injections of bevacizumab (Avastin; Genentech, South San Francisco, California, USA), ranibizumab (Lucentis; Genentech, South San Francisco, California, USA), and/or aflibercept (Eylea; Regeneron, Tarrytown, New York, USA) with a minimum of 24 months of follow-up with the Spectralis OCT using the rescan mode. Patients with bilateral exudative AMD and previous therapy such as photodynamic therapy and laser photocoagulation in the study or fellow eye were excluded. Patients with signs of diabetic retinopathy or glaucoma or a history of ocular hypertension were excluded because this may have confounded the results of retinal layer segmentation. Demographic data, best-corrected visual acuity (BCVA), number of intravitreal injections and administered anti-VEGF agents, duration of treatment, and intraocular pressure (IOP) were recorded.
Image Acquisition and Evaluation
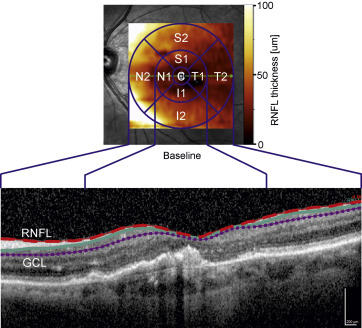
For OCT imaging a spectral-domain (SD)-OCT (Heidelberg Engineering, Dossenheim, Germany) was used. Images were acquired using image alignment eye-tracking software (TruTrack; Heidelberg Engineering) to obtain foveal volumetric retinal scans with 49 parallel B-scans consisting of 512 A-scans separated by 120 μm covering a volume of 20 × 20 degrees, whereby each B-scan was averaged 9 times (automated real-time repetition rate = 9). The baseline was chosen to be the time point, when SD-OCT was introduced in our clinic with the AutoRescan follow-up function available. For retinal layer segmentation the inbuilt Heidelberg Eye Explorer version 1.9.10.0 (Heidelberg Engineering) was used to measure the RNFL and RGCL thickness ( Figure 1 ). Segmentation data were reviewed by 2 experienced graders and adjusted manually if necessary. The graders were not masked to which eye received anti-VEGF therapy, because the neovascular component was clearly evident in the OCT scans. Respective parameters were evaluated at baseline and at last follow-up visit. Heidelberg Eye Explorer segments 11 different retinal boundaries: the inner limiting membrane (ILM); the boundaries between the RNFL and the RGCL, between the RGCL and the inner plexiform layer (IPL), between the IPL and the inner nuclear layer (INL), between the INL and the outer plexiform layer (OPL), and between the OPL and the outer nuclear layer (ONL); the external limiting membrane (ELM); 2 photoreceptor layers (PR1/2); the retinal pigment epithelium (RPE); and the basal membrane (BM) with the underlying choroid. Based on this segmentation algorithm the area between the ILM and the RNFL segmentation line (= mean RNFL thickness) and the area between the RNFL and RGCL segmentation line (= mean RGCL thickness) were automatically calculated by the inbuilt software. Mean RNFL and RGCL thickness of the outer ring (OR; r = 3 mm) was calculated using the implemented ETDRS grid. For further analyses SDOCTs were graded for the presence and/or development of RPE atrophy and the area of RPE atrophy measured in the infrared image.
Statistics
Statistical analyses were performed using GraphPad Prism and R (GraphPad Prism 6; GraphPad Software, LaJolla, California, USA; www.r-project.org ). In order to compare the segmentation data of the outer ring between study and fellow eyes a 1-way analysis of variance (ANOVA) with Holm-Sidak multiple comparisons test was employed. Differences between groups were analyzed using an unpaired 2-tailed Student t test (GraphPad Prism 6; GraphPad Software). Square root transformation was used to analyze RPE atrophy data. Furthermore, the association between BCVA, age, RPE atrophy, and RNFL and RGCL decrease was investigated by calculating pairwise correlations. Pearson or Spearman correlation was used according to the D’Agostino & Pearson omnibus normality test. P values < .05 were considered statistically significant. Values are given in mean ± standard deviation.
Results
This was a retrospective study of 34 patients (23 women) with a mean age of 76.7 ± 8.2 years with fellow eye comparison. Mean ETDRS BCVA of the study eyes at baseline was 61.5 ± 18.4 letters. Mean ETDRS BCVA at the last follow-up visit was 57.9 ± 20.2 letters. The mean change in BCVA over the course of the study period was −3.7 ± 4.8 letters, which was not statistically significant ( P = .45, t test). The mean number of anti-VEGF injections was 31.5 ± 9.8 (min.: 15; max.: 59 injections) and the mean treatment period between baseline and follow-up was 45.3 ± 10.5 months (min.: 25.6; max.: 73.3 months). IOP at baseline and at last follow-up visit as well as AREDS categories for the study and fellow eyes according to AREDS report number 6 are summarized in Table 1 . The study eye received on average a mean number of 13.4 ± 10.2 injections during a mean of 20.7 ± 4.1 months prior to the study baseline visit; thus a mean of 44.9 ± 12.3 injections during a mean of 67.1 ± 14.6 months were administered overall ( Table 2 ).
| Demographic Features | Study Eyes (n = 34) | Fellow Eyes (n = 34) | P a |
|---|---|---|---|
| Mean age ± SD, y | 76.7 ± 8.2 | 76.7 ± 8.2 | |
| Sex, F/M | 23/11 | 23/11 | |
| Follow-up time, mean ± SD (mo) | 45.3 ± 10.5 | 44.1 ± 11.3 | .1012 |
| Number of injections, mean ± SD | 31.5 ± 9.8 | 0 ± 0.0 | <.0001 ∗ |
| BCVA (ETDRS) at BL, mean ± SD | 61.5 ± 18.4 | 75.5 ± 20.9 | .0066 ∗ |
| BCVA (ETDRS) at FU, mean ± SD | 57.9 ± 20.2 | 67.9 ± 21.9 | .0517 |
| IOP (mm Hg) at BL, mean ± SD | 15.0 ± 3.1 | 15.0 ± 2.7 | .9424 |
| IOP (mm Hg) at FU, mean ± SD | 14.8 ±3.0 SD | 15.3 ± 2.9 SD | .1215 |
| AREDS category 4 | 34 | 2 | |
| AREDS category 3 | 0 | 15 | |
| AREDS category 2 | 0 | 15 | |
| AREDS category 1 | 0 | 2 |
a Significant difference ( P < .05) in Student t test between study eye and fellow eye. Asterisk indicates statistically significant differences.
| Study Eyes (n = 34) | Fellow Eyes (n = 34) | P a | |
|---|---|---|---|
| Number of injections | 31.6 ± 9.8 SD | 0 ± 0.0 | <.0001 b ,∗ |
| Number of injections at study entry | 13.4 ± 10.2 | 0 ± 0.0 | <.0001 b ,∗ |
| Total number of injections at FU | 44.9 ± 12.3 | 0 ± 0.0 | <.0001 b ,∗ |
| Duration from BL to FU (mo) | 45.3 ± 10.5 | 44.1 ± 11.3 | .1012 b |
| Total duration of therapy (mo) | 67.1 ± 14.6 | 66.0 ± 14.6 | .1012 b |
| Outer ring RNFL thickness at baseline (μm) | 36.4 ± 8.1 | 36.2 ± 6.5 | .9725 c |
| RNFL thickness at follow-up (μm) | 32.2 ± 6.4 | 36.8 ± 6.9 | .0438 c ,∗ |
| RGCL thickness at baseline (μm) | 29.6 ± 6.6 | 32.9 ± 5.4 | .0681 c |
| RGCL thickness at follow-up (μm) | 25.3 ± 6.5 | 31.0 ± 5.2 | .0006 c ,∗ |
a Asterisk indicates statistically significant differences.
b Student t test between study eye and fellow eye.
c Ordinary 1-way analysis of variance with Holm-Sidak multiple comparisons.
Retinal Ganglion Cell Layer and Retinal Nerve Fiber Layer Thickness at Baseline
At baseline, the RGCL thickness in the outer ring of the ETDRS grid was slightly thinner in the study eye (29.6 ± 6.6 μm) compared with the fellow eyes (32.9 ± 5.4 μm); however, this was not statistically significant ( Figure 2 , Bottom left). The RNFL thickness did not show significant differences between study and untreated fellow eyes at baseline (36.4 ± 8.1 μm vs 36.2 ± 6.5 μm) ( Figure 2 , Top left).
Retinal Ganglion Cell Layer and Retinal Nerve Fiber Layer Thickness at the End of the Study
At end of the study the RGCL was significantly thinner in the study eye (25 ± 6.5 μm) compared to untreated fellow eyes (31.0 ± 5.2 μm) (Δ −5.8 μm, P < .001, Holm-Sidak) ( Figure 2 , Bottom right). The RNFL thickness in the treated study eyes, at 32.2 ± 6.4 μm, was significantly thinner compared to the untreated fellow eyes, at 36.8 ± 6.9 μm (Δ −4.6 μm, P = .04, Holm-Sidak) ( Figure 2 , Top right).
Change of Retinal Ganglion Cell Layer and Retinal Nerve Fiber Layer During Therapy With Anti–Vascular Endothelial Growth Factor
In the fellow eyes (controls) there were no significant longitudinal changes in either the RNFL thickness or RGCL thickness, which decreased by −0.7 μm ( P = .97, Holm-Sidak) ( Figure 3 ) and −1.4 μm ( P = .34, Holm-Sidak), respectively ( Figure 4 ). In the study eyes, RGCL thickness showed a significant decrease between baseline and last follow-up in the outer ETDRS ring (RGCL: Δ −4.4 ± 0.9 μm [SE of diff.], P = .01) ( Figure 4 ), whereas the change in RNFL did not reach statistical significance (RNFL: Δ −4.2 ± 1.5 μm [standard error of difference], P = .07) ( Figure 3 ).


