Purpose
To characterize photoreceptor structure and mosaic integrity in subjects with RGS9- and R9AP -associated retinal dysfunction (bradyopsia) and compare to previous observations in other cone dysfunction disorders such as oligocone trichromacy.
Design
Observational case series.
Methods
setting : Moorfields Eye Hospital (United Kingdom) and Medical College Wisconsin (USA). study population : Six eyes of 3 subjects with disease-causing variants in RGS9 or R9AP . main outcome measures : Detailed retinal imaging using spectral-domain optical coherence tomography and confocal adaptive-optics scanning light ophthalmoscopy.
Results
Cone density at 100 μm from foveal center ranged from 123 132 cones/mm 2 to 140 013 cones/mm 2 . Cone density ranged from 30 573 to 34 876 cones/mm 2 by 600 μm from center and from 15 987 to 16,253 cones/mm 2 by 1400 μm from center, in keeping with data from normal subjects. Adaptive-optics imaging identified a small, focal hyporeflective lesion at the foveal center in both eyes of the subject with RGS9 -associated disease, corresponding to a discrete outer retinal defect also observed on spectral-domain optical coherence tomography; however, the photoreceptor mosaic remained intact at all other observed eccentricities.
Conclusions
Bradyopsia and oligocone trichromacy share common clinical symptoms and cannot be discerned on standard clinical findings alone. Adaptive-optics imaging previously demonstrated a sparse mosaic of normal wave-guiding cones remaining at the fovea, with no visible structure outside the central fovea in oligocone trichromacy. In contrast, the subjects presented in this study with molecularly confirmed bradyopsia had a relatively intact and structurally normal photoreceptor mosaic, allowing the distinction between these disorders based on the cellular phenotype and suggesting different pathomechanisms.
The phenomenon of bradyopsia (“slow vision”: OMIM 608415 ) was first described by Kooijman and associates in 4 patients from 3 unrelated Dutch families. Disease-causing sequence variants have been identified in either RGS9 (encoding a GTPase-activating protein) or R9AP (encoding its membrane anchor protein), with both playing a critical role in the recovery phase of visual transduction.
Bradyopsia ( RGS9 / R9AP- associated retinopathy) is characterized by reduced central vision from childhood, with mild photophobia, absence of nystagmus, normal color vision and night vision, and normal fundus appearance. However, patients report slow visual adaptation to changes in illumination, in both dark- and light-adapted states. These symptoms are shared with oligocone trichromacy, another cone dysfunction syndrome characterized by normal fundus appearance, normal or near-normal color vision, reduced visual acuity from infancy, and mild photophobia. Unlike RGS9 / R9AP -associated retinopathy, the underlying molecular genetic basis of oligocone trichromacy remains uncertain. Oligocone trichromacy and/or a “marked incomplete achromatopsia (ACHM)-like” phenotype have been reported in association with “hypomorphic” mutations in the CNGA3 , CNGB3 , PDE6C , and GNAT2 genes. However, some of these cases arguably have features more in keeping with incomplete achromatopsia per se, rather than oligocone trichromacy.
Electroretinograms according to the protocol recommendations by the International Society for Clinical Electrophysiology of Vision (ISCEV) also do not allow for the distinction to be made between RGS9 / R9AP- associated retinopathy and oligocone trichromacy, with more comprehensive electroretinograms than those mandated by the ISCEV in the electroretinogram standard document being needed. Extended electroretinogram testing includes dark-adapted red flash electroretinogram (which has both a cone and rod system component) and dark-adapted 10.0 (or 11.5) electroretinograms with a wider range of increasing interstimulus intervals are necessary to establish the correct diagnosis. However, both oligocone trichromacy and RGS9 / R9AP- associated retinopathy are associated with generalized cone system dysfunction, with an undetectable light-adapted 30 Hz flicker electroretinogram and a severely reduced light-adapted 3.0 electroretinogram.
Recently, photoreceptor topography was assessed in 3 subjects with typical oligocone trichromacy, confirmed to not harbor variants in either RGS9 or R9AP , using adaptive-optics flood-illuminated ophthalmoscopy (AO-Flood). These patients were all found to have a reduced number of waveguiding cones at the fovea, with no structure visible outside the central fovea—thereby confirming the original hypothesis of the underlying basis of oligocone trichromacy, that the disorder was caused by a reduction in number of otherwise functional cone photoreceptors.
In this study, we have undertaken deep phenotyping of molecularly proven patients with either RGS9- or R9AP- associated retinopathy. Spectral-domain optical coherence tomography was used to both qualitatively and quantitatively examine retinal laminar integrity and confocal adaptive-optics scanning light ophthalmoscopy was used to directly probe photoreceptor mosaic architecture in order to determine (1) whether oligocone trichromacy and RGS9 / R9AP- associated retinopathy could be discerned at the cellular level, and (2) whether the generalized retinal dysfunction in RGS9 / R9AP- associated retinopathy is secondary to cone cell loss/structural deficit or a functional deficit in otherwise intact receptors.
Subjects and Methods
Subjects
This observational case series was conducted in accordance with the tenets of the Declaration of Helsinki (1983 Revision) and the applicable regulatory requirements, and in compliance with the Health Insurance Portability and Accountability Act (HIPAA). After approval of the study and its procedures by the local ethics committees of Moorfields Eye Hospital and the Medical College of Wisconsin, informed consent was obtained from all participating subjects prior to enrollment.
All 3 subjects have been previously reported: subjects MM_0032, MM_0033, and JC_0759 correspond to cases 1A, 2A, and 3, respectively, in the series published by Michaelides and associates. The Table summarizes clinical findings and subject demographics. All subjects had the pathognomonic electroretinogram findings associated with bradyopsia as described previously : In brief, the dark-adapted 0.01 electroretinogram (rod electroretinogram), the dark-adapted red flash electroretinogram (which has both a cone and rod system component), and the dark-adapted 3.0 electroretinogram (combined rod-cone standard flash electroretinogram; rod dominated given numerosity) with interstimulus interval of 2 minutes were all normal. However, with an interstimulus interval of 20 seconds, amplitude reduction was observed in DA 11.5 electroretinograms, which was progressively less marked with increasing interstimulus interval, consistent with delayed recovery after the flash. Light-adapted testing revealed an undetectable pattern electroretinogram and 30 Hz flicker electroretinogram.
| Subject Number | Age (y) | Sex | Visual Acuity | Axial Length (mm) | Gene | Allele 1 / Allele 2 | AOSLO Used | ||
|---|---|---|---|---|---|---|---|---|---|
| OD | OS | OD | OS | ||||||
| JC_0759 | 62 | M | 6/12 | 6/12 | 23.16 | 22.92 | RGS9 | p.W299R / p.R128X | MCW |
| MM_0032 | 25 | F | 6/12 | 6/12 | 30.36 | 27.84 | R9AP | p.D32_Q34del / p.D32_Q34del | MEH |
| MM_0033 | 16 | F | 6/18 | 6/12 | 24.98 | 24.84 | R9AP | p.D32_Q34del / p.D32_Q34del | MEH |
Pupils of each patient were dilated using 1 drop each of phenylephrine (2.5%) and tropicamide (1%) before imaging in the study herein.
Spectral-Domain Optical Coherence Tomography
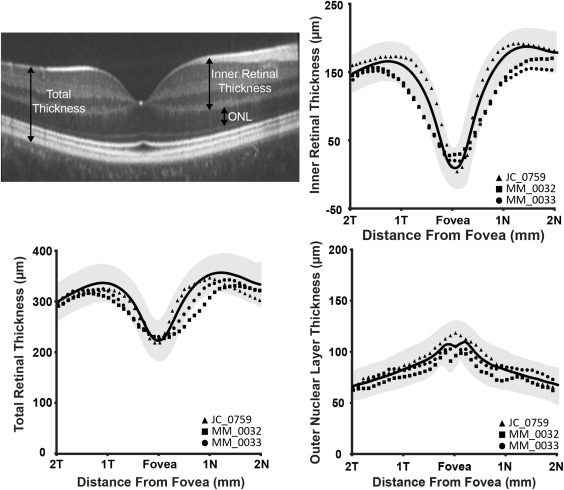
All subjects underwent spectral-domain optical coherence tomography using an Envisu C2300 system (Bioptigen, Morrisville, North Carolina, USA) through the macular region. Macular scans, either 750 A-scans/B-scan and 150 B-scans or 1000 A-scans/B-scan and 100 B-scans, over a nominally 7 × 7 mm area were acquired to locate the center of the fovea. Then, high-density line scans were acquired (1000 A-scans/B-scan), and ImageJ (NIH, Bethesda, Maryland, USA) was used to register up to 100 B-scans and average them to reduce speckle noise. To correct for retinal magnification, axial length was measured in all subjects (Zeiss IOL Master; Carl Zeiss Meditec, Dublin, California, USA) in order to estimate the lateral scale of each image and to correct the interindividual differences. In order to analyze the retinal cross-section and determine total retinal thickness, inner retinal thickness, and outer nuclear layer thickness, foveal scans were manually segmented using ImageJ (NIH) and a Matlab (MATLAB; MathWorks, Natick, Massachusetts, USA)-based algorithm.
The following definitions were applied: total retinal thickness was defined as the distance from the inner limiting membrane to the retinal pigment epithelium; inner retinal thickness as the distance from the inner limiting membrane to the outer plexiform layer; and outer nuclear layer thickness as the distance from the outer plexiform layer to the external limiting membrane. Layer designations are shown in Figure 1 (Top left). Thicknesses were compared to those derived from a normative database collected at Medical College Wisconsin, consisting of 167 normal individuals (72 male, 95 female, average age of 32.6 years [range 7-60 years]).
Confocal Adaptive-Optics Retinal Imaging
Images of the photoreceptor mosaic were obtained using 1 of 2 nearly identical adaptive-optics scanning light ophthalmoscopes located at Medical College Wisconsin and Moorfields Eye Hospital. The difference between the systems was the center wavelength of the imaging source. The imaging source at Moorfields Eye Hospital was a 790 nm superluminescent diode (Superlum Ireland, Carrigtwohill, County Cork, Ireland) while the imaging source at Medical College Wisconsin was a 775 nm superluminescent diode (Inphenix Inc, Livermore, California, USA). Both systems operated at ∼17 frames/second. Wavefront aberrations were corrected using a 97-actuator deformable mirror (ALPAO, Biviers, France). Image sequences were recorded at different locations across the central fovea and parafovea. Each image sequence was desinusoided and registered using algorithms described by Dubra and associates. The resultant image from each sequence was then manually combined into a large montage (Adobe Photoshop; Adobe Systems, Inc, San Jose, California, USA). Each subject’s axial length was used to determine the absolute scale of his or her retinal images, ensuring the accuracy of subsequent measurements of the cone mosaic.
From these images, cone density measurements were obtained using a Matlab-aided direct counting procedure. Cone photoreceptors were identified within an 80 × 80 μm region of interest at the location of peak cone density (0) when possible, and at 100, 200, 300, 400, 600, 800, 1000, 1200, and 1400 μm temporal eccentricity. Cone density was then calculated over the central 55 × 55 μm area to mitigate the effect of edge artifacts. Cone densities were compared to normal data published by Curcio and associates. Owing to the focal foveal lesion present in JC_0759, the center of the lesion was assumed to be the location of peak cone density, and all measurements were based from this location.
Results
Spectral-Domain Optical Coherence Tomography
Volumetric and foveal spectral-domain optical coherence tomography images were obtained in both eyes of all subjects. Foveal scans from all subjects are shown in Figure 2 . Qualitative assessment of the inner segment ellipsoid band showed that JC_0759 had focal foveal disruption of the inner segment ellipsoid band in both eyes, while there was normal macular lamination in both eyes of MM_0032 and MM_0033 ( Figure 2 ). Total, inner retinal, and outer nuclear layer thickness was within 2 standard deviations of normal for all subjects ( Figure 1 ).


