Purpose
To measure the repeatability and reproducibility of Pentacam HR system thickness maps for the entire cornea in normal, post–laser in situ keratomileusis (post-LASIK), and keratoconus (KC) eyes.
Design
Reliability study.
Methods
Sixty normal subjects (60 eyes), 30 post-LASIK subjects (60 eyes), and 14 KC patients (27 eyes) were imaged with the Pentacam HR system by 2 well-trained operators. For pachymetry the cornea was divided into 4 zones: a central zone (2-mm diameter) and concentric pericentral zone (2–5 mm), transitional zone (5–7 mm), and peripheral zone (7–10 mm). The 3 concentric zones were subdivided into 8 sectors. Intraobserver repeatability and interobserver reproducibility of entire corneal thickness maps were tested by the repeatability and reproducibility coefficients, intraclass correlation coefficients, coefficient of variation, and 95% limits of agreement.
Results
From central to peripheral zones, the precision of corneal thickness measurements became gradually smaller. Central zone repeatability and reproducibility were the best in the normal, post-LASIK, and KC groups. The peripheral superior sectors showed poorer repeatability and reproducibility for all subjects. The intraobserver repeatability and interobserver reproducibility for all zones were ≤19.3 μm, ≤22.1 μm, and ≤20.7 μm, in the normal, post-LASIK, and KC groups, respectively. The intraobserver and interobserver coefficients of variation for all zones were ≤1.3%, ≤1.6%, and ≤1.6% for all 3 groups.
Conclusions
Pentacam HR system pachymetry of the entire cornea provided good precision in normal, post-LASIK, and KC corneas. Thickness measurements in the peripheral cornea should be interpreted with caution in abnormal corneas after surgery or with diseases.
Corneal thickness measurements are important in daily ophthalmic practice. Both central and midperipheral corneal thicknesses play important roles in detecting and managing thinning of the cornea, as occurs in keratoconus (KC) and post–laser in situ keratomileusis (post-LASIK) keratectasia. Peripheral corneal thickness is also critical in the identification of peripheral pathologic conditions like pellucid marginal corneal degeneration or thinning that could compromise the outcome of refractive surgery.
Ultrasound pachymetry is currently the most commonly used method to measure corneal thickness. However, it requires direct contact with the cornea, and the reliability is highly dependent on operator experience in aligning the probe on the scanning spot over the cornea. In addition, ultrasound pachymetry provides corneal thickness measurement only at specific points, thus excluding the possibility of acquiring global pachymetry data. Therefore, the usefulness of ultrasound pachymetry is limited while monitoring peripheral corneal diseases. Currently, several noninvasive systems that allow measurement of corneal thickness by tomography have been developed. One of these systems is Pentacam tomography, which uses a rotating Scheimpflug camera to image the anterior segment of the eye. Several studies have reported the precision of corneal thickness measurements using the Pentacam system, and the repeatability and reproducibility of thickness measurements at the central and midperipheral cornea have been widely reported. However, many of the measurement spots were determined by placing the cursor manually. The thickness of the cornea determined by tomography from center to peripheral regions has rarely been investigated. Furthermore, no study has comprehensively compared the precision of entire cornea thickness measurements determined by the Pentacam under different pathologic conditions.
This reliability study was aimed to characterize the precision of thickness measurements of the entire cornea based on pachymetry mapping with the Pentacam HR system in normal, post-LASIK, and KC eyes. We further compared the measurements among these 3 groups to determine if the entire corneal thickness map obtained by Pentacam tomography was acceptable under the different corneal conditions.
Methods
Subjects
This study was approved by the Ethics Committee of Wenzhou Medical University and performed in adherence to the tenets of the Declaration of Helsinki. The purpose of the study was explained to each subject before he or she signed the written informed consent to participate. Data were analyzed for 1 eye of 60 normal subjects (34 men and 26 women, average age ± standard deviation 26.6 ± 2.1 years), both eyes of 30 post-LASIK subjects (18 men and 12 women, average age 26.0 ± 6.4 years), and 27 eyes of 14 KC patients (8 men and 6 women, average age 27.9 ± 11.4 years) who were consecutively recruited into the study at the Eye Hospital of Wenzhou Medical University. All subjects underwent a complete ocular examination including best-corrected visual acuity (BCVA), manifest refraction, slit-lamp microscopy, fundus examination, corneal topography, and Pentacam HR (Oculus, Wetzlar, Germany) imaging. All subjects were able to fixate well at the designated target. The average keratometry (Avg-K) and astigmatic keratometry (Ast-K) were recorded. The Avg-K was 43.5 ± 1.4 diopter (D), 39.5 ± 1.8 D, and 49.8 ± 7.7 D in the normal, post-LASIK, and KC groups, respectively. The Ast-K was 0.9 ± 0.6 D, 0.6 ± 0.5 D, and 4.1 ± 3.7 D in the same groups.
The inclusion criteria for healthy subjects were a normal corneal appearance on slit-lamp examination, BCVA at least 20/20, and no history of ocular trauma or surgery. For post-LASIK eyes, the inclusion criteria were a normal ocular examination except for having undergone LASIK for myopia. For the KC eyes, the topography characteristics included an inferior steep spot or a skewed asymmetric bowtie, and more than 1 of the following slit-lamp findings: Munson sign, Fleischer ring, Vogt striae, Rizutti sign, and apical thinning.
Exclusion criteria for the normal and KC groups were recent contact lens wear (soft contact lens within 2 weeks and rigid contact lens within 4 weeks) or a history of other corneal disease and previous ocular surgery. In the LASIK group, the exclusion criteria were intraoperative or postoperative complications such as decentration, a loss of 2 or more lines of best spectacle-corrected visual acuity with a follow-up period of less than 6 weeks, or a history of ocular disease and surgery.
Instruments
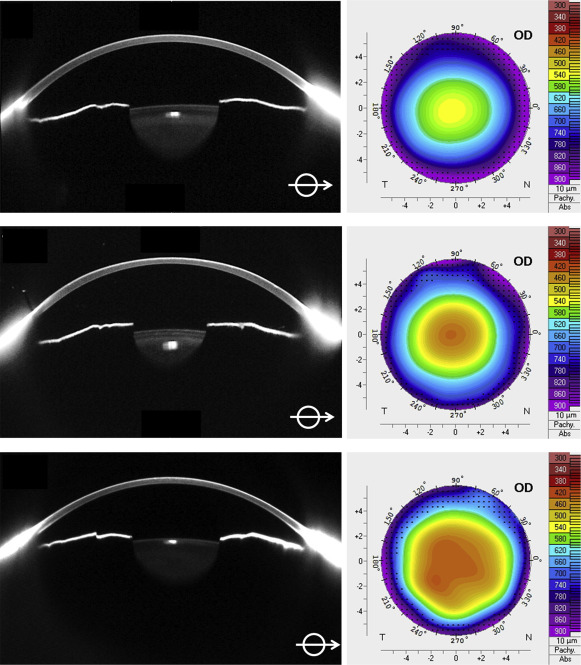
Pentacam tomography was performed with a single rotating Scheimpflug photography device. The wavelength of the blue light-emitting diode (LED) used to acquire images was 475 nm. One Scheimpflug camera rotated 360 degrees around a central light source that was also the patient fixation point. By rotation around the point of fixation, the artifacts of small movements during image acquisition were reduced. In addition, a second camera was used to detect the residual eye movements that were corrected by the Pentacam’s software. In less than 2 seconds, the rotating camera obtained 25 consecutive frames evenly spaced around the optical axis of the eye. The Pentacam HR is a high-resolution instrument that used a 1.45 megapixel camera to maximally capture 138 000 data points of true elevation. The Pentacam software (version 6.02r23) automatically formed a corneal pachymetry map centered on the apex of the cornea. The Scheimpflug images and corneal thickness maps produced by the Pentacam HR system for the normal, post-LASIK, and KC groups are shown in Figure 1 . The raw pachymetry data (U12 files) from the Pentacam HR system were transferred and tabulated in Excel (Microsoft, Redmond, California, USA) using custom-developed Matlab-based (MathWorks, Inc, Natick, Massachusetts, USA) software. To generate the 10-mm-diameter pachymetry maps, corneal thickness values beyond the raw data ranges were generated by extrapolation.
All corneal maps were divided into 4 concentric zones. The central zone had a 2 mm diameter centered on the corneal apex, and the pericentral zone occupied the area 2–5 mm around the central zone. The transitional zone occupied the area 5–7 mm around the central zone, and the peripheral zone occupied the area 7–10 mm around the central zone. The outer 3 zones (ie, the pericentral, transitional, and peripheral zones) were subdivided into 8 sectors: superior (S), superotemporal (ST), temporal (T), inferotemporal (IT), inferior (I), inferonasal (IN), nasal (N), and superonasal (SN).
Study Procedure
The Pentacam HR system was manipulated by 2 well-trained operators in a dim room in accordance with the manufacturer’s guidelines. Two scans were obtained by Operator 1 (Z.X.), and another scan was made immediately after by Operator 2 (M.P.). To limit eyelid and lash artifacts on the vertical meridian, subjects were asked to fixate straight ahead on the fixation target (blue circular ring) and keep their eyes open as wide as possible during scanning. If necessary, the eyelids were gently held apart by an observer. Before every scan, each subject was required to sit back and reposition his or her head. The retracted joystick was completely realigned to ensure that each scan was independent from the other ones. The automatic release mode was used to reduce operator-dependent variables. A scan would be captured only when the correct focus and alignment were achieved on the corneal apex. Before scanning, each subject was instructed to blink once completely to spread an optically smooth tear film on the cornea. Only when “Examination Quality Specification” showed “OK” were the corneal pachymetry results accepted. The operator saved the scan results and did not read the measured values. All measurements were taken between 10 AM and 4 PM to minimize the effects of diurnal variation in corneal thickness and shape.
Statistical Analysis
Statistical analysis was performed with SPSS software for Windows version 17 (SPSS Inc, Chicago, Illinois, USA). Corneal pachymetry measurement results were presented as means ± standard deviations (SD). Analysis of variance (ANOVA) was used to compare the averaged thickness values within and between groups. P values less than .05 were considered statistically significant. Repeatability coefficients (CoR 1 ), reproducibility coefficients (CoR 2 ), intraclass correlation coefficients of repeatability (ICC 1 ), intraclass correlation coefficients of reproducibility (ICC 2 ), coefficients of variation for repeatability (CoV 1 ), coefficients of variation for reproducibility (CoV 2 ), 95% limits of agreement for repeatability (LoA 1 ), and 95% limits of agreement for reproducibility (LoA 2 ) were calculated for the average corneal thicknesses in each of the 4 zones. The coefficient of repeatability was determined as twice the SD of the differences between pairs of repeated measurements in the same subject by the same observer. The coefficient of reproducibility was determined as twice the SD of the differences between pairs of repeated measurements in the same subject by the different observers. The CoV was defined as the within-subject SD divided by the within-subject mean and expressed as a percentage. The ICC was determined on the basis of the analysis of variance for mixed models corresponding to each condition. Values close to 1 suggested high repeatability and reproducibility of the method under study. The 95% LoAs were obtained as the means of the differences ± 2 SD between the 2 measurements.
Results
For each group, the means and SDs were calculated for corneal thickness measurements in the central, paracentral, transitional, and peripheral zones obtained by both operators ( Table 1 ). The corneal thickness measurements obtained by Pentacam pachymetry were repeatable and reproducible ( Table 1 ).
| Zone/Group | R1 | R2 | R3 | Δ (R1 − R2) | Δ (R1 − R3) |
|---|---|---|---|---|---|
| Central zone | |||||
| Normal | 540.8 ± 29.8 | 541.3 ± 30.0 | 542.2 ± 30.4 | −0.6 ± 4.5 | −1.4 ± 4.7 |
| Post-LASIK | 476.0 ± 36.9 a | 476.1 ± 37.9 a | 476.2 ± 36.6 a | 0.0 ± 6.6 | −0.2 ± 6.8 |
| Keratoconus | 478.0 ± 56.7 b | 480.0 ± 56.1 b | 477.7 ± 57.4 b | −2.1 ± 5.7 | 0.3 ± 6.3 |
| Pericentral zone | |||||
| Normal | 568.7 ± 30.2 | 569.4 ± 30.6 | 570.3 ± 31.1 | −0.6 ± 4.8 | −1.5 ± 5.4 |
| Post-LASIK | 524.1 ± 34.1 a | 524.3 ± 35.1 a | 523.8 ± 33.9 a | −0.2 ± 6.7 | 0.3 ± 7.8 |
| Keratoconus | 521.5 ± 43.4 b | 523.1 ± 42.7 b | 521.4 ± 42.9 b | −1.6 ± 6.0 | 0.4 ± 6.7 |
| Transitional zone | |||||
| Normal | 627.3 ± 30.7 | 628.0 ± 31.2 | 629.0 ± 31.8 | −0.7 ± 6.0 | −1.7 ± 7.0 |
| Post-LASIK | 613.5 ± 31.8 a | 613.8 ± 32.9 a | 613.9 ± 31.9 a | −0.4 ± 7.9 | −0.4 ± 9.5 |
| Keratoconus | 585.3 ± 43.0 b | 586.7 ± 41.8 b | 584.8 ± 40.3 b | −1.5 ± 7.6 | 0.4 ± 8.7 |
| Peripheral zone | |||||
| Normal | 721.7 ± 32.9 | 721.7 ± 33.6 | 722.1 ± 32.6 | 0.0 ± 8.8 | −0.4 ± 9.6 |
| Post-LASIK | 721.8 ± 37.1 | 723.3 ± 36.1 | 724.0 ± 39.1 | −1.5 ± 10.8 | −2.2 ± 11.0 |
| Keratoconus | 664.8 ± 43.6 b | 668.2 ± 42.0 b | 665.3 ± 42.0 b | −3.4 ± 9.8 | −1.2 ± 10.4 |
a Post-LASIK vs normal corneal thickness, P < .05.
The intraobserver repeatability and interobserver reproducibility of corneal thickness measurements obtained by the same operator and between operators were determined for the 4 zones of normal, post-LASIK, and KC eyes ( Table 2 ). Pachymetry measurement differences at each sector for the entire cornea were obtained for the same observer ( Figure 2 ) and between observers ( Figure 3 ). For each of the 3 study groups, the intraobserver repeatability coefficients and interobserver reproducibility coefficients increased from the central to the peripheral zones ( Table 2 , Figure 4 ). All of the ICCs were higher than 0.97 for all regions in the 3 groups.
| Zone/Group | Repeatability CoR 1 (μm) (R1, R2) | Reproducibility CoR 2 (μm) (R1, R3) | Repeatability CoV 1 (%) (R1, R2) | Reproducibility CoV 2 (%) (R1, R3) | Repeatability ICC 1 (R1, R2) | Reproducibility ICC 2 (R1, R3) | Repeatability 95% LoA 1 (μm) (R1, R2) | Reproducibility 95% LoA 2 (μm) (R1, R3) |
|---|---|---|---|---|---|---|---|---|
| Central zone | ||||||||
| Normal | 8.9 | 9.5 | 0.8 | 0.9 | 0.994 | 0.994 | −9.3 to 8.2 | −10.7 to 7.9 |
| Post-LASIK | 13.2 | 13.6 | 1.4 | 1.4 | 0.992 | 0.991 | −12.9 to 12.8 | −13.5 to 13.1 |
| Keratoconus | 11.4 | 12.6 | 1.2 | 1.3 | 0.997 | 0.997 | −13.2 to 9.1 | −12.1 to 12.6 |
| Pericentral zone | ||||||||
| Normal | 9.5 | 10.9 | 0.8 | 1.0 | 0.994 | 0.992 | −10.0 to 8.7 | −12.2 to 9.1 |
| Post-LASIK | 13.4 | 15.6 | 1.3 | 1.5 | 0.991 | 0.987 | −13.3 to 13.0 | −15.0 to 15.6 |
| Keratoconus | 12.1 | 13.4 | 1.2 | 1.3 | 0.995 | 0.994 | −13.4 to 10.2 | −12.7 to 13.5 |
| Transitional zone | ||||||||
| Normal | 12.1 | 14.0 | 1.0 | 1.1 | 0.990 | 0.987 | −12.6 to 11.1 | −15.5 to 12.1 |
| Post-LASIK | 15.7 | 19.1 | 1.3 | 1.6 | 0.985 | 0.977 | −15.8 to 15.0 | −19.1 to 18.2 |
| Keratoconus | 15.3 | 17.3 | 1.3 | 1.5 | 0.992 | 0.989 | −16.4 to 13.5 | −16.6 to 17.4 |
| Peripheral zone | ||||||||
| Normal | 17.5 | 19.3 | 1.2 | 1.3 | 0.982 | 0.978 | −17.1 to 17.2 | −19.3 to 18.4 |
| Post-LASIK | 21.6 | 22.1 | 1.5 | 1.5 | 0.978 | 0.979 | −22.7 to 19.6 | −23.8 to 19.4 |
| Keratoconus | 19.6 | 20.7 | 1.5 | 1.6 | 0.987 | 0.985 | −22.7 to 15.8 | −21.5 to 19.1 |
Stay updated, free articles. Join our Telegram channel

Full access? Get Clinical Tree


