Purpose
To evaluate whether quantity of choroidal tissue directly adjacent to the optic nerve differs between eyes with and without glaucoma and whether beta-zone parapapillary atrophy influences this relationship.
Design
Prospective cohort study.
Methods
Subjects were enrolled in a longitudinal, observational study at our institution. We studied 1 eye of 63 primary open-angle glaucoma (POAG), 30 ocular hypertension (OH), and 48 control subjects. Using optical coherence tomography enhanced depth imaging, we acquired 12 radial scans centered on the optic nerve head with 15 degrees of separation between scans. After images were enhanced, segmented, and corrected for ocular magnification, juxtapapillary choroidal volumetric parameters were calculated using raw thickness measurements and standard interpolation techniques. Juxtapapillary choroidal volume was then compared by diagnosis and by beta-zone parapapillary atrophy status.
Results
Total juxtapapillary choroidal volume was significantly reduced in POAG vs OH and control eyes (1.057 vs 1.228 vs 1.255 μL, P = .04) and it was reduced in eyes with vs without beta-zone parapapillary atrophy (1.076 μL, n = 80 vs 1.306 μL, n = 61, P < .001). Juxtapapillary choroidal volume did not differ between POAG, OH, and control eyes when beta-zone parapapillary atrophy was absent, but juxtapapillary choroidal volume was significantly reduced in POAG vs control eyes when beta-zone parapapillary atrophy was present (0.957 vs 1.196 μL, P = .02). Furthermore, POAG eyes with beta-zone parapapillary atrophy had substantially lower juxtapapillary choroidal volume compared to POAG eyes without beta-zone parapapillary atrophy (0.957 vs 1.356 μL, P < .001).
Conclusions
The volume of choroid adjacent to the optic nerve was significantly reduced in POAG eyes when beta-zone parapapillary atrophy was present, suggesting that beta-zone parapapillary atrophy may be a biomarker for juxtapapillary choroidal atrophy and associated vascular compromise in POAG.
A growing body of evidence suggests vascular perfusion abnormality is a frequent contributor to glaucoma pathophysiology. Specifically, several large epidemiologic studies have identified reduced ocular perfusion as a risk factor for glaucoma prevalence, incidence, and progression. Glaucoma is more common in patients with comorbid systemic vascular disorders and several authors have shown, using a variety of techniques, that eyes with glaucoma commonly exhibit reduced blood flow compared to eyes without glaucoma. Despite these reports, the specific underlying anatomic and physiologic factors that explicitly contribute to or result in vascular compromise and ultimately optic nerve damage remain unclear.
The primary blood supply for the prelaminar and, in some eyes, the laminar portions of the optic nerve is principally provided by vessels that arise in the region of the choroid that lies immediately adjacent to the optic nerve, leading to hypotheses that disturbance of choroidal blood flow could contribute to glaucomatous optic neuropathy. The development of spectral-domain optical coherence tomography (SD OCT) with enhanced depth imaging has facilitated greater resolution of deeper structures of the posterior segment, leading to many recent studies of choroidal thickness in various ocular disease processes. In studies using SD OCT to investigate choroidal thickness in glaucoma, results have been mixed, with some reports finding no difference in choroidal thickness between glaucomatous and normal eyes and others reporting reduced choroidal thickness in glaucomatous eyes. It is important to note, however, that none of these investigations systematically measured choroidal thickness in the region directly adjacent to the optic nerve. Rather, choroidal thickness was generally quantified either subfoveally or beneath the circular circumpapillary ring that is typically used for retinal nerve fiber layer (RNFL) measurement. Considering that the region of the choroid that provides blood supply to the optic nerve lies directly adjacent to the optic nerve, it is plausible that investigation of this region might provide more specific and direct evidence regarding the relationship between choroidal thickness and glaucoma.
This study was therefore designed to use SD OCT to image the region of the choroid that lies directly adjacent to the optic nerve, an area that might best be termed juxtapapillary. By measuring choroidal thickness in this region and then using linear interpolation techniques to develop total and sectoral volumetric parameters from these measures, we planned to compare juxtapapillary choroidal volume parameters in eyes with and without glaucoma. Additionally, because beta-zone parapapillary atrophy has been linked to both glaucoma and reduced choroidal volume, we planned to use SD OCT to identify and quantify beta-zone parapapillary atrophy so that we could investigate interrelationships between beta-zone parapapillary atrophy, juxtapapillary choroidal volume, and glaucoma.
Methods
This investigation was a prospective cohort study, using subjects enrolled in a longitudinal, observational glaucoma research study at the Albuquerque Veterans Affairs Medical Center. The study adhered to the tenets of the Declaration of Helsinki, conformed to HIPAA regulations, and was approved by the University of New Mexico Institutional Review Board, and all subjects completed informed consent prior to participation. Enrollment criteria were: age ≥40 years; open, normal angles in each eye on gonioscopic examination; no corneal pathology that could affect intraocular pressure (IOP) measurement; refractive error ≤5 diopters and astigmatism ≤3 diopters; no prior refractive, corneal, or incisional glaucoma surgery; no secondary glaucoma diagnoses; no significant retinal disorders; and no visual field loss due to nonglaucomatous pathology (including retinal, optic nerve, or visual pathway disorders). Subjects with uncomplicated cataract surgery at least 3 months prior to SD OCT choroidal imaging were eligible.
Study Protocol
All subjects had comprehensive examinations including Goldmann applanation tonometry, axial length (AL) and corneal curvature measurement (IOL Master; Carl Zeiss Meditec Inc, Dublin, California, USA), and central corneal thickness (CCT) measurement using ultrasound pachymetry. Slit-lamp biomicroscopy, gonioscopy, standard automated perimetry (SAP), dilated fundus examination with indirect ophthalmoscopy, and SD OCT imaging (Spectralis; Heidelberg Engineering, Heidelberg, Germany) were also performed. On the date that choroidal images were acquired for this investigation, we also measured systolic (SBP) and diastolic (DBP) blood pressure and gathered current data from the medical record for the following items: body mass index (BMI), cigarette smoking status, glycosylated hemoglobin (A1C), concurrent use of systemic hypertension medications, concurrent use of systemic lipid-lowering medications, and concurrent systemic health conditions that might impact optic nerve head perfusion (including diabetes mellitus, hypertension, hyperlipidemia, congestive heart failure, coronary artery disease, sleep apnea, chronic kidney disease, and asthma/chronic obstructive pulmonary disease). All SAP testing was performed with optimal near-point correction using the Humphrey Visual Field Analyzer II, 24-2 SITA-standard program (Carl Zeiss Meditec, Inc). Visual fields were required to meet reliability criteria (false positives and false negatives <15%; fixation losses <33% unless gaze tracking demonstrated steady fixation, in which case fixation was deemed acceptable).
For this investigation, we identified all subjects from our longitudinal study database who had undergone choroidal imaging and also met the diagnostic criteria for glaucoma (primary open-angle glaucoma; POAG), ocular hypertension (OH), or control. POAG eyes were characterized by clinical findings consistent with glaucomatous optic neuropathy (eg, thinning, excavation, rim erosion, or notch of the neuroretinal rim) in conjunction with glaucomatous visual field defects that were reproducible on at least 3 consecutive examinations. Minimum criteria for glaucomatous visual field defect included glaucoma hemifield test (GHT) result outside normal limits and/or the presence of at least 3 contiguous test points on the pattern deviation plot with P < 1% and at least 1 at P < .05%, not including points on the edge of the field. IOP was not used as a diagnostic criterion for POAG. OH subjects had IOP >21 mm Hg on at least 1 occasion but did not have definitive glaucomatous optic neuropathy or visual field loss. Control subjects had normal optic nerves and visual fields and all IOP measurements <22 mm Hg.
Spectral-Domain Optical Coherence Tomography Choroid Data
In 2012, we began to acquire SD OCT imaging of the optic nerve head and imaged all study subjects consecutively. With the enhanced depth imaging mode, we acquired 12 20-degree radial scans centered on the optic nerve head with each scan separated by 15 degrees, as shown in Figure 1 . This pattern was selected in part so that we could obtain choroidal thickness measurements directly adjacent to the optic nerve.
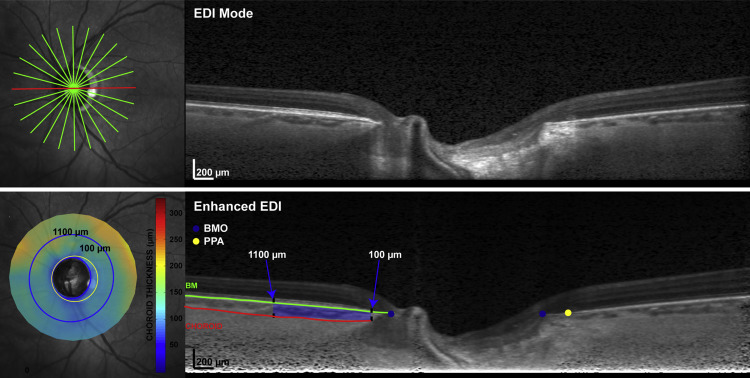
We excluded scans if the image series was significantly decentered, if the B-scan was cut off because the image was too low, if tissue resolution was poor, or if the choroid/sclera borders were not visible after image enhancement. Scan series were also excluded if choroidal segmentation could not be achieved in at least 75% of the scan length of any B-scan or if 2 adjacent scans within a regional sector could not be adequately segmented, as this would be expected to degrade the validity of sectoral choroidal volume measurements. We also excluded eyes that exhibited parapapillary atrophy, characterized on SD OCT by bare sclera without overlying Bruch membrane (termed gamma-zone), since this form of atrophy is associated with myopia but not glaucoma. One eye was randomly chosen for analysis if both eyes met eligibility criteria.
After acquisition, raw (*.vol) data were exported and analyzed using custom Matlab algorithms, where the scans were adjusted for lateral magnification based on axial length and corneal curvature. This adjustment was deemed important to avoid the confounding effects of magnification error on choroidal thickness measurements. Scans were then enhanced using a previously published algorithm in an effort to optimize the contrast between the choroid and sclera, as exhibited in Figure 1 . To obtain choroidal thickness measurements for each of the B-scans, the instrument-derived segmentation of the Bruch membrane was evaluated and manually corrected as necessary by a trained observer (N.P.), who also manually delineated the choroid-sclera border. After the Bruch membrane opening (BMO) was marked, choroidal thickness was quantified in the region of the B-scan from 100 μm to 1100 μm from the BMO. To reduce bias, images were randomly represented, and diagnostic data were unavailable during segmentation. Choroidal volumetric parameters were calculated using raw thickness measurements and standard interpolation techniques. Global and sectoral (superior, temporal, inferior, nasal) volumes were computed for use in statistical analyses.
With the aid of the corresponding infrared-scanning laser ophthalmoscope images, a trained observer also manually marked the beta-zone parapapillary atrophy boundary on each B-scan image where the retinal pigment epithelium (RPE) dissipated. The manually marked locations for the BMO and beta-zone parapapillary atrophy were then fit with a best-fit ellipse, and beta-zone parapapillary atrophy was quantified as the thickness and area differences between the BMO and beta-zone parapapillary atrophy boundary. All measures incorporated scaling using a 3-surface schematic eye, to minimize effects of ocular magnification. Eyes were classified as beta-zone parapapillary atrophy negative if RPE ended at the BMO in all B-scan images, and beta-zone parapapillary atrophy positive if RPE ended before the BMO in any of the B-scan images.
Statistical Analysis
Parametric and nonparametric tests were employed to compare parameters between diagnostic groups based on the normality of the parameter distributions. Specifically, Kruskal-Wallis tests were used to compare non-normally distributed variables between diagnostic groups, followed by Student-Newman-Keuls testing for post hoc comparison between groups as needed. Univariate and multivariate regression analyses were used to investigate relationships between choroidal volume variables and various clinical parameters. Statistical significance was defined as P < .05, and all statistical analyses were performed in conjunction with a professional biostatistician (C.Q.) using SAS (SAS Institute Inc, Cary North Carolina, USA; Version 9.2) and MedCalc (MedCalc, Ostend, Belgium; Version 12.4.0.0).
Results
One hundred seventy-two subjects were consecutively imaged, and 141 (82%) had at least 1 eye that met all image quality criteria. Of those included, 63 (45%), 30 (21%), and 48 eyes (34%) were diagnosed POAG, OH, and control, respectively. Of the 31 excluded subjects in which global or sectoral juxtapapillary choroidal volume could not be reliably measured, 14 were diagnosed POAG, 12 were diagnosed OH, and 5 were controls, representing 18%, 29%, and 10% of each diagnostic group. Only 1 eye (diagnosed POAG) was excluded because its parapapillary atrophy was characterized by gamma zone.
Subject characteristics, stratified by diagnostic category, are listed in Table 1 . Compared to the OH and control groups, the POAG group had higher age, lower systolic and diastolic blood pressure, thinner RNFL, and worse visual field sensitivity (lower mean defect and higher pattern standard deviation). Conversely, the OH group had higher IOP, systolic and diastolic blood pressure, and CCT compared to the control and POAG groups. The control group had significantly shorter AL than the other 2 groups, thicker CCT and lower IOP than the POAG group, and thicker RNFL than the OH group. Of note, IOP results were impacted by treatment as, respectively, 86%, 23%, and 0% of POAG, OH, and control subjects were using topical IOP-lowering agents. Beta-zone parapapillary atrophy was disproportionately present, being significantly more common and extensive in POAG compared to the other 2 groups ( Table 1 ).
| POAG (n = 63) | OH (n = 30) | Control (n = 48) | P Value | ||||
|---|---|---|---|---|---|---|---|
| Mean ± SD (95% CI) | Median (IQR) | Mean ± SD (95% CI) | Median (IQR) | Mean ± SD (95% CI) | Median (IQR) | ||
| Age (y) | 67.2 ± 8.2 (54.1, 82.9) | 66.0 (61.3, 73.8) | 61.9 ± 7.1 (52.0, 78.0) | 61.9 (57.0, 66.0) | 62.8 ± 9.2 (45.2, 86.0) | 62.0 (58.5, 64.5) | .001 a |
| BMI | 28.9 ± 5.4 (19.6, 39.6) | — | 29.8 ± 5.7 (19.9, 40.7) | — | 28.8 ± 4.7 (20.8, 39.5) | — | .69 |
| SBP (mm Hg) | 127.7 ± 13.5 (105.1, 150.0) | — | 135.3 ± 13.7 (106.6, 171.0) | — | 131.5 ± 12.9 (109.1, 157.1) | — | .04 b |
| DBP (mm Hg) | 76.1 ± 6.9 (65.1, 89.9) | — | 80.6 ± 5.3 (70.0, 90.0) | — | 78.8 ± 6.7 (66.1, 91.5) | — | .006 c |
| A1C (%) | 6.24 ± 0.87 (5.21, 8.10) | 5.90 (5.70, 6.50) | 6.15 ± 0.93 (4.93, 8.18) | 5.90 (5.60, 6.40) | 6.26 ± 0.97 (5.37, 9.22) | 6.00 (5.70, 6.35) | .90 |
| AL (mm) | 24.41 ± 0.96 (22.10, 26.55) | 24.31 (23.76, 24.92) | 24.31 ± 1.00 (22.65, 27.27) | 24.13 (23.80, 24.80) | 23.77 ± 1.12 (21.31, 26.32) | 23.78 (23.22, 24.27) | .004 d |
| CCT (μm) | 543.7 ± 38.0 (480.2, 638.2) | — | 563.6 ± 35.9 (487.8, 625.3) | 552.8 ± 32.1 (489.2, 619.0) | .04 e | ||
| GAT-IOP (mm Hg) | 15.5 ± 4.2 (7.0, 24.5) | 18.8 ± 4.4 (11.0, 30.8) | 14.5 ± 2.8 (8.0, 19.5) | <.001 f | |||
| MD (db) | −4.53 ± 4.07 (−15.50, 0.25) | −3.49 (−6.84, −1.73) | 0.22 ± 1.13 (−2.38, 2.51) | 0.37 (−0.61, 0.95) | 0.09 ± 0.96 (−2.36, 1.71) | 0.12 (−0.54, 0.71) | <.001 c |
| PSD (db) | 5.36 ± 3.61 (1.80, 13.99) | 3.77 (2.77, 7.50) | 1.62 ± 0.41 (1.03, 2.70) | 1.50 (1.35, 1.84) | 1.71 ± 0.46 (1.20, 3.03) | 1.58 (1.44, 1.77) | <.001 a |
| RNFL (μm) | 66.0 ± 14.1 (39.1, 88.8) | 68.0 (57.0, 74.8) | 88.9 ± 11.7 (66.0, 112.0) | 90.5 (80.0, 95.0) | 97.7 ± 10.7 (75.7, 117.2) | 99.5 (91.5, 104.5) | <.001 g |
| β-PPA presence (n, %) | 48/63 (76.2%) | 14/30 (46.7%) | 18/48 (37.5%) | <.001 a | |||
| β-PPA area (mm) | 1.09 ± 0.59 (0.40, 2.72) | 0.96 (0.64, 1.35) | 0.75 ± 0.47 (0.13, 2.23) | 0.61 (0.41, 0.96) | 0.63 ± 0.43 (0.74, 1.91) | 0.53 (0.41, 0.73) | <.001 a |
a Glaucoma > control and ocular hypertension.
b Glaucoma < ocular hypertension.
c Glaucoma < ocular hypertension and control.
d Control < glaucoma and ocular hypertension.
e Ocular hypertension > glaucoma.
f Ocular hypertension > glaucoma and control.
Descriptive data for total and sectoral juxtapapillary choroidal volume parameters, stratified by diagnosis, are shown in Table 2 . The POAG group demonstrated significantly smaller total, inferior, and superior juxtapapillary choroidal volume compared to the OH and control groups. Juxtapapillary choroidal volume demonstrated wide variability (3- to 4-fold difference between high and low ends of the range) and significant overlap between diagnostic groups. Total juxtapapillary choroidal volume was weakly correlated with RNFL ( P = .02, r 2 = 0.05) and mean defect ( P = .09, r 2 = 0.03).
| Glaucoma (n = 63) | Ocular Hypertension (n = 30) | Control (n = 48) | P Value | |
|---|---|---|---|---|
| Median (IQR) | Median (IQR) | Median (IQR) | ||
| Total JCV | 1.057 (0.878, 1.263) | 1.228 (0.890, 1.524) | 1.255 (1.040, 1.381) | .04 a |
| Inferior JCV | 0.220 (0.188, 0.288) | 0.300 (0.216, 0.364) | 0.287 (0.230, 0.362) | .001 b |
| Nasal JCV | 0.285 (0.242, 0.353) | 0.342 (0.245, 0.383) | 0.337 (0.258, 0.392) | .12 |
| Superior JCV | 0.287 (0.233, 0.352) | 0.335 (0.249, 0.386) | 0.332 (0.286, 0.393) | .04 a |
| Temporal JCV | 0.265 (0.208, 0.335) | 0.314 (0.238, 0.361) | 0.297 (0.242, 0.355) | .19 |
Eyes with beta-zone parapapillary atrophy (n = 80) had significantly smaller ( P < .0001) total and sectoral juxtapapillary choroidal volume measures compared to eyes without beta-zone parapapillary atrophy (n = 61). This relationship was primarily driven by POAG eyes, as shown in Table 3 . When eyes with beta-zone parapapillary atrophy were compared by diagnostic group, total, superior, and inferior juxtapapillary choroidal volume were reduced in POAG compared to control eyes and inferior juxtapapillary choroidal volume was also significantly lower in POAG vs OH eyes, as shown in Table 4 . Conversely, in eyes without beta-zone parapapillary atrophy, no differences in juxtapapillary choroidal volume were present between diagnostic groups, as shown in Figure 2 .
| POAG | OH | Control | |||||||
|---|---|---|---|---|---|---|---|---|---|
| β-PPA Present (n = 48) | β-PPA Absent (n = 15) | P Value | β-PPA Present (n = 14) | β-PPA Absent (n = 16) | P Value | β-PPA Present (n = 18) | β-PPA Absent (n = 30) | P Value | |
| Total JCV | 0.957 (0.835, 1.131) | 1.365 (1.259, 1.557) | <.001 | 1.086 (0.890, 1.327) | 1.378 (0.955, 1.550) | .27 | 1.196 (1.043, 1.299) | 1.277 (1.038, 1.478) | .48 |
| Inferior JCV | 0.215 (0.179, 0.249) | 0.300 (0.269, 0.366) | <.001 | 0.285 (0.216, 0.329) | 0.313 (0.219, 0.385) | .35 | 0.264 (0.226, 0.337) | 0.320 (0.253, 0.364) | .38 |
| Nasal JCV | 0.249 (0.230, 0.306) | 0.366 (0.337, 0.418) | <.001 | 0.281 (0.231, 0.362) | 0.373 (0.264, 0.430) | .14 | 0.332 (0.225, 0.368) | 0.337 (0.260, 0.400) | .58 |
| Superior JCV | 0.260 (0.217, 0.315) | 0.372 (0.354, 0.421) | <.001 | 0.284 (0.238, 0.365) | 0.353 (0.278, 0.420) | .33 | 0.324 (0.268, 0.355) | 0.358 (0.287, 0.412) | .30 |
| Temporal JCV | 0.242 (0.204, 0.291) | 0.389 (0.327, 0.406) | <.001 | 0.245 (0.219, 0.356) | 0.325 (0.263, 0.370) | .54 | 0.273 (0.243, 0.318) | 0.308 (0.238, 0.369) | .35 |
| β-PPA Present | β-PPA Absent | |||||||
|---|---|---|---|---|---|---|---|---|
| POAG (n = 48) | OH (n = 15) | Control (n = 18) | P Value | POAG (n = 15) | OH (n = 16) | Control (n =30) | P Value | |
| Total JCV | 0.957 (0.835, 1.131) | 1.086 (0.890, 1.327) | 1.196 (1.043, 1.299) | .03 a | 1.365 (1.259, 1.557) | 1.378 (0.955, 1.550) | 1.277 (1.038, 1.478) | .37 |
| Inferior JCV | 0.215 (0.179, 0.249) | 0.285 (0.216, 0.329) | 0.264 (0.226, 0.337) | .004 b | 0.300 (0.269, 0.366) | 0.313 (0.219, 0.385) | 0.320 (0.253, 0.364) | .97 |
| Nasal JCV | 0.249 (0.230, 0.306) | 0.281 (0.231, 0.362) | 0.332 (0.225, 0.368) | .11 | 0.366 (0.337, 0.418) | 0.373 (0.264, 0.430) | 0.337 (0.260, 0.400) | .43 |
| Superior JCV | 0.260 (0.217, 0.315) | 0.284 (0.238, 0.365) | 0.324 (0.268, 0.355) | .02 a | 0.372 (0.354, 0.421) | 0.353 (0.278, 0.420) | 0.358 (0.287, 0.412) | .46 |
| Temporal JCV | 0.242 (0.204, 0.291) | 0.245 (0.219, 0.356) | 0.273 (0.243, 0.318) | .13 | 0.389 (0.327, 0.406) | 0.325 (0.263, 0.370) | 0.308 (0.238, 0.369) | .14 |
Stay updated, free articles. Join our Telegram channel

Full access? Get Clinical Tree


