Purpose
To investigate the association of intraocular concentrations of inflammatory factors and improvement of macular edema after vitrectomy for patients with macular edema in branch retinal vein occlusion (BRVO).
Design
Retrospective case-control study.
Methods
Seventeen patients with BRVO who underwent vitreous surgery for macular edema and 15 control patients were enrolled from Hachioji Medical Center of Tokyo Medical University. The concentrations of eight inflammatory factors were measured in vitreous and aqueous fluids obtained at the time of vitrectomy using a flow cytometer. Macular thickness was measured by optical coherence tomography before and one, three, and six months after surgery. Correlations between the concentrations of inflammatory factors and macular thickness were statistically analyzed.
Results
Higher aqueous and vitreous concentrations of vascular endothelial growth factor (VEGF) and interleukin (IL)-8 were significantly correlated with a greater difference in macular thickness between before and six months after surgery (vitreous VEGF, P = .047; aqueous VEGF, P = .032; vitreous IL-8, P = .016; and aqueous IL-8, P = .032). Higher intraocular concentrations of monokine induced by interferon γ (Mig) were significantly correlated with a smaller degree of macular thickness six months after surgery (vitreous Mig, P = .038; aqueous Mig, P = .009).
Conclusion
High preoperative VEGF, IL-8, and Mig concentrations were associated with improvement of macular edema six months after vitreous surgery in patients with macular edema attributable to BRVO.
Branch retinal vein occlusion (BRVO) is a common retinal vascular occlusive disease, characterized by vascular obstruction leading to intraretinal hemorrhage, exudation of fluid, and variable degrees of ischemia. Macular edema, the most frequent cause of visual impairment in BRVO, complicates approximately 60% of temporal branch retinal vein occlusions and becomes chronic in two-thirds of these cases. Although a variety of treatments are applied for BRVO with macular edema, the effects of these treatments are not always satisfactory and are associated with some disadvantages.
Intravitreous injection of triamcinolone acetonide (TA) provides short-term improvement of visual acuity (VA) and macular edema, but the effects do not persist for more than several months. Increased intraocular pressure and posterior subcapsular cataracts are major side effects of TA therapy, whose frequencies are both approximately 40%. Grid laser photocoagulation is best studied in the Branch Vein Occlusion Study. According to this study, the effect of grid laser photocoagulation is greater in patients with macular edema in BRVO than in patients with nontreated controls. Reports by another group, however, indicate that the effect of grid laser photocoagulation in patients with BRVO differed little from that in control groups. Intravitreal injection of anti–vascular endothelial growth factor (VEGF) antibody is currently used in the treatment for macular edema in BRVO. No ocular toxicity or adverse side effects have been observed, and VEGF injection reduces macular thickness and improves visual acuity to a greater degree than grid laser photocoagulation. However, the high recurrence rate and short-term effectiveness are limitations of this treatment.
Multiple chemokines, cytokines, and growth factors have been detected in the ocular fluids of patients with BRVO, such as VEGF, interleukin (IL)-1α, IL-6, IL-8, interferon-inducible protein-10 (IP-10), monocyte chemotactic protein (MCP)-1, erythropoietin, platelet-derived growth factor-AA, and pigment epithelium–derived factor. In particular, aqueous humor and vitreous fluids obtained from patients with BRVO contain higher concentrations of IL-6, IL-8, MCP-1, and VEGF than those obtained from control patients. In addition, Noma and associates reported that high vitreous and aqueous concentrations of VEGF and IL-6 are correlated with the preoperative severity of macular edema, and they suggested that the two factors may be used as an index to evaluate the ischemic condition of macular edema in BRVO. The levels of these factors alter the microcirculation, affecting macular edema and neovascularization in patients with BRVO. Vitrectomy is considered to be an effective treatment for macular edema in BRVO, and one of the mechanisms of the effects of vitrectomy for macular edema is considered to be the removal of a variety of chemical mediators contained in the vitreous gel. In a previous report, central macular thickness decreased in 34.3% of patients with BRVO after vitrectomy, and best-corrected visual acuity (BCVA) improved in approximately 70% of the patients. But vitrectomy is not always effective because BCVA fails to improve after vitrectomy in approximately 30% of patients with BRVO with macular edema.
Although a single chemical factor is not sufficient to explain the pathogenesis of BRVO, the investigation of multiple inflammatory factors would be very helpful to understand the mechanism of improvement of macular edema after vitrectomy. In the present study, we evaluated multiple intraocular immune mediators in the vitreous gel and aqueous humor obtained at the time of vitreous surgery for macular edema in patients with BRVO using a cytometric bead array system, and statistically compared the results with the degree of improvement in macular edema.
Patients and Methods
Patients
Seventeen patients with BRVO (age 68.2 ± 7.8 years; 9 men, 8 women) and 15 control patients (age 65.3 ± 8.7 years; 7 men, 8 women) who underwent pars plana vitrectomy at Hachiouji Medical Center of Tokyo Medical University were enrolled in this study. Cataract surgery was also performed in all of the patients at the time of the vitrectomy. Inclusion criteria included BRVO patients with 1) clinically detectable macular edema persisting for more than three months, 2) BCVA worse than 0.7 on a decimal chart, and 3) prolonged macular edema even after photocoagulation. Control patients comprised 10 patients with a macular hole and five patients with an epiretinal membrane. None of the control patients had ocular inflammatory disease, macular edema, or vascular insufficiency with ischemia. Exclusion criteria included a history of vitreous hemorrhage or intraocular surgery. There were no significant differences in age or in the male-to-female ratio between BRVO and control patients. Mean interval between disease onset and vitrectomy was 8.3 ± 5.0 months for the patients with BRVO. Five patients with BRVO had undergone retinal photocoagulation before the surgery.
Surgical Methods and Sample Collection
Vitreous fluid and aqueous humor samples were obtained at the time of surgery. Pars plana vitrectomy was performed using TA during surgery to visualize the vitreous. The inner limiting membrane was removed in all BRVO patients. The vitreous and aqueous samples were immediately frozen and stored at −80°C. The samples were assayed within six months of collection.
Flow Cytometric Analysis
Vitreous and aqueous concentrations of human VEGF, IL-8, monokine induced by interferon γ (Mig), MCP-1, IP-10, basic fibroblast growth factor (basic-FGF), granulocyte-macrophage colony stimulating factor (GM-CSF), and regulated upon activation, normal T-cell expressed and secreted (RANTES) were quantified using the BD Cytometric Bead Array Flex Set System and BD Human Soluble Protein Master Buffer Kit (BD Bioscience-PharMingen, San Diego, California, USA) according to the methods recommended by the manufacturer. Briefly, samples were incubated with a mixture of capture beads specific to inflammatory factors and then with phycoerythrin-conjugated detection antibodies. Two-color flow cytometric analysis was performed using a FACSCalibur flow cytometer (BD Immunocytometry Systems, San Jose, California, USA). Data were analyzed by FCAP Array (BD Immunocytometry Systems) analysis software.
Measurement of Macular Thickness
Macular thickness was measured by optical coherence tomography (OCT3000; Carl Zeiss, Dublin, California, USA) using the fast macular scan protocol. Measurement was performed within one week before surgery, and one, three, and six months after surgery.
Statistical Analysis
The intraocular concentrations of inflammatory factors, macular thickness, and BCVA are expressed as median (range), and the data were analyzed using Mann-Whitney U test or Wilcoxon signed rank test. BCVA was measured using a decimal chart and was converted to the logarithm of the minimal angle of resolution. Correlations of inflammatory factors and macular thickness were analyzed by Spearman rank correlation test. A P value of less than .05 was considered significant. All analyses were performed using JMP statistical analysis software, version 7 (SAS Institute, Cary, North Carolina, USA).
Results
Concentration of Inflammatory Factors in Ocular Fluids From Patients With Branch Retinal Vein Occlusion With Macular Edema
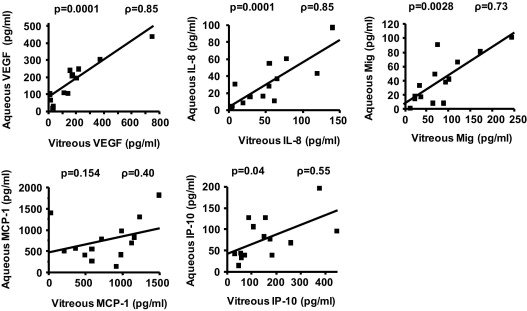
In patients with BRVO, vitreous and aqueous concentrations of VEGF (vitreous, 131.7 [0–741.5] pg/mL; aqueous, 108.7 [0–445.5] pg/mL), IL-8 (vitreous, 52.4 [1.4–140.2] pg/mL; aqueous, 24.7 [2.6–96.6] pg/mL), Mig (vitreous, 72.2 [13.3–243.2] pg/mL; aqueous, 55.1 [20.6–635.4] pg/mL), MCP-1(vitreous, 832.2 [24.7–1486.2] pg/mL; aqueous, 562.5 [28.8–1812.3] pg/mL), and IP-10 (vitreous, 143.6 [30.0–444.1] pg/mL; aqueous, 76.9 [14.2–520.9] pg/mL) were above the detection limit, and the concentrations of all of these factors were significantly higher in the aqueous and vitreous fluids of patients with BRVO than those of the control patients ( Table 1 ). Concentrations of basic FGF, GM-CSF, and RANTES were below the detection limit in almost all vitreous and aqueous samples. The vitreous and aqueous concentrations of VEGF, IL-8, Mig, and IP-10 in patients with BRVO were statistically correlated (VEGF, ρ = 0.85, P = .0001; IL-8, ρ = 0.85, P = .0001; Mig, ρ = 0.73, P = .0028; IP-10, ρ = 0.55, P = .04) ( Figure ).
| Control (n = 15) | BRVO (n = 17) | P Value a | |
|---|---|---|---|
| Median (Range) (pg/mL) | Median (Range) (pg/mL) | ||
| Vitreous VEGF | 0 (0–70.7) | 131.7 (0–741.5) | .001 |
| Aqueous VEGF | 80.46 (0–144.3) | 108.7 (0–445.5) | .06 |
| Vitreous IL-8 | 3.04 (1.4–7.9) | 52.4 (1.4–140.2) | <.001 |
| Aqueous IL-8 | 4.7 (1.9–7.4) | 24.7 (2.6–96.6) | .001 |
| Vitreous Mig | 15.7 (1.3–74.3) | 72.2 (13.3–243.2) | <.001 |
| Aqueous Mig | 16.6 (3.2–108.6) | 55.1 (20.6–635.4) | <.001 |
| Vitreous MCP-1 | 334.9 (67.3–966.2) | 832.2 (24.7–1486.2) | .009 |
| Aqueous MCP-1 | 389.2 (169.5–743.0) | 562.5 (28.8–1812.3) | .04 |
| Vitreous IP-10 | 27.8 (3.6–152.6) | 143.6 (30.0–444.1) | <.001 |
| Aqueous IP-10 | 28.1 (0–80.0) | 76.9 (14.2–520.9) | .003 |
Correlation of Macular Thickness With Inflammatory Factors
Macular thickness measured one, three, and six months after surgery (271 [131–715] μm, 335 [164–650] μm, and 266.5 [144–581] μm, respectively) was significantly decreased compared with macular thickness before surgery (450 [238–867] μm) in patients with BRVO ( P = .016, P = .012, and P = .021, respectively). BCVA was not statistically improved at one month (0.52 [0.15–1.7]) after surgery; however, it was significantly improved at three months (0.40 [0.15–1.4]), six months (0.40 [0.05–1.53]), and one year (0.46 [0.05–1.3]) after surgery, compared with before surgery (0.52 [0.22–1.3]) ( P = .006, P = .02, and P = .004, respectively) ( Table 2 ). Macular thickness before surgery and one, three, and six months after surgery was statistically compared with vitreous and aqueous concentrations of VEGF, IL-8, Mig, MCP-1, and IP-10. High vitreous and aqueous Mig concentrations were significantly inversely correlated with macular thickness measured six months after surgery (vitreous Mig, ρ = −0.66, P = .038; aqueous Mig, ρ = −0.75, P = .009) ( Table 3 ).
| Before Vitreous Surgery | After Vitreous Surgery | ||||
|---|---|---|---|---|---|
| 1 Month | 3 Months | 6 Months | 1 Year | ||
| (n = 17) | (n = 16) | (n = 15) | (n = 12) | (n = 14) | |
| Macular thickness (μm)/median (range) | 450 (238–867) | 271 (131–715) | 335 (164–650) | 266.5 (144–581) | n.a. |
| P value a | .016 | .012 | .021 | ||
| (n = 17) | (n = 17) | (n = 15) | (n = 15) | ||
| logMAR VA/median (range) | 0.52 (0.22–1.30) | 0.52 (0.15–1.70) | 0.40 (0.15–1.40) | 0.40 (0.05–1.53) | 0.46 (0.05–1.30) |
| P value a | .11 | .006 | .02 | 0.004 | |
| Correlation With Macular Thickness Before Vitreous Surgery (n = 15) a | Correlation With Macular Thickness After Vitreous Surgery a | |||
|---|---|---|---|---|
| 1 Month (n = 14) | 3 Months (n = 13) | 6 Months (n = 11) | ||
| ρ/ P | ρ/ P | ρ/ P | ρ/ P | |
| Vitreous VEGF | 0.16/.58 | −0.18/.54 | −0.27/.37 | −0.37/.29 |
| Aqueous VEGF | 0.08/.77 | 0.56/.037 | −0.16/.86 | −0.28/.40 |
| Vitreous IL-8 | 0.33/.23 | −0.16/.60 | −0.16/.60 | −0.31/.38 |
| Aqueous IL-8 | 0.64/.010 | 0.26/.37 | 0.22/.44 | 0.009/.98 |
| Vitreous Mig | 0.30/.29 | −0.17/.55 | −0.40/.18 | −0.66/.038 b |
| Aqueous Mig | 0.12/.67 | 0.40/.15 | −0.60/.017 a | −0.75/.009 b |
| Vitreous MCP-1 | 0.20/.47 | 0.14/.62 | 0.071/.82 | 0.006/.99 |
| Aqueous MCP-1 | 0.46/.081 | −0.09/.76 | 0.46/.087 | 0.45/.16 |
| Vitreous IP-10 | 0.10/.71 | −0.09/.77 | −0.006/.96 | −0.18/.63 |
| Aqueous IP-10 | 0.30/.29 | 0.07/.81 | −0.040/.89 | −0.12/.73 |
a Data were analyzed by Spearman rank correlation test.
Mean difference and range of macular thickness between before and after surgery are 133.8 (-321 to 468) μm at one month, 143.3 (-268 to 532) μm at three months, and 176.9 (-343 to 500) μm at six months after surgery. The relation between intraocular concentrations of VEGF, IL-8, Mig, MCP-1, and IP-10 and the change in macular thickness at one, three, or six months after surgery were evaluated ( Table 4 ). At six months after surgery, the difference in macular thickness was significantly correlated with the vitreous and aqueous concentrations of VEGF (vitreous, ρ = 0.63, P = .047; aqueous, ρ = 0.65, P = .032), and IL-8 (vitreous, ρ = 0.73, P = .016; aqueous, ρ = 0.65, P = .032), although these correlations were not significant at one and three months after surgery, with the exception of aqueous VEGF at one month.
| Before/1 Month After (n = 14) a | Before/3 Months After (n = 13) a | Before/6 Months After (n = 11) a | |
|---|---|---|---|
| ρ/ P | ρ/ P | ρ/ P | |
| Vitreous VEGF | 0.46/.10 | 0.45/.12 | 0.63/.047 b |
| Aqueous VEGF | 0.56/.04 b | 0.27/.4 | 0.65/.032 b |
| Vitreous IL-8 | 0.48/.08 | 0.42/.15 | 0.73/.016 b |
| Aqueous IL-8 | 0.26/.37 | 0.21/.47 | 0.65/.032 b |
| Vitreous Mig | 0.17/.56 | 0.45/.1 | 0.56/.09 |
| Aqueous Mig | 0.40/.15 | 0.37/.18 | 0.45/.16 |
| Vitreous MCP-1 | 0.12/.70 | 0/>.999 | 0.39/.26 |
| Aqueous MCP-1 | −0.09/.76 | −0.10/.73 | 0.19/.53 |
| Vitreous IP-10 | 0.26/.37 | 0.12/.71 | 0.53/.12 |
| Aqueous IP-10 | 0.07/.81 | 0.10/.73 | 0.36/.27 |
Stay updated, free articles. Join our Telegram channel

Full access? Get Clinical Tree


