Purpose
To determine the incidence and progression of macular atrophy in patients with neovascular age-related macular degeneration (AMD) treated with vascular endothelial growth factor (VEGF) antagonists.
Design
Retrospective interventional case series.
Methods
All patients with neovascular AMD treated by the same physician during a 12-month period of ascertainment had all images from their entire follow-up period evaluated, and areas of retina that developed atrophy were compared to the same areas prior to the onset of anti-VEGF treatment. Longitudinal measurements of retinal atrophy were made.
Results
In 39 patients, 52 eyes with neovascular AMD were identified. We excluded 5 eyes from analysis (4 had retinal pigment epithelium tears, and 1 had a laser scar). Fundus photographs of the remaining eyes showed that 18/47 eyes (38%) contained hypopigmented areas suggestive of atrophy within the macula at some time during follow-up. Spectral-domain optical coherence tomography confirmed that these areas had loss of retinal pigmented epithelium and ellipsoids zones, with or without subretinal material suggestive of subretinal fibrosis. Comparison of fundus photographs with fluorescein angiograms showed that in 13/18 eyes (72%), atrophy developed in areas previously occupied by choroidal neovascularization, and the other 5 eyes had atrophy prior to the onset of anti-VEGF treatment. The mean (±standard deviation) rate of increase in pure atrophic areas (no subretinal material) was 0.7 ± 0.8 mm 2 per year, with a range of 0.01–2.6 mm 2 /year.
Conclusion
Treatment of neovascular AMD with a VEGF-neutralizing protein can result in regression of choroidal neovascularization, which is sometimes associated with atrophy of overlying retina.
Age-related macular degeneration (AMD) is a common cause of visual loss in residents in developed countries. It is characterized by deposits beneath the retinal pigmented epithelium (RPE) called drusen. The clinical course is quite variable; some patients maintain stable vision for many years while others experience gradual or rapid loss of vision. In some cases, gradual loss of vision occurs in association with the slowly progressive death of the RPE and photoreceptor cells, resulting in areas of retinal atrophy. Atrophy may occur as single or multifocal patches that slowly increase in size, often forming a horseshoe-shaped area of atrophy that surrounds the fovea and can eventually extend into the fovea, causing loss of central vision. This pattern of progression is referred to as geographic atrophy (GA), and the risk of its occurrence is increased in eyes with large soft drusen and pigmentary changes in the macula. In about 10% of patients with AMD, gradual or rapid loss of vision occurs due to the development of choroidal neovascularization (CNV). Eyes that have or have had CNV are classified as having neovascular AMD, while those that have never had CNV are classified as having non-neovascular AMD.
Prior to 2006, neovascular AMD was responsible for the majority of severe vision loss in patients with AMD even though it occurred in a small minority of patients with AMD. However, the realization that vascular endothelial growth factor (VEGF) plays an important part in the pathogenesis of CNV and in the development of potent and selective VEGF-neutralizing proteins led to clinical trials demonstrating dramatic improvement in visual acuity (VA) in patients with neovascular AMD after intraocular injections of ranibizumab, an antibody fragment that binds VEGF-A. Similar results have been obtained with intravitreous injections of other VEGF-neutralizing proteins, including aflibercept and bevacizumab.
Although there is no doubt that intraocular injections of VEGF-neutralizing proteins have greatly improved the visual outcomes of patients with neovascular AMD over 2 years of treatment, long-term outcomes are uncertain, and the best strategy for long-term treatment is unknown. The outstanding outcomes obtained in early clinical trials occurred with monthly injections of a VEGF-neutralizing protein, but other treatment regimens are commonly used in clinical practice, such as pro re nata (PRN) or treat-and-extend regimens guided by spectral-domain optical coherence tomography (OCT). The Comparison of Age-related Macular Degeneration Treatment trials (CATT) compared outcomes in patients with neovascular AMD who were treated in 4 different ways: monthly ranibizumab, monthly bevacizumab, PRN ranibizumab, or PRN bevacizumab. After 2 years, there was no significant difference in visual outcomes in patients treated with monthly ranibizumab or monthly bevacizumab, whereas patients treated with monthly injections had significantly better visual outcomes than those treated PRN. Analysis of fundus photographs and fluorescein angiograms (FAs) suggested that a greater percentage of patients treated with monthly injections compared with those treated PRN developed macular atrophy. In a retrospective review of prospectively obtained fundus photographs and/or FAs, an attempt was made to identify risk factors for development of new areas of atrophy. Approximately one fifth of patients developed atrophy that the investigators interpreted as GA within 2 years of baseline, and independent baseline risk factors included poor VA, retinal angiomatous proliferation (RAP), foveal intraretinal fluid, monthly dosing, and treatment with ranibizumab. The authors concluded that treatment with anti-VEGF agents may have a role in the development of GA and that although monthly injections may result in slightly better visual outcomes at 2 years than PRN dosing, the increased risk for the development of GA may offset this benefit in the long term. To explore the development of macular atrophy in patients with neovascular AMD being treated with anti-VEGF agents, we reviewed fundus photos, FAs, and spectral-domain OCTs in a cohort of patients with neovascular AMD who were receiving anti-VEGF treatment.
Methods
All patients with neovascular AMD receiving treatment with a VEGF-neutralizing protein by a single retina specialist between January 2013 and December 2013 were identified. A retrospective review of the charts and imaging studies was performed in this cohort of patients, which allowed assessments from the onset of anti-VEGF treatment to the most recent follow-up, which often spanned many years. Patients gave informed consent for the treatment of neovascular AMD with anti-VEGF injections. The study was approved by the Johns Hopkins Institutional Review Board. Demographic, VA and treatment data were collected, and fundus photographs were examined to identify areas of atrophy in the macula, defined as single or multiple regions of hypopigmentation with well-defined borders and visible large choroidal vessels. All eyes noted to have atrophy in the macula had had prior fundus photographs and FAs that were examined with careful scrutiny of regions corresponding to the atrophy so as to determine the status of that area at first visit, prior to the onset of anti-VEGF treatment.
In the second part of the analysis, the spectral-domain OCT characteristics of regions that developed atrophy were studied. Starting when Heidelberg Spectralis spectral-domain OCT (Heidelberg Engineering, Heidelberg, Germany) equipment became available, all patients had serial infrared (IR) images and raster scans through the entire macula. The IR image and spectral-domain OCT scan characteristics were determined for regions of the macula noted to have atrophy on current or subsequent fundus photographs.
The third part of the analysis involved measuring areas of atrophy over time to determine the rate of atrophy progression. Measurements were performed on the first and last available Spectralis spectral-domain OCT scans. Areas that had complete loss of RPE and ellipsoid zone (EZ) with no subretinal material were included in the measurement of atrophic area. The area of atrophy at its first appearance and at the most recent follow-up visit were used to calculate the rate of progression.
Measurement of Area of Atrophy on Spectral-Domain OCT
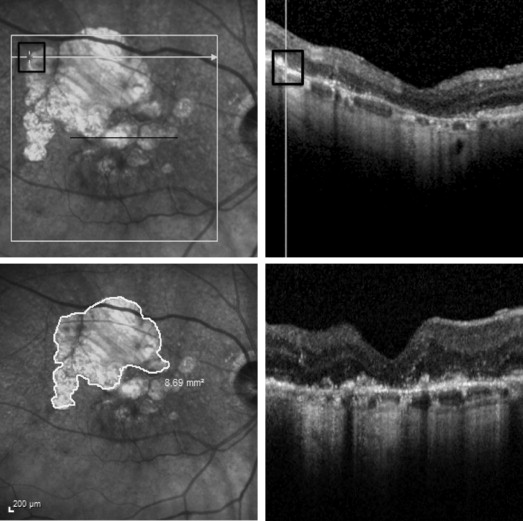
IR images and spectral-domain OCT raster scans were reviewed using the Heidelberg Spectralis software so that locations on the IR image could be correlated with spectral-domain OCT image locations. The same person (RC) obtained all measurements. The pointer tool was used to mark points on the IR image for which spectral-domain OCT scans showed complete loss of RPE and EZ with no subretinal material, except when there were focal areas of abnormal remaining RPE associated with loss of EZ and increased choroidal hyper-reflectivity located within a region of complete loss of RPE and EZ; they were included in the total atrophic area measurement. The free-hand draw tool was used to outline the atrophic area, and the software computed the enclosed area in square millimeters (mm 2 ). The area measurement tool is illustrated in Figure 1 . The IR image ( Figure 1 , upper left) shows a large hypopigmented area superior-temporal to the fovea, and a scan through this area shows loss of RPE and EZ and no subretinal material ( Figure 1 , upper right). Figure 1 , lower left, shows use of the measurement tool to outline the large hypopigmented area and to measure the area. Areas of atrophy in which there was subretinal material ( Figure 1 , lower right), which could represent atrophic scars, were not included in atrophy area measurements. In order to assess intra- and intergrader variability of the measuring methodology, 3 masked graders (SB, OA and RC) performed 2 measurements on the same image, for 25 unique images that were randomly selected from a list of patients with GA who had spectral-domain OCT images. Graders were presented with a randomly arranged sequence of the selected 50 (25 unique images × 2) de-identified images without being provided any information related to the patients. Area measurements were analyzed using the mixed-effects model with a random intercept for the graders and a random intercept for the eyes so as to determine intraclass correlation coefficients (ICCs) between the graders and between the 2 measurements from the same grader. The coefficient of repeatability (COR) for each grader was determined using the Bland-Altman analysis technique.
Results
Thirty-nine patients (52 eyes) with neovascular AMD received treatment with a VEGF-neutralizing protein during the period of ascertainment, January through December 2013. Fundus photographs taken before, during and after the period of ascertainment were examined and showed hypopigmented areas in the macula at some time during follow-up in 23 of 52 eyes (44%). In 18 eyes, the hypopigmentation was due to loss of RPE and EZ on spectral-domain OCT; in 4 eyes, it was due to an RPE tear; and in 1 eye, it was due to laser photocoagulation. Therefore, 18 of 47 eyes (38%) treated with a VEGF-neutralizing protein had an area of atrophy in the macula. Fundus photographs and FAs obtained during a follow-up period that ranged from 0.4 to 7.7 years, with mean ± SD of 3.7± 2.3 years, were examined. Because some patients did not have fundus photographs or FAs during their last few follow-up visits, the total duration of anti-VEGF treatment was slightly longer (mean 4.3 ± 3.2 years; range, 0.4–8.3 years). Of the 18 eyes, 13 (72%) developed atrophy in areas previously occupied by CNV; 5 eyes (28%) had atrophy prior to the development of CNV; and no eyes developed atrophy that was not in an area of prior CNV or adjacent to prior atrophy.
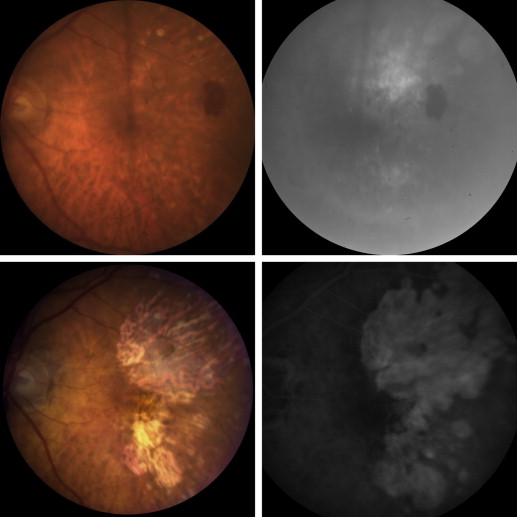
Figure 2 shows images from a patient who developed atrophy throughout a region of the macula previously occupied by a large CNV lesion. The patient is an 84-year-old female with neovascular AMD who presented with distortion and a VA of 20/80 in the left eye due to poorly defined CNV throughout the entire macula ( Figure 2 , top row). Over a 5-year period, she received 45 injections of a VEGF-neutralizing protein in the left eye, after which VA was stable at 20/32 and fundus photographs showed atrophy that corresponded to the area of prior CNV, except that there was less atrophy in the fovea than in the surrounding areas ( Figure 2 , bottom row). There was persistent CNV beneath the fovea, as evidenced by periodic appearance of intraretinal fluid in the fovea on spectral-domain OCT scans when the duration between injections was extended beyond 8 weeks. Figure 3 shows another patient who developed atrophy that corresponded to an area of prior ill-defined CNV. The patient is a 94-year-old female with neovascular AMD who presented with a disciform scar in the right eye and more recent gradual reduction of VA to 20/50 in the left eye. Fundus photograph and FA in the left eye showed a large area of occult CNV superior to the fovea that appeared to extend under the fovea to a region of CNV inferior to the fovea ( Figure 3 , top row). Over a period of 7 years, the patient received 23 injections of a VEGF-neutralizing protein in the left eye. Vision gradually decreased to 20/125, and fundus photography and FA showed atrophy that corresponded to the prior area of CNV ( Figure 3 , bottom row). Figure 4 shows images from a patient who presented with predominantly classic CNV unlike the ill-defined occult CNV seen in the 2 patients discussed above. At the initiation of anti-VEGF treatment, VA was 20/40, and after 5 years and 24 injections of a VEGF-neutralizing protein, VA had dropped to 20/200 due to macular atrophy. The most profound atrophy as seen by the greatest area of window defect seen on FA ( Figure 4 , bottom right) was within the boundaries of the classic component of the CNV seen 5 years earlier ( Figure 4 , top right), but there was also atrophy temporal to the border of the prior classic CNV. On the initial FA, there were subtle abnormalities temporal to the classic CNV that may represent occult CNV ( Figure 4 , top right).
Spectral-Domain OCT Characteristics of Atrophic Areas
In the 13 eyes that developed macular atrophy associated with regression of CNV, 4 (31%) had loss of EZ and RPE with no subretinal material and spectral-domain OCT appearances indistinguishable from those of GA ( Table 1 ). In 9 of 13 eyes (69%), there was subretinal material consistent with subretinal fibrosis and/or drusenoid material within a portion of the atrophic area; in 8 of the 9 eyes, subretinal material occupied ≥50% of the atrophic area. The atrophy was extrafoveal in 9/13 eyes (69%) and foveal in 4 eyes. Of the 5 eyes with pre-existent atrophy, 2 developed new atrophy in a region that was initially occupied by CNV; 1 of these eyes had subretinal material in <50% of the atrophic region, and the other had loss of EZ and RPE without any subretinal material. Three eyes appeared to have extension of the prior area of atrophy; 1 of these had pure atrophy without subretinal material, and 2 had subretinal material within the final area of atrophy. Only 1 of the 5 eyes with pre-existent atrophy had foveal atrophy at last follow-up. Thus, foveal atrophy occurred in 5/18 eyes (28%) at last follow–up, regardless of whether there was atrophy prior to the onset of anti-VEGF treatment or not.
| Patient ID | Atrophy Only or Atrophy and Subretinal Material ∗ | Proportion of Area Involved by Subretinal Material Compared to Atrophy | Did the Atrophic Area Involve the Fovea? | Did the Area of Atrophy Represent an Extension of Pre-Existing Atrophy (Extension) or Regressed Choroidal Neovascularization? † |
|---|---|---|---|---|
| 1 | Atrophy and subretinal material | <50% | No | Regressed CNV |
| 2 | Atrophy and subretinal material | >50% | No | Regressed CNV |
| 3 | Atrophy and subretinal material | <50% | Yes | Extension and regressed CNV |
| 4 | Atrophy | 0 | No | Extension and regressed CNV |
| 5 | Atrophy and subretinal material | 0 | No | Extension |
| 6 | Atrophy | 0 | Yes | Regressed CNV |
| 7 | Atrophy | 0 | Yes | Regressed CNV |
| 8 | Atrophy and subretinal material | >50% | Yes | Regressed CNV |
| 9 | Atrophy and subretinal material | >50% | No | Regressed CNV |
| 10 | Atrophy | 0 | No | Regressed CNV |
| 11 | Atrophy and subretinal material | >50% | No | Extension |
| 12 | Atrophy and subretinal material | about 50% | No | Regressed CNV |
| 13 | Atrophy and subretinal material | >50% | No | Regressed CNV |
| 14 | Atrophy and subretinal material | >50% | No | Regressed CNV |
| 15 | Atrophy and subretinal material | >50% | No | Regressed CNV |
| 16 | Atrophy | 0 | No | Extension |
| 17 | Atrophy | 0 | No | Regressed CNV |
| 18 | Atrophy and subretinal material | >50% | Yes | Regressed CNV |
∗ Atrophy was defined as complete loss of retinal pigmented epithelium and ellipsoid zone on spectral-domain optical coherence tomography with increased choroidal hyper-reflectivity; atrophy with subretinal material was defined as atrophy with hyper-reflective deposits beneath the retina.
† This column shows whether, on the first available infrared image, atrophy occurred in the same area that previously contained choroidal neovascularization, referred to as regressed CNV, or in an area adjacent to pre-existing atrophy (extension of atrophy). The determination that atrophy was an extension of pre-existent atrophy or resulted from regression of CNV was made after review of all available images for a given patient, including prior fundus photos and fluorescein angiograms and spectral-domain OCT images.
Repeatability of Area of Atrophy Measurements Using Spectral-Domain OCT
The intra- and intergrader repeatability was excellent. ICC and 95% confidence interval (CI) for intragrader repeatability was 0.999 (0.998–0.999) and ICC (95% CI) for intergrader repeatability (SB vs OA) was 0.997 (0.994–0.998). The COR (95% CI) for grader SB was 0.65 (0.57–0.76), which means the difference between 2 measurements for the same patient is expected to be less than 0.65 mm 2 for 95% of observation pairs from grader SB. Grader RC and grader OA had lower COR (95% CI), 0.21 (0.19, 0.25) and 0.16 (0.14, 0.19), respectively.
Evolution of Atrophic Areas by Spectral-Domain OCT
One eye (patient 18) was excluded from measurements due to the presence of severe subretinal fibrosis within the entire area of atrophy, with few or no locations without subretinal material. For 17 eyes, the area of complete RPE and EZ loss devoid of any subretinal material was measured over time ( Table 2 ). The average follow-up time was 1.6 ± 1.1years (range, 0.3–3.8 years). Mean (±SD) increase in area of atrophy was 0.7± 0.8 mm 2 and mean increase per year was 0.7 ± 0.6 mm 2 with a range of 0.01–2.6 mm 2 . Thirteen eyes had a rate of increase in area over time that was higher than the COR of 0.21 mm 2 . The mean number of anti-VEGF injections administered per year during the measurement period was 6.2 ± 3.3, and the type of anti-VEGF administered was either aflibercept or ranibizumab. There was no correlation between the number of anti-VEGF injections administered per year and the rate of atrophy progression (r = 0.03, P = 0.89).


