Purpose
To investigate the relationship between outer retinal reflectivity on spectral-domain optical coherence tomography and cone density in the corresponding area.
Design
Prospective cross-sectional observational study.
Methods
In this institutional-based study, 20 eyes of 10 patients presenting maculopathies with various degrees of impairment of the photoreceptor layer (central serous chorioretinopathy, chronic central serous chorioretinopathy, maculopathy associated with hydroxychloroquine, and healthy eyes) were studied. Selection criteria were intended to ensure good image quality. Inner segment ellipsoid band reflectivity, global retinal reflectivity, and relative inner segment ellipsoid reflectivity (defined as the ratio of inner segment ellipsoid band reflectivity on overall retinal reflectivity) were measured on a longitudinal reflectance profile extracted from the spectral-domain optical coherence tomography B-scan. The cone metrics were measured in the same region of interest, located in the perifoveal area, using an adaptive optics retinal camera.
Results
Inner segment ellipsoid and relative ellipsoid reflectivity were closely correlated with cone density (Pearson r: 0.72 and 0.70, respectively, P < .01).
Conclusion
Outer retinal reflectivity on the transversal optical coherence tomography scan can be correlated to adaptive optics in terms of photoreceptor density. This quantitative approach using optical coherence tomography images could have important implications in the management of maculopathies.
Optical coherence tomography (OCT) is an imaging modality that provides cross-sectional images based on the measurement of the magnitude and echo time delay of backscattered light. Since its introduction in ophthalmology 2 decades ago, OCT has become an essential tool in diagnosis, follow-up, and prognosis of retinal diseases. Current commercial spectral-domain OCT instruments conventionally resolve 4 reflective bands in the outer retina outside of the central fovea. The second of the 4 bands has been commonly ascribed to the boundary between the inner segments and outer segments of the photoreceptors. In a recent comparative study between OCT and histology, Spaide and Curcio showed that the second reflective band co-localized with the ellipsoid section of the cones and proposed to rename it the ellipsoid band. Until recently, in the absence of reliable automated segmentation procedures of the retinal layers for routine practice, this band could only be evaluated qualitatively. For instance, the aspect of the inner segment ellipsoid band has been studied in many retinal conditions and it appeared that its interruption was correlated to poor vision. However, a few authors performed experimental quantifications based on A-scans and underlined the potential benefit of this approach in predicting visual outcomes. Even if the current OCT devices produce images of ocular tissue microstructure with up to 4 μm axial resolution, they lack the lateral resolution necessary to image single retinal cells. A new imaging modality, adaptive optics, based on the correction of the optical aberrations of the eye, has contributed new insight into the retinal imaging field by providing real-time images of the macular photoreceptors with a resolution close to histology.
In this work, we analyzed quantitatively the retinal reflectivity on spectral-domain OCT images as a function of scan depth in patients presenting maculopathies of various stages in order to compare the reflectivity of the outer retina to the results of cone metrics measured in the same region of interest using adaptive optics.
Methods
This institutional-based cross-sectional study was conducted in the Ophthalmology Department of the University Hospital of Besancon (France). The protocol was approved by the local ethics committee of the Besancon University Hospital and adhered to the tenets of the Declaration of Helsinki. The nature of the study and its possible consequences were explained to study candidates, after which written informed consent was obtained from all participants.
Participants
Patients presenting macular diseases with impairment of the photoreceptor layer observed on spectral-domain OCT cross-sectional B-scan were studied. All patients underwent comprehensive ophthalmologic examination including best-corrected visual acuity measurement and slit-lamp fundus examination. Ocular axial length was measured using an IOLMaster 500 (Carl Zeiss Meditec, Dublin, California, USA); spherical equivalent refractive errors were measured using the TONOREF II autorefractometer (Nidek, Aichi, Japan).
All patients underwent spectral-domain OCT imaging (Spectralis; Heidelberg Engineering, Heidelberg, Germany). The protocol consisted of acquiring a retinal volume of 21 consecutive horizontal 20-degree (length) lines with 1024 A-scans/B-scans. At least 9 B-scans per image were averaged by the Tracking ART (Automatic Real-Time) software. Only scans with a signal-to-noise ratio above 30 dB were kept for analysis.
Exclusion criteria for this study aimed to obtain the best quality of retinal images for analysis. They included any condition impairing the media clarity, myopia (≥3 diopters spherical equivalent), astigmatism known to produce high-order aberrations, patients presenting a significant tear film disorder (tear breakup time <10 s), insufficient pharmacologically induced mydriasis (pupil diameter <5 mm), uncontrolled movements of the eyes or the head, and poor fixation. Also excluded were patients presenting intraretinal or subretinal fluid, massive exudates, hemorrhage, and pigment changes masking the outer retinal structures.
Quantitative Analysis of Inner Segment Ellipsoid Band Reflectivity and Thickness
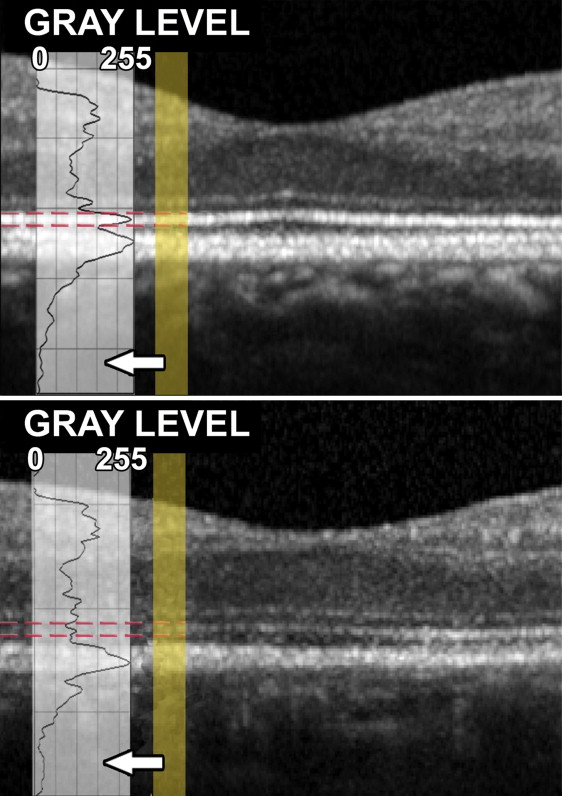
Images were analyzed using ImageJ (National Institutes of Health, Bethesda, Maryland, USA). Scans were exported through the built-in export function of the OCT software with an 8-bit color depth (256 grayscale values). Images were used as exported for analysis and not changed in brightness or contrast. Both parameters were preset by the OCT software. Four distinct peaks within the longitudinal reflectivity profiles were detected and the one corresponding to the inner segment ellipsoid band was analyzed. Inner segment ellipsoid band reflectivity was created by averaging pixels that corresponded to the 0.3-degree portion of the inner segment ellipsoid band in the region of interest across each level.
Measurements were taken at 1.5 degrees eccentricity from the fovea ( Figure 1 ) in nasal, temporal, superior, and inferior areas along the horizontal and vertical axis crossing the fovea. For each area, 3 measurements were taken in 3 adjacent B-scans. The data presented correspond to the mean of these 3 measurements for each area.
In addition, relative reflectivity was measured. The latter corresponded to the ratio of inner segment ellipsoid band reflectivity on overall retinal reflectivity.
For the inner segment ellipsoid band thickness measurement, images were evaluated independently by 2 readers (M.S., M.F.), both unaware of clinical information. When the evaluations did not agree (difference >2 μm), the opinion of a third author (B.D.) was requested. In practice, on the Spectralis viewing module, the calipers were manually moved to the borders of the inner segment ellipsoid band. The thinnest point of the band in the area studied was determined. The accuracy of this procedure was assessed in a previous paper.
Adaptive Optics Imaging
Eyes were imaged using a flood illumination adaptive optics camera (RTX-1; Imagine Eyes, Orsay, France). This commercial clinical prototype, approved for research use only in Europe, is based on a noncoherent flood-illuminated design with an 850 nm central illumination wavelength allowing imaging of macular photoreceptors with a lateral resolution of 2 μm. Its low-noise charge-coupled-device camera has a pixel resolution of 1.6 μm and a frame rate of 9.5 fps.
Image Acquisition and Processing Procedures
Adaptive optics imaging sessions were conducted after the pupils were dilated with 1 drop each of 0.5% tropicamide. The retinal area imaged was centered on the fovea, resulting in an area 4 degrees square. The imaging depth was chosen within the range of 0–80 μm in which the live retina images appeared to be the sharpest. On the device control panel, a numerical value informed the operator about the adaptive optics correction level. The lower the value was, the better the correction, providing better acquisition quality. During the approximately 30-s acquisition, 40 live high-resolution images of the retina were automatically averaged by the device.
Image Processing
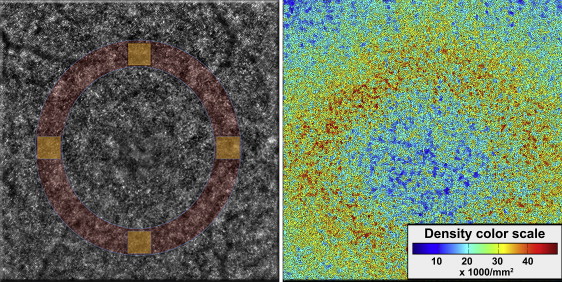
Each series of 40 images acquired by the adaptive optics camera was processed using software programs provided by the system’s manufacturer (CK v0.1 and AOdetect v0.1; Imagine Eyes). These images were registered using a cross-correlation method and averaged to produce a final image with an improved signal-to-noise ratio. The raw images that showed artifacts due to eye blinking and saccades were automatically eliminated before averaging. For display and printing purposes, the background of the resulting image was subtracted using a Gaussian filter and the histogram was stretched over a 16-bit range of gray levels. The positions of photoreceptors were computed by automatically detecting the central coordinates of small circular spots whose brightness was higher than the surrounding background level. First, the averaged image, as obtained before background removal and histogram stretching, was further processed using adaptive and multiple-scale digital filters. Then the local maxima of the resulting filtered image were detected and their pixel coordinates were recorded. The area of analysis corresponded to 4 squares (0.3 × 0.3 degree) placed at a fixed distance from the fovea (1.5 degrees), respectively superiorly, inferiorly, nasally, and temporally along the horizontal and vertical axes crossing the fovea of the eye studied ( Figure 2 ). The measurement protocol was previously described and was shown to be reproducible in normal eyes. The estimates of cone density were verified by 3 investigators (P.T., M.S., M.M.) to minimize any potential cone under- or oversampling made by the automated software. The cone density presented corresponds to the mean of these 3 measurements.
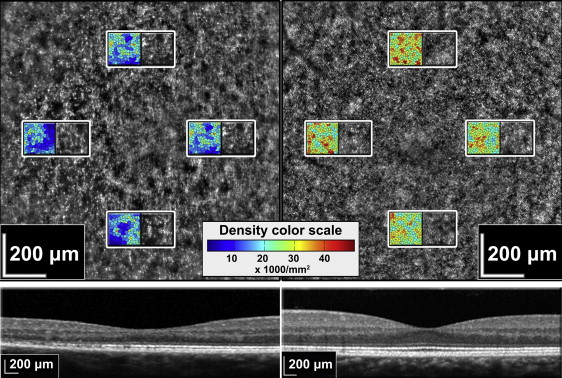
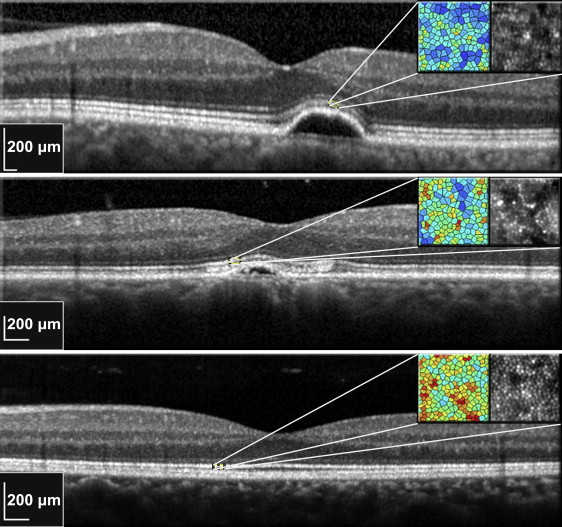
It is important to note that all the processing and detection steps were fully automated ( Figures 3 and 4 ). The only significant intervention of the grader was the placement of the square, which determines the measurement area.
Statistical Analysis
All values represent the mean ± standard deviation. Correlations with calculation of the Pearson r and linear regression were performed.
Statistics were calculated using a commercially available software program (SPSS, ver. 20.0; SPSS Inc, Chicago, Illinois, USA). P < .05 was considered statistically significant.
Stay updated, free articles. Join our Telegram channel

Full access? Get Clinical Tree


