Purpose
To compare the incidence, prevalence, and hazard of nonexudative and exudative age-related macular degeneration (AMD) among different races throughout the United States.
Design
Retrospective longitudinal cohort study.
Methods
Billing records of all encounters for 2 259 061 beneficiaries aged ≥40 enrolled in a large, national US managed care network from 2001 through 2007 were reviewed and the incidence and prevalence of nonexudative and exudative AMD were determined and stratified by race. Cox regression analyses determined the hazard of nonexudative and exudative AMD for each race, with adjustment for confounders.
Results
During the study, 113 234 individuals (5.0%) were diagnosed with nonexudative and 17 181 (0.76%) with exudative AMD. After adjustment for confounders, blacks had a significantly reduced hazard of nonexudative (hazard ratio [HR] = 0.75, 95% confidence interval [CI]: 0.71–0.79) and exudative AMD (HR = 0.70, 95% CI: 0.59–0.83) at age 60 and a reduced hazard of nonexudative (HR = 0.56, 95% CI: 0.52–0.60) and exudative AMD (HR = 0.45, 95% CI: 0.37–0.54) at age 80 relative to whites. Similar comparisons for Latinos demonstrated an 18% reduced hazard for nonexudative AMD at age 80 (HR = 0.82, 95% CI: 0.76-0.88) relative to whites. Asian Americans showed a 28% increased hazard for nonexudative AMD at age 60 (HR = 1.28, 95% CI: 1.20–1.36) but a 46% decreased hazard for exudative AMD at age 80 (HR = 0.54, 95% CI: 0.40–0.73).
Conclusions
Racial minorities, including Latinos and Asian Americans, do not appear to have similar risks of developing nonexudative and exudative AMD as whites. Additional studies using other sources should be conducted to determine the generalizability of this study’s findings to other groups.
Age-related macular degeneration (AMD) is the leading cause of severe low vision and blindness in the United States. Several large population-based studies have examined differences in the prevalence of AMD between whites and blacks in the United States ( Table 1 ). These studies have consistently demonstrated that AMD affects whites more than blacks. When examining differences in prevalence of AMD between other racial minorities and whites, there are conflicting findings as to whether Latinos have higher or lower rates of AMD relative to whites ( Table 1 ). An analysis of data from the National Health and Nutrition Examination Survey (NHANES) and another from the Multi-ethnic Study of Atherosclerosis (MESA) study found that Latinos had lower rates of early and late nonexudative AMD relative to whites. In contrast, findings from the Colorado-Wisconsin Study of Age-related Maculopathy showed higher rates of nonexudative AMD in Latinos compared with whites and the Proyecto VER identified signs of early AMD in over one quarter of Latinos over 50 years of age. While studies have assessed rates of AMD among individuals residing in Asian countries, little is known about the prevalence of AMD among Asian Americans. Given that Latino and Asian Americans constitute the 2 fastest-growing minorities in the United States, representing nearly 20% of the population, it is becoming increasingly important to have an improved understanding of the epidemiology of AMD for these groups.
| Study Name | Primary Author | Year | Population | N | Age | Early AMD Prevalence % (N) | Late a AMD Prevalence % (N) | Exudative AMD Prevalence % (N) |
|---|---|---|---|---|---|---|---|---|
| The Beaver Dam Eye Study | Klein R | 1992 | White (Wisconsin) | 4771 | ≥43 | 15.60 | 1.60 | 1.2 (57) |
| The Colorado-Wisconsin Study of Age-related Maculopathy | Cruickshanks KJ | 1997 | White (Wisconsin) | 3995 | 43-74 | 14.0 (559) b | 0.60 (24) b | NA |
| White (Colorado) | 3048 | 43-74 | 9.6 (292) b | 0.8 (24) b | NA | |||
| Hispanic c (Colorado) | 2247 | 43-74 | 14.3 (321) b | 0.1 (1) b | NA | |||
| National Health and Nutrition Examination Survey III | Klein R | 1999 | White | 4054 | ≥40 | 9.1 (369) | 0.5 (20) | 0.3 (14) |
| Black | 1996 | ≥40 | 8.3 (165) | 0.13 (3) | 0.1 (2) | |||
| Mexican-American c | 1838 | ≥40 | 7.6 (139) | 0.06 (1) | 0.1 (2) | |||
| The Baltimore Eye Survey | Friedman DS | 1999 | White | 2518 | ≥40 | 20.2 (509) d | 1.4 (35) | 0.6 (15) |
| Black | 1843 | ≥40 | 19.8 (365) d | 0.2 (4) | 0.1 (2) | |||
| AMD in the Atherosclerosis Risk in Communities Study | Klein R | 1999 | White | 8984 | 48-72 | 5.4 (485) | 0.2 (15) | NA |
| Black | 2548 | 48-72 | 3.7 (94) | 0.0 (0) | NA | |||
| The Los Angeles Latino Eye Study | Varma R | 2004 | Mexican-American c | 5875 | ≥40 | 9.4 (551) | 0.43 (25) | 0.29 (17) |
| Proyecto VER | Muñoz B | 2005 | Mexican-American c | 2776 | ≥50 | 27.9 (775) e | 0.59 (15) | 0.14 (4) |
| AMD in the Multi-ethnic Study of Atherosclerosis (MESA) | Klein R | 2006 | White | 2299 | ≥45 | 4.8 (110) | 0.6 (14) | NA |
| Black | 1583 | ≥45 | 2.1 (33) | 0.3 (5) | NA | |||
| Hispanic c | 1274 | ≥45 | 4 (51) | 0.2 (3) | NA | |||
| Chinese c | 691 | ≥45 | 3.6 (25) | 1 (7) | NA | |||
| The Salisbury Eye Evaluation Project | Bressler SB | 2008 | White | 1854 | 65-84 | NA | 3.5 (63) | 1.7 (30) |
| Black | 666 | 65-84 | NA | 1.3 (9) | 1.0 (7) |
a Late AMD includes study participants with both geographic atrophy and exudative AMD.
c Racial or ethnicity group reported as described in their respective papers.
d Age-adjusted rate of age-related maculopathy.
The purpose of this study is to use healthcare claims data from a large, national managed care network to compare the incidence, prevalence, and hazard of developing nonexudative and exudative AMD among individuals of different races. Such information would be important for clinicians in identifying those most at risk for disease, for developing more appropriate screening protocols of AMD, for researchers designing and recruiting participants for clinical trials, and for health policymakers when determining resource allocation.
Methods
Data Source
The i3 InVision Data Mart database (Ingenix, Eden Prairie, Minnesota, USA) contains records of all beneficiaries in a large managed care network in the United States. We analyzed a subset of beneficiaries who had any form of eye care from January 1, 2001 through December 31, 2007, defined as any person who had 1 or more International Classification of Diseases, Ninth Revision Clinical Modification (ICD-9CM) codes for any eye-related diagnosis (360-379.9), or Current Procedural Terminology (CPT-4) code for any eye-related visits, diagnostic or therapeutic procedures (65091-68899 or 92002-92499), or any other ICD-9CM or CPT codes assigned by an ophthalmologist or optometrist during his or her time in the medical plan. For each beneficiary in the sample, we had access to all medical claims (inpatient, outpatient, skilled nursing facility) both for ocular and nonocular medical conditions. The database also contains detailed records of demographic (age, sex, race, ethnicity) and socioeconomic information (education level, household net worth) for each beneficiary.
Subjects
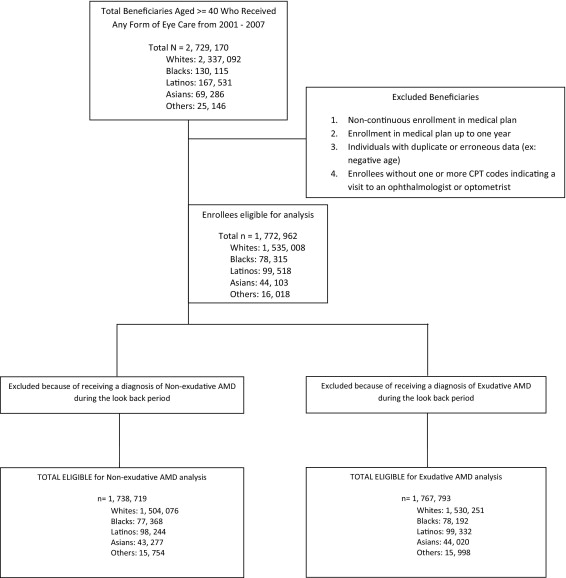
All individuals aged 40 or older who were in the i3 InVision Data Mart database for more than 1 consecutive year and had 1 or more visits to an eye care provider during their time in the medical plan were identified. Individuals in the medical plan for 365 days or less and those who were not in the medical plan continuously from their beginning to their ending date of enrollment were excluded ( Figure ). The race of each beneficiary was identified by the managed care company using information provided from 2 sources: public records (driver’s license data) and E-Tech (Ethnic Technologies, LLC, South Hackensack, New Jersey, USA), a tool that uses information from the name of the beneficiary and the census block he or she lives in to assign race. Although enrollee names and other identifying information is used by Ingenix to assist with the assignment of race, all identifiers are removed before the data are sold to researchers; thus the data we had access to for this analysis were, in essence, de-identified. Previous comparisons between assignment of race using E-Tech and information collected from patient self-report demonstrated that E-Tech has a positive predictive value of 71%. Races were categorized as non-Hispanic white (henceforth referred to as white), black, Latino, and Asian American. All other races were categorized as “Others.” The proportion of enrollees of the different races in this network was found to be relatively similar to that of the 2000 US Census, although blacks were less well represented in the study sample (5.5%) relative to the census data for persons aged ≥40 in the US population (9.2%).
Incidence and Prevalence of Nonexudative and Exudative AMD
ICD-9CM codes were used to determine whether each beneficiary had 1 or more diagnoses of AMD during his or her time in the medical plan. Incidence and prevalence rates were determined for nonexudative AMD (ICD-9CM codes 362.50, 362.51, and 362.57) and exudative AMD (ICD-9CM code 362.52).
Beneficiaries could be diagnosed with more than 1 form of AMD during their time in the medical plan and were counted in the disease incidence and prevalence estimates for each type of AMD they were documented to have. For example, if a beneficiary was diagnosed with nonexudative AMD in 2002 and diagnosed with exudative AMD in 2005, she was counted as a prevalent case for each of these types of AMD. The database does not contain information to determine whether persons diagnosed with both nonexudative and exudative AMD had these conditions in the same eye over the course of their time in the medical plan. Prevalence and incidence rates of nonexudative and exudative AMD were obtained by identifying the number of individuals diagnosed with each condition divided by the number of beneficiaries in the medical plan during the 7-year time period. When interpreting prevalence estimates, it is important to note that not every beneficiary was in the medical plan for all 7 years. Incidence rates of nonexudative and exudative AMD were calculated by dividing the number of newly diagnosed beneficiaries with each type of AMD by their time in the plan at risk. Diagnoses were considered incident cases if the enrollees did not have any record of the AMD type of interest during their first year in the medical plan. Nonexudative and exudative AMD incidence and prevalence rates for the different races were compared using a test of rate ratios, with white race as the reference group.
Analyses
All analyses were performed by using SAS 9.2 (SAS Institute, Inc., Cary, North Carolina, USA). Participant characteristics were summarized for the entire sample using means and standard deviations for continuous variables and frequencies and percentages for categorical variables. Incidence and prevalence estimates were generated for nonexudative and exudative AMD and stratified according to race.
Cox regression analysis was performed to determine the hazard of developing nonexudative and exudative AMD. We used the first year each beneficiary was enrolled in the medical plan as a look-back period. To avoid selection bias, follow-up of all enrollees started at 1 year after enrollment in the medical plan. The model captures incident cases since individuals diagnosed with nonexudative or exudative AMD during the look-back period were excluded from the analysis. Beneficiaries were followed 1 year after enrollment until they either were diagnosed with the condition (nonexudative or exudative AMD) or were censored (either when they left the medical plan or the last day for which we had data, December 31, 2007). For each beneficiary the age to diagnosis or the age to censoring was determined. Using age as the time axis and race as the key predictor of interest, the Cox model was left-truncated at the age of index (1 year after entry into the medical plan). Adjustments were made for age (the time axis), sex, region of residence within the United States, education level, household net worth, and the following medical and ocular conditions: diabetes mellitus, systemic arterial hypertension, hyperlipidemia, obesity, myocardial infarction, congestive heart failure, peripheral vascular disease, cerebrovascular accident, renal insufficiency, coagulopathy, blood loss anemia, deficiency anemias, systemic hypotension, skin cancer (a surrogate measure of long-term sun exposure), cataract, pseudophakia or aphakia, diabetic retinopathy, and open-angle glaucoma ( Supplemental Table at AJO.com ). For all analyses, a P value of < .05 was considered statistically significant.
Results
Of the 2 259 061 individuals in the medical plan who met the inclusion criteria, 1 772 962 individuals (79%) were able to be classified according to race. Of those, there were 1 535 008 whites (87%), 78 315 blacks (4%), 99 518 Latinos (6%), and 44 103 Asian Americans (3%). The median age at entry into the plan was 52 years (range 40-87 years) and the average enrollment time within the plan was 3.75 ± 1.81 years. Table 2 shows the breakdown of individuals with nonexudative and exudative AMD stratified by age, sex, and race. Among all enrollees in the medical plan aged ≥40, 46% of individuals underwent ≥1 eye examination over the course of their time in the plan. Latinos had the lowest rates of eye examinations (38%), followed by Asian Americans (43%), blacks (45%), and whites (47%). All analyses focus only on individuals who had ≥1 eye examination while in the plan.
| Persons With Nonexudative AMD | Persons With Exudative AMD | |||||||||||||
|---|---|---|---|---|---|---|---|---|---|---|---|---|---|---|
| Age | Race | Male | Female | Total | Male | Female | Total | Total Eligible | ||||||
| 40-49 | White | 3167 | 0.57% | 4306 | 0.78% | 7473 | 1.36% | 347 | 0.06% | 356 | 0.06% | 703 | 0.13% | 551174 |
| Black | 116 | 0.42% | 240 | 0.87% | 356 | 1.29% | 7 | 0.03% | 20 | 0.07% | 27 | 0.10% | 27696 | |
| Latino | 306 | 0.69% | 379 | 0.85% | 685 | 1.53% | 45 | 0.10% | 51 | 0.11% | 96 | 0.21% | 44667 | |
| Asian | 206 | 1.08% | 196 | 1.03% | 402 | 2.11% | 20 | 0.10% | 12 | 0.06% | 32 | 0.17% | 19082 | |
| Other | 69 | 1.00% | 75 | 1.09% | 144 | 2.09% | 8 | 0.12% | 3 | 0.04% | 11 | 0.16% | 6884 | |
| 50-59 | White | 6996 | 1.32% | 9692 | 1.83% | 16688 | 3.14% | 789 | 0.15% | 941 | 0.18% | 1730 | 0.33% | 530996 |
| Black | 219 | 0.82% | 461 | 1.72% | 680 | 2.53% | 27 | 0.10% | 46 | 0.17% | 73 | 0.27% | 26866 | |
| Latino | 445 | 1.34% | 587 | 1.77% | 1032 | 3.11% | 57 | 0.17% | 61 | 0.18% | 118 | 0.36% | 33232 | |
| Asian | 277 | 1.82% | 404 | 2.66% | 681 | 4.48% | 34 | 0.22% | 37 | 0.24% | 71 | 0.47% | 15199 | |
| Other | 90 | 1.67% | 101 | 1.88% | 191 | 3.55% | 6 | 0.11% | 6 | 0.11% | 12 | 0.22% | 5383 | |
| 60-69 | White | 8745 | 3.17% | 10814 | 3.92% | 19559 | 7.09% | 1154 | 0.42% | 1299 | 0.47% | 2453 | 0.89% | 276023 |
| Black | 240 | 1.64% | 493 | 3.36% | 733 | 5.00% | 38 | 0.26% | 67 | 0.46% | 105 | 0.72% | 14657 | |
| Latino | 451 | 2.98% | 587 | 3.88% | 1038 | 6.85% | 84 | 0.55% | 66 | 0.44% | 150 | 0.99% | 15148 | |
| Asian | 278 | 3.91% | 332 | 4.67% | 610 | 8.58% | 21 | 0.30% | 29 | 0.41% | 50 | 0.70% | 7106 | |
| Other | 103 | 4.11% | 72 | 2.87% | 175 | 6.98% | 8 | 0.32% | 7 | 0.28% | 15 | 0.60% | 2507 | |
| 70-79 | White | 10924 | 8.06% | 14772 | 10.90% | 25696 | 18.96% | 2088 | 1.54% | 2664 | 1.97% | 4752 | 3.51% | 135552 |
| Black | 272 | 3.62% | 509 | 6.78% | 781 | 10.41% | 35 | 0.47% | 72 | 0.96% | 107 | 1.43% | 7504 | |
| Latino | 358 | 6.64% | 435 | 8.06% | 793 | 14.70% | 83 | 1.54% | 82 | 1.52% | 165 | 3.06% | 5393 | |
| Asian | 185 | 8.30% | 209 | 9.37% | 394 | 17.67% | 16 | 0.72% | 22 | 0.99% | 38 | 1.70% | 2230 | |
| Other | 74 | 7.22% | 83 | 8.12% | 157 | 15.33% | 18 | 1.76% | 13 | 1.27% | 31 | 3.03% | 1024 | |
| 80-87 | White | 5222 | 12.70% | 8166 | 19.86% | 13388 | 32.57% | 1228 | 2.99% | 1988 | 4.84% | 3216 | 7.82% | 41110 |
| Black | 88 | 5.55% | 197 | 12.43% | 285 | 17.98% | 17 | 1.07% | 37 | 2.33% | 54 | 3.41% | 1585 | |
| Latino | 102 | 9.55% | 143 | 13.39% | 245 | 22.94% | 25 | 2.34% | 36 | 3.37% | 61 | 5.71% | 1068 | |
| Asian | 58 | 12.01% | 76 | 15.73% | 134 | 27.74% | 9 | 1.86% | 17 | 3.52% | 26 | 5.38% | 483 | |
| Other | 27 | 12.27% | 37 | 16.82% | 64 | 29.09% | 4 | 1.82% | 8 | 3.64% | 12 | 5.45% | 220 | |
Differences in Nonexudative and Exudative AMD Prevalence and Incidence Rates by Race
There were a total of 113 234 persons diagnosed with nonexudative AMD, for an overall prevalence of 5.01% ( Table 3 ). Whites had the highest prevalence of nonexudative AMD (5.40%), followed by Asian Americans (5.04%), Latinos (3.81%), and blacks (3.62%). The rate ratio test, which compares the prevalence of nonexudative AMD in each race with the prevalence in whites, showed significantly lower prevalence rates of nonexudative AMD in all of the other races relative to whites ( P < .05 for all comparisons).
| Dry AMD | Wet AMD | |||||||||
|---|---|---|---|---|---|---|---|---|---|---|
| Prevalence | Incidence | Prevalence | Incidence | |||||||
| Strata | N Total | Weights | N | Rate | N | Rate | N | Rate | N | Rate |
| Overall | 2259061 | 113234 | 5.01% | 69521 | 1.16% | 17181 | 0.76% | 10635 | 0.17% | |
| Race | ||||||||||
| White | 1535008 | 82818 | 5.40% | 51886 | 1.18% | 12857 | 0.84% | 8100 | 0.18% | |
| 40–50 | 551213 | 0.33 | 7475 | 1.36% | 5371 | 0.32% | 703 | 0.13% | 484 | 0.03% |
| 50–60 | 531039 | 0.26 | 16689 | 3.14% | 11699 | 0.74% | 1732 | 0.33% | 1255 | 0.08% |
| 60–70 | 276062 | 0.17 | 19562 | 7.09% | 12690 | 1.83% | 2453 | 0.89% | 1606 | 0.22% |
| 70–80 | 135578 | 0.15 | 25702 | 18.96% | 15379 | 4.52% | 4752 | 3.50% | 2955 | 0.76% |
| 80 and over | 41116 | 0.09 | 13390 | 32.57% | 6747 | 8.61% | 3217 | 7.82% | 1800 | 1.81% |
| Age-adjusted rates | 8.08% | 2.02% | 1.47% | 0.34% | ||||||
| Black | 78315 | 2836 | 3.62% | 1889 | 0.85% | 366 | 0.47% | 243 | 0.11% | |
| 40–50 | 27696 | 0.42 | 356 | 1.29% | 260 | 0.32% | 27 | 0.10% | 19 | 0.02% |
| 50–60 | 26869 | 0.26 | 680 | 2.53% | 483 | 0.61% | 73 | 0.27% | 55 | 0.07% |
| 60–70 | 14659 | 0.16 | 733 | 5.00% | 472 | 1.25% | 105 | 0.72% | 68 | 0.17% |
| 70–80 | 7504 | 0.11 | 781 | 10.41% | 514 | 2.58% | 107 | 1.43% | 69 | 0.32% |
| 80 and over | 1587 | 0.06 | 286 | 18.02% | 160 | 4.69% | 54 | 3.40% | 32 | 0.83% |
| Age-adjusted rates | 4.11% | 1.03% | 0.57% | 0.14% | ||||||
| Latino | 99518 | 3793 | 3.81% | 2519 | 0.93% | 591 | 0.59% | 405 | 0.15% | |
| 40–50 | 44673 | 0.46 | 685 | 1.53% | 475 | 0.38% | 97 | 0.22% | 71 | 0.06% |
| 50–60 | 33234 | 0.26 | 1032 | 3.11% | 714 | 0.78% | 118 | 0.36% | 77 | 0.08% |
| 60–70 | 15150 | 0.15 | 1038 | 6.85% | 693 | 1.89% | 150 | 0.99% | 111 | 0.29% |
| 70–80 | 5393 | 0.09 | 793 | 14.70% | 484 | 3.67% | 165 | 3.06% | 109 | 0.75% |
| 80 and over | 1068 | 0.04 | 245 | 22.94% | 153 | 6.58% | 61 | 5.71% | 37 | 1.39% |
| Age-adjusted rates | 4.74% | 1.24% | 0.83% | 0.21% | ||||||
| Asian | 44103 | 2221 | 5.04% | 1395 | 1.17% | 217 | 0.49% | 134 | 0.11% | |
| 40–50 | 19082 | 0.42 | 402 | 2.11% | 270 | 0.49% | 32 | 0.17% | 21 | 0.04% |
| 50–60 | 15200 | 0.28 | 681 | 4.48% | 457 | 1.10% | 71 | 0.47% | 49 | 0.11% |
| 60–70 | 7108 | 0.16 | 610 | 8.58% | 374 | 2.29% | 50 | 0.70% | 30 | 0.17% |
| 70–80 | 2230 | 0.10 | 394 | 17.67% | 225 | 4.23% | 38 | 1.70% | 22 | 0.36% |
| 80 and over | 483 | 0.04 | 134 | 27.74% | 69 | 7.15% | 26 | 5.38% | 12 | 1.00% |
| Age-adjusted rates | 6.38% | 1.59% | 0.70% | 0.15% | ||||||
| Other | 16018 | 731 | 4.56% | 467 | 1.04% | 81 | 0.51% | 61 | 0.13% | |
| 40–50 | 6884 | 0.51 | 144 | 2.09% | 100 | 0.49% | 11 | 0.16% | 11 | 0.05% |
| 50–60 | 5383 | 0.27 | 191 | 3.55% | 126 | 0.82% | 12 | 0.22% | 11 | 0.07% |
| 60–70 | 2507 | 0.13 | 175 | 6.98% | 121 | 1.96% | 15 | 0.60% | 11 | 0.17% |
| 70–80 | 1024 | 0.07 | 157 | 15.33% | 90 | 3.53% | 31 | 3.03% | 22 | 0.78% |
| 80 and over | 220 | 0.03 | 64 | 29.09% | 30 | 7.45% | 12 | 5.45% | 6 | 1.18% |
| Age-adjusted rates | 4.73% | 1.16% | 0.57% | 0.15% | ||||||
Stay updated, free articles. Join our Telegram channel

Full access? Get Clinical Tree


