Purpose
To quantify changes in corneal neovascularization in patients with active keratitis after treatment using color imaging, fluorescein angiography (FA), and indocyanine green angiography (ICGA).
Design
Prospective, interventional case series.
Methods
Twelve consecutive patients were studied. A comparison of corneal neovascularization parameters was undertaken before and after resolution of the keratitis. A slit-lamp digital camera acquired images of the neovascularization using color imaging, FA, and ICGA. The best-quality images were selected using a grading system, and the neovascular regions of interest were analyzed using automated in-house software. The parameters of analysis were vessel area, diameter, tortuosity, and FA dye leakage.
Results
There was a significant reduction in the area of neovascularization after treatment on color imaging (0.78 mm 2 ; P < .05), FA (2.33 mm 2 ; P < .01), and ICGA (2.07 mm 2 ; P < .01). There was also a significant reduction in mean vessel diameter across the region of interest for each patient, more marked on FA (42.74 to 32.52 μm; P < .01) and ICGA (44.77 to 33.29 μm; P < .01) than on color imaging (29.10 to 25.17 μm; P < .01). A significant change in vessel tortuosity was not observed. There was a significant increase in FA dye leakage time (12.41 seconds; P < .05) after treatment.
Conclusions
We demonstrate application of an objective method for analyzing changes in corneal neovascularization. The excellent vessel delineation with ICGA even in the presence of stromal scars makes it an ideal agent for measurement of vessel parameters. FA is useful at detecting vessel leakage, and the time to leakage provides a possible measure of vessel staging.
Corneal neovascularization is a common cause of severe visual dysfunction because of its associated edema, scarring, and lipid deposition. It also interrupts the immune privilege of the cornea, and several lines of evidence show that preoperative corneal neovascularization increases the risk of graft rejection after penetrating keratoplasty. Many conditions affecting the cornea are associated with neovascularization, including chemical injury, contact lens overuse, mechanical injury, and infection or inflammation. In addition to controlling the inciting cause, treatment methods for corneal neovascularization include topical steroids, photodynamic therapy, and amniotic membrane grafting. Newer molecular therapeutic strategies aim to manipulate vascular endothelial growth factor activity either in advance of or at the membrane receptor level. or further downstream in the cytosol. In addition, the role and manipulation of proangiogenic mediators in the cornea, such as interleukin 6, as well as products of the mitochondrial cytochrome oxidase pathways have been under investigation.
Conventional methods to document change in corneal neovascularization have used hand drawings or computer-assisted color image analysis. These methods may be limited by inadequate vessel delineation on color imaging or by the subjective impression of the illustrator. Clearly, there is need for an objective clinical tool to measure and quantify changes in corneal neovascularization in response to treatment. Recently, we have shown that fluorescein angiography (FA) and indocyanine green angiography (ICGA), in conjunction with objective computer-assisted image analysis, provide a reliable method for this purpose. Although FA has been used to image corneal neovascularization by other investigators, there is limited published use of ICGA in this context. In this study, we present an application of FA, ICGA, and color imaging to patients with active keratitis and associated neovascularization to analyze and compare changes after treatment in terms of vessel area, diameter, tortuosity, and leakage.
Methods
Protocol
A prospective, interventional, consecutive case series was performed on patients with corneal neovascularization associated with clinically active microbial keratitis evident on slit-lamp biomicroscopy. A comparison of neovascularization was undertaken before initiation of treatment and following a sustained clinical response. A clinical response was defined as either a reduction in inflammation (reduction in corneal edema and or infiltrate) or healing of the ulceration. The area of corneal neovascularization associated with the active keratitis was defined using slit-lamp biomicroscopy as the region of interest. Because of differences in the delineation of corneal neovascularization using color imaging, compared with FA or ICGA, the size of the region of interest differed between these imaging methods. Patients were excluded if they had an allergy to shellfish, iodides, or fluorescein.
Color Imaging
Acquisition of color images for each patient was performed using a standard slit-lamp–mounted digital camera system (Topcon SL-D Digital Slit Lamp; Topcon, Tokyo, Japan). A 10× magnification image was taken including the region of interest using a 45-degree angled beam of white light projected through a diffuser filter with a variable flash intensity. The same region of interest was photographed at baseline initiation of treatment and at follow-up. The region of interest that encompassed the neovascularization was identified on the selected baseline images for color imaging, FA, and ICGA. The baseline and follow-up images were overlapped, and the same sized region of interest then was used in the follow-up images centered and was aligned on the most prominent vessel, trying to keep image magnification the same. A total of 24 color images were obtained (12 at baseline and 12 at follow-up).
Indocyanine Green and Fluorescein Angiography
The HRA2 Scanning Laser Ophthalmoscope (Heidelberg Engineering, Heidelberg, Germany) was used to generate digital FA and ICGA images of the corneal neovascularization in the region of interest. A 5-mL bolus of indocyanine green (Pulsion Medical Systems, Munich, Germany) at a concentration of 5 mg/mL was injected into a peripheral vein of each patient, and region of interest images were captured with automatic real-time software every 3 to 5 seconds for approximately 3 minutes thereafter. A similar region of interest image capture method was used after a subsequent 3-mL intravenous injection of 20% sodium fluorescein (Martindale Pharmaceuticals, Romford, Essex, United Kingdom). Late-frame FA and ICGA images also were obtained at 5 and 10 minutes.
Analysis of Images
The best-quality images were selected for analysis based on our previously published subjective grading system. The baseline (initiation of treatment) images and the follow-up (clinical resolution) images were exported in TIFF format from the image capture systems, respectively (eg, color fundus images from TOPCON iBase and angiography images from Heidelberg Eye Explorer). An in-house semiautomated computer program was used to detect and assess the corneal neovascularization parameters, including the total area, vessel diameters, and tortuosity, in each image of the region of interest. The program was developed using Matlab R14 (The Mathworks, Inc, Natick, Massachusetts, USA), and the technique was described and validated elsewhere. In brief, a subimage of the region of interest was processed to detect the vessels within it based on a selective filter that highlights linear structures such as blood vessels. After vessel detection, a further geometrical analysis was performed to compute the total area, vessel diameter, and tortuosity. This has been described in detail in our previous work, which demonstrates that this method can assist users to measure and characterize corneal vessels accurately on angiography with good interobserver and intraobserver repeatability and reasonable time efficiency.
Statistical Analysis
A 2-tailed paired Student t test was used to test for differences in mean neovascular parameters (diameter, tortuosity) across the region of interest between baseline and follow-up in each patient and for differences in mean neovascular area, variance, and fluorescein leakage times at baseline and follow-up for the entire patient group. P values less than .05 were considered significant.
Results
Patients
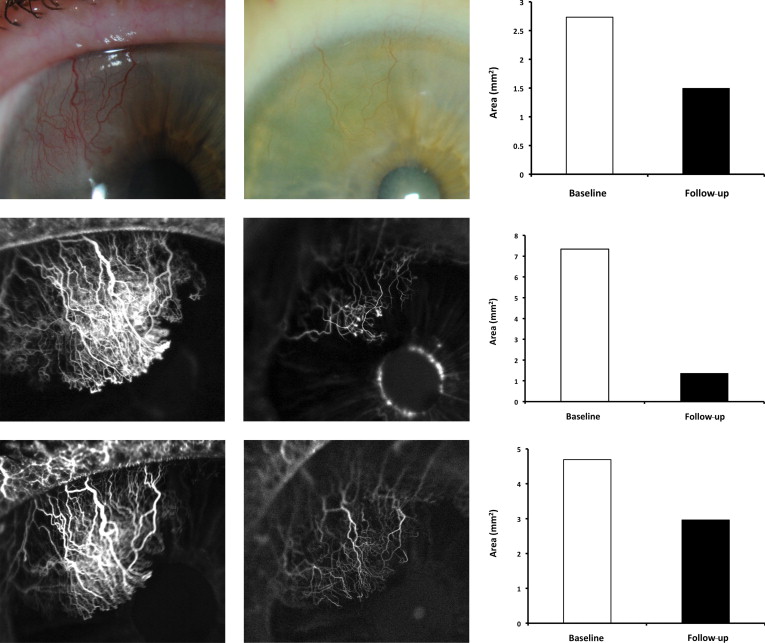
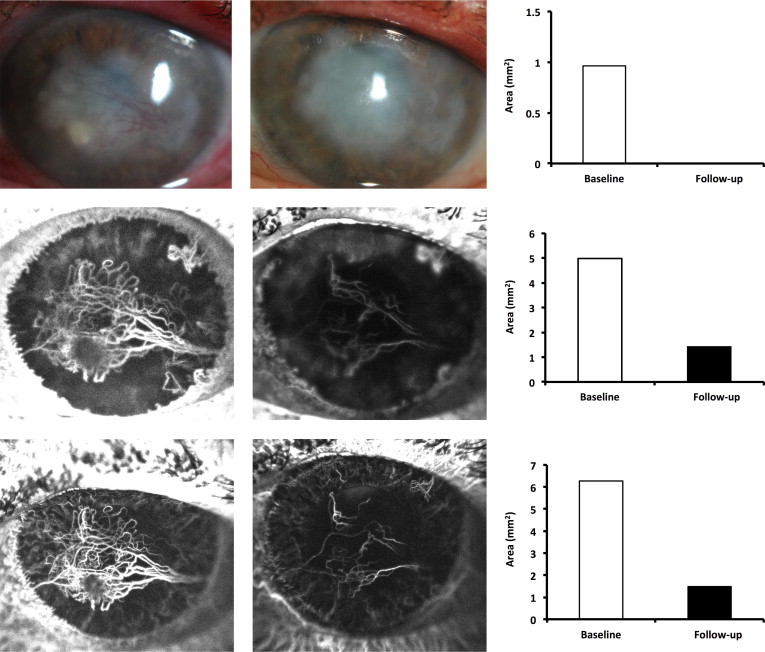
Twelve patients with corneal neovascularization associated with active keratitis between 35 to 74 years of age were included ( Table 1 ). The neovascularization was associated with herpes simplex keratitis (HSK) in 5 patients, with bacterial keratitis in 5 patients, and with presumed HSK after penetrating keratoplasty in 2 patients. Follow-up periods (time between baseline and follow-up imaging) ranged from 1 to 7 months (mean, 2.75 months). Clinical summaries of 2 illustrative patients are outlined below ( Figures 1-4 ).
| Patient | Age (y) | Sex | Diagnosis | Keratitis Depth | Keratitis Position | Treatment | Follow-up (mos) |
|---|---|---|---|---|---|---|---|
| 1 | 35 | F | HSK | S | P | AV & ST | 6 |
| 2 | 43 | M | PKP (HSK) | S | P & I | ST | 4 |
| 3 | 68 | F | HSK | S | P | AV & ST | 3 |
| 4 | 68 | M | HSK | S | P | ST | 5 |
| 5 | 57 | M | PKP (HSK) | S | P & I | AV & ST | 1 |
| 6 | 54 | F | BK | E & S | P | AM & ST | 1 |
| 7 | 43 | F | BK | E & S | C | AM & ST | 1 |
| 8 | 48 | M | BK | E & S | PA | AM & ST | 7 |
| 9 | 51 | M | HSK | S | C | AV & ST | 1 |
| 10 | 44 | F | BK | E & S | P | AM & ST | 1 |
| 11 | 74 | M | BK | E & S | C | AM & ST | 2 |
| 12 | 45 | M | HSK | S | P | AV & ST | 1 |
Analysis of Images
Area of corneal neovascularization
There was a significant reduction in the mean area of corneal neovascularization after initiation of treatment, which was much more apparent with FA and ICGA than on color images (mean reduction in area of CNV: FA, 2.33 mm 2 [ P < .01]; ICGA, 2.07 mm 2 [ P < .01]; color imaging, 0.78 mm 2 [ P < .05]; Table 2 ).
| Patient No. | Time Point | Area of Corneal Neovascularization (mm 2 ) | Time to Leakage (s) | ||
|---|---|---|---|---|---|
| ICGA | Color Imaging | FA | |||
| 1 | Baseline | 1.5 | 0.2 | 2.0 | 30.4 |
| Follow-up | 1.0 | 0.4 | 1.4 | 31.8 | |
| 2 | Baseline | 2.1 | 0.3 | 2.4 | 35.4 |
| Follow-up | 1.3 | 1.1 | 1.6 | 34.0 | |
| 3 | Baseline | 4.7 | 2.7 | 7.3 | 28.6 |
| Follow-up | 3.0 | 1.5 | 1.4 | 31.8 | |
| 4 | Baseline | 1.3 | 1.4 | 1.2 | 48.3 |
| Follow-up | 1.2 | 0.9 | 1.2 | 52.0 | |
| 5 | Baseline | 1.3 | 0.5 | 3.6 | 35.8 |
| Follow-up | 0.6 | 0.5 | 2.5 | 45.6 | |
| 6 | Baseline | 4.6 | 3.3 | 2.2 | 34.0 |
| Follow-up | 1.6 | 1.5 | 2.1 | 40.8 | |
| 7 | Baseline | 4.0 | N/A | 5.5 | 31.6 |
| Follow-up | 3.3 | 0.9 | 3.8 | 54.2 | |
| 8 | Baseline | 5.0 | 3.7 | 5.4 | 35.1 |
| Follow-up | 1.6 | 1.4 | 3.3 | 45.7 | |
| 9 | Baseline | 9.8 | 1.0 | 11.6 | 31.7 |
| Follow-up | 4.0 | 1.1 | 4.5 | 32.6 | |
| 10 | Baseline | 1.9 | 0.6 | 2.9 | 41.8 |
| Follow-up | 0.6 | NV | 0.5 | 102.0 | |
| 11 | Baseline | 6.3 | 1.0 | 5.0 | 64.0 |
| Follow-up | 1.5 | NV | 1.4 | 83.0 | |
| 12 | Baseline | 2.7 | 2.4 | 2.3 | 33.5 |
| Follow-up | NV | NV | NV | NV | |
| Mean | Baseline | 3.78 | 1.55 | 4.30 | 38.07 |
| Follow-up | 1.71 a | 0.77 a | 1.97 a | 50.48 a | |
| Reduction | 2.07 | 0.78 | 2.33 | 12.41 | |
a Statistically significant difference between baseline and follow-up: P < .05.
Fluorescein dye leakage from corneal neovascularization
Table 2 includes the time (seconds) to first detection of FA dye leakage for each of the 12 patients at baseline and at follow-up. There was a significant overall increase in time to first appearance of dye leakage (12.41 seconds; P < .05) at follow-up compared with baseline.
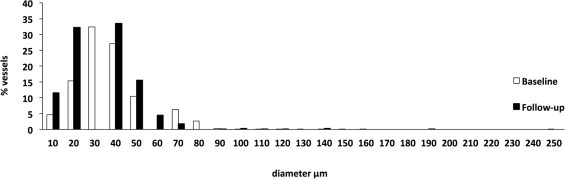
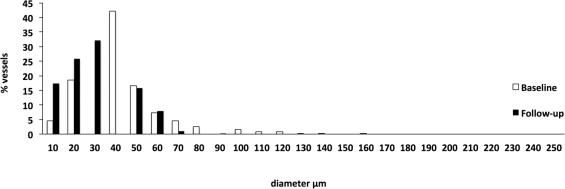
Corneal neovascular vessel diameter
The spread of vessel diameters across the region of interest changed after treatment, evident, for example, in the frequency histograms of individual vessel diameters on ICGA shown in Figure 2 (Patient 3), Figure 4 (Patient 11), and Figure 5 (all study patients). The histograms show a shift toward a reduction in the percentage of larger vessels and a relative increase in smaller vessels. There was a significant reduction in mean vessel diameter across the region of interest after treatment for each patient, more marked on FA and ICGA than on color image analysis, that is, 29.10 to 25.17 μm (ratio, 1.16; P < .01) for color, 42.74 to 32.52 μm (ratio, 1.31; P < .01) for FA, and 44.77 to 33.29 μm (ratio, 1.34; P < .01) for ICGA ( Table 3 ). There was a significant reduction in the spread (variance) of vessel diameters from baseline to follow-up across the regions of interest on ICGA (range, 0.42 to 0.21; P < .05), but not on color imaging (range, 0.22 to 0.15; P = .15) or FA (range, 0.55 to 0.32; P = .14). For 2 patients, corneal neovascularization that was not apparent in the region of interest at follow-up on color imaging was evident with ICGA. Although FA gave a better delineation of vessels than on color images, vessel diameter was affected by leakage. This was evident in Patients 4, 6, and 7, in whom there was an apparent increase in mean vessel diameter after treatment because of the presence of leakage on the FA image used for analysis.
| Patient No. | Time Point | Color Imaging | FA | ICGA |
|---|---|---|---|---|
| 1 | Baseline | 15.30 | 77.94 | 71.25 |
| Follow-up | 12.13 a | 39.00 a | 35.26 a | |
| 2 | Baseline | 24.68 | 41.08 | 37.51 |
| Follow-up | 29.02 a | 25.28 a | 31.58 a | |
| 3 | Baseline | 29.80 | 38.18 | 39.66 |
| Follow-up | 25.16 a | 26.48 a | 35.77 a | |
| 4 | Baseline | 39.50 | 57.87 | 63.35 |
| Follow-up | 32.89 a | 58.75 | 56.85 a | |
| 5 | Baseline | 18.97 | 30.04 | 27.25 |
| Follow-up | NV | 29.94 | 24.41 | |
| 6 | Baseline | 25.83 | 26.75 | 55.68 |
| Follow-up | 23.31 a | 27.97 a | 32.06 a | |
| 7 | Baseline | N/A | 34.63 | 42.03 |
| Follow-up | 26.90 | 43.63 a | 33.86 a | |
| 8 | Baseline | 30.73 | 66.11 | 68.43 |
| Follow-up | 33.51 a | 35.51 a | 33.19 a | |
| 9 | Baseline | 23.59 | 63.50 | 58.76 |
| Follow-up | 26.76 a | 29.20 a | 34.54 a | |
| 10 | Baseline | 28.51 | 61.17 | 68.43 |
| Follow-up | NV | 31.17 a | 28.28 a | |
| 11 | Baseline | 12.67 | 30.48 | 46.04 |
| Follow-up | NV | 32.23 | 32.04 a | |
| 12 | Baseline | 28.34 | 35.62 | 36.14 |
| Follow-up | NV | NV | 29.94 a | |
| Mean | Baseline | 29.10 | 42.74 | 44.77 |
| Follow-up | 25.17 a | 32.52 a | 33.29 a |
Stay updated, free articles. Join our Telegram channel

Full access? Get Clinical Tree


