Purpose
To evaluate retinal pigment epithelial (RPE) atrophy in patients with Stargardt disease using autofluorescence imaging (AF).
Design
Retrospective observational case series.
Methods
Demographics, best-corrected visual acuity (BCVA), AF images, and electrophysiology responses (group 1, macular dysfunction; group 2, macula + cone dysfunction; group 3, macula + cone-rod dysfunction) were evaluated at presentation and follow-up in a group of 12 patients (24 eyes) with Stargardt disease. The existence, development, and rate of enlargement of areas of RPE atrophy over time were evaluated using AF imaging. A linear regression model was used to investigate the effects of AF and electrophysiology on rate of atrophy enlargement and BCVA, adjusting for age of onset and duration of disease.
Results
Eight male and 4 female patients (median age 42 years; range 24−69 years) were followed for a median of 41.5 months (range 13−66 months). All 12 patients had reduced AF compatible with RPE atrophy at presentation and in all patients the atrophy enlarged during follow-up. The mean rate of atrophy enlargement for all patients was 1.58 mm 2 /y (SD 1.25 mm 2 /y; range 0.13−5.27 mm 2 /y). Only the pattern of functional loss present as detected by electrophysiology was statistically significantly associated with the rate of atrophy enlargement when correcting for other variables ( P < .001), with patients in group 3 (macula + cone-rod dysfunction) having the fastest rate of atrophy enlargement (1.97 mm 2 /y, SD 0.70 mm 2 /y) (group 1 [macula] 1.09 mm 2 /y, SD 0.53 mm 2 /y; group 2 [macula + cone] 1.89 mm 2 /y, SD 2.27 mm 2 /y).
Conclusion
Variable rates of atrophy enlargement were observed in patients with Stargardt disease. The pattern of functional loss detected on electrophysiology was strongly associated with the rate of atrophy enlargement over time, thus serving as the best prognostic indicator for patients with this inherited retinal disease.
Stargardt disease (also termed fundus flavimaculatus), the most common form of recessively inherited macular dystrophy, is caused by mutations in the ABCA4 gene, located in the short arm of chromosome 1. Stargardt disease affects individuals of any sex, race, and age. Visual acuity, fundus appearance, and severity of the disease varies widely among patients. Typically, fundus flecks and atrophy at the macula and midperipheral retina are observed, with a variable degree of functional loss including macular dysfunction, alone or with additional loss of peripheral cone or cone and rod function.
Fundus autofluorescence (AF) has emerged as the most useful noninvasive imaging tool for the evaluation of patients with Stargardt disease. By means of AF imaging both active and resorbed flecks can be clearly visualized and appear as foci of very high or low AF signal, respectively. Areas of retinal pigment epithelial (RPE) atrophy can be also identified as areas of very low AF signal at the macula and midperipheral retina, the latter commonly associated with reduced peripheral cone and rod function and, thus, with a poorer visual prognosis. Fundus AF imaging can also be used to monitor the progression of the disease by demonstrating the development or disappearance of areas of increased AF, the expansion of preexisting areas of reduced AF (RPE atrophy), or the occurrence of new ones.
The purpose of the current research was to evaluate, by means of AF imaging, the progression of RPE atrophy over time in a group of patients with Stargardt disease, and variables that may affect it.
Patients and Methods
Patients with Stargardt disease seen in the medical retina service between July 28, 2004 and August 30, 2010, with a minimum follow-up of 1 year, and in whom serial AF imaging had been obtained during the follow-up were considered eligible for this study. The diagnosis of Stargardt disease was made following previously established criteria based on the presence of: 1) retinal pigment epithelial changes and/or a bull’s-eye appearance and/or macular atrophy and 2) fundus flecks, and 3) a familial pattern compatible with recessive inheritance. Twelve patients fulfilled these criteria and thus were included in this study. Of the 8 patients excluded, 5 did not have follow-up AF imaging and the diagnosis remained undetermined in 3 patients (members of 1 family) in whom the pattern of inheritance was not compatible with a recessive disease.
All patients had undergone visual acuity (VA) testing, electrophysiology testing, and AF imaging as part of their routine clinical care. Distance and reading VA were measured using Snellen and Bailey-Lovie visual acuity charts, respectively. Snellen values were converted into logMAR for statistical purposes. Pattern electroretinogram (PERG) and full-field electroretinogram (ERG) were conducted following International Standards of Clinical Electrophysiology in Vision (ISCEV) and using gold foil electrodes. Based on electrophysiology findings at baseline, patients were classified as having group 1 (reduced PERG but normal full-field ERG), group 2 (reduced PERG and reduced photopic responses with normal scotopic responses in the full-field ERG), or group 3 (reduced PERG and scotopic and photopic responses in the full-field ERG) patterns of visual loss. In 3 patients, repeated electrophysiological testing was performed at follow-up (median 4 years; range 2−5 years).
AF images were undertaken with the Heidelberg retina angiograph 2 (HRA2; Haag-Streit, Harlow, UK). The HRA confocal scanning laser ophthalmoscope (cSLO) uses a 488-nm laser for AF.
The existence and development of areas of atrophy was determined by the presence or appearance, respectively, of a circular area(s) of low AF signal; only those areas ≥0.05 mm 2 in size were considered. The rate of atrophy enlargement was estimated as follows. Unifocal or multifocal areas of low AF signal were measured by outlining them using the image analysis software (measure region overlay tool; Heidelberg Eye Explorer, HRA2, Haag-Streit). Using this tool, pixels are automatically converted into millimeters, taking into account the original image resolution (768 × 768 pixels) and the focusing during image acquisition. Overall progression of atrophy per year was calculated as follows: size of the area of low AF signal at last visit (mm 2 ) – size of the area of low AF signal at first visit (mm 2 )/months × 12. For patients with more than 2 AF images, the rate of atrophy enlargement between visits was calculated in a similar way, dividing by the number of months between such visits. In cases of multiple areas of low AF signal present, the average rate of enlargement for all existing areas greater than or equal to 0.05 mm 2 was estimated. In addition, AF images were also qualitatively evaluated. More specifically, foci of increased AF signal, areas of subsequent development of de novo atrophy, and the pattern of atrophy enlargement were evaluated. Lastly, the following data were obtained for each patient: age of the patient at baseline, age at onset of the disease, duration of the disease, and visual acuity. Distance and reading VA were measured using Snellen and Bailey-Lovie visual acuity charts, respectively; then they were converted into logMAR for statistical purposes.
The relationship between rate of atrophy enlargement in the 2 eyes of a patient was tested using Spearman rank correlation. The effects of the pattern of background AF and the pattern of functional loss (group 1 = macular dysfunction alone; group 2 = macular and peripheral cone dysfunction; group 3 = macular and peripheral cone and rod dysfunction) on the rate of atrophy enlargement and distance visual acuity were investigated using linear regression, adjusting for age of onset and duration of disease and using a clustered sandwich variance estimator to allow for correlation between the 2 eyes of individual patients. Response variables (rate of atrophy enlargement and distance VA) were log transformed prior to analysis to meet the distribution requirements of linear regression. Seven patients had more than 2 AF images. Mixed-effects linear regression with random slopes and intercepts was used to test whether the rate of atrophy enlargement within individual eyes stayed constant or changed over time. The association between AF type and electrophysiology group was tested using Goodman-Kruskal Gamma, a measure of association for ordered categories ranging between −1 and +1 for perfect negative or positive association respectively.
Results
There were 8 women and 4 men with a median age of 42 years (range 24−69 years), who were followed for a median of 41.5 months (range 13−66 months). The median age at disease onset was 20 years (range 7−46 years) and the median duration of disease was 22 years (range 1−48 years). All 12 patients (24/24 eyes) had low AF signal compatible with atrophy at presentation. In all patients (24/24 eyes) the preexisting areas of atrophy enlarged during follow-up. In addition, 8 of 12 patients developed de novo areas of atrophy at follow-up (16/24 eyes, all with a heterogeneous AF pattern; see below); 4 of 12 patients did not develop further areas of atrophy (8/24 eyes, all with homogeneous AF pattern; see below). Variable rates of atrophy enlargement were observed ( Table 1 ), between 0.13 and 5.27 mm 2 /y. The mean rate of atrophy enlargement over the whole duration of follow-up for all eyes was 1.58 mm 2 /y (n = 24 eyes; SD 1.25 mm 2 /y).
| Patient | EDT Group a | Autofluorescence Pattern b | Age of Onset (y) | Duration of Disease (y) | Follow-up (mo) | Right Visual Distance Acuity (logMAR) | Left Visual Distance Acuity (logMAR) | Right Visual Near Acuity (logMAR) | Left Visual Near Acuity (logMAR) | Rate of Atrophy Enlargement, OD (mm 2 /y) | Rate of Atrophy Enlargement, OS (mm 2 /y) |
|---|---|---|---|---|---|---|---|---|---|---|---|
| 1 | 2 | 2 | 21 | 20 | 54 | 0.30 | 3.00 | 0.80 | 3.00 | 4.31 | 5.27 |
| 2 | 1 | 1 | 19 | 36 | 46 | 1.00 | 1.00 | 3.00 | 3.00 | 1.27 | 1.04 |
| 3 | 3 | 2 | 36 | 5 | 66 | 1.34 | 1.00 | 1.40 | 1.40 | 2.82 | 2.71 |
| 4 | 3 | 2 | 25 | 22 | 25 | 2.00 | 2.00 | 1.20 | 1.20 | 2.71 | 1.19 |
| 5 | 1 | 1 | 7 | 36 | 59 | 1.00 | 1.00 | 0.95 | 0.95 | 0.34 | 0.49 |
| 6 | 2 | 2 | 13 | 11 | 37 | 1.00 | 1.00 | 0.95 | 0.85 | 0.42 | 0.13 |
| 7 | 2 | 1 | 13 | 22 | 48 | 0.90 | 0.80 | 0.70 | 0.70 | 0.66 | 0.54 |
| 8 | 1 | 2 | 46 | 7 | 24 | 1.00 | 0.00 | 3.00 | 0.50 | 1.85 | 1.83 |
| 9 | 1 | 1 | 39 | 1 | 13 | 0.20 | 0.00 | 0.40 | 0.40 | 0.87 | 0.57 |
| 10 | 3 | 2 | 9 | 31 | 60 | 1.50 | 1.50 | 1.50 | 1.50 | 2.05 | 1.26 |
| 11 | 1 | 2 | 21 | 48 | 13 | 1.34 | 1.10 | 1.30 | 1.30 | 1.26 | 1.39 |
| 12 | 3 | 2 | 15 | 32 | 18 | 1.00 | 1.00 | 1.60 | 1.60 | 1.64 | 1.35 |
a 1 = macular dysfunction; 2 = macular + cone dysfunction; 3 = macular + cone-rod dysfunction.
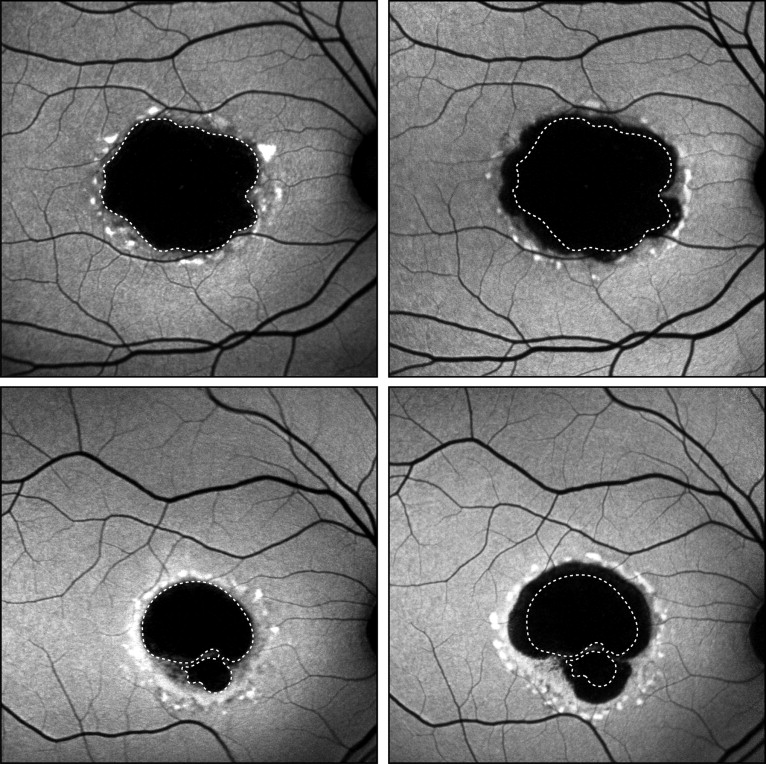
The rate of atrophy enlargement in 1 eye over the duration of the study was strongly correlated with the rate in the other (Spearman rho = 0.846, P < .001). There was also absolute concordance on electrophysiology group and pattern of background AF between eyes in the same patient. On average, there was a slight increase in the rate of atrophy enlargement over time in eyes with more than 2 AF images ( P = .023). The rate of atrophy enlargement increased by an average of 0.016 mm 2 /y for each month of follow-up. Electrophysiology group was statistically significantly associated with the rate of atrophy enlargement over the duration of the study (adjusted for age at onset and duration of disease) ( P < .001). The rate of atrophy enlargement for each phenotype of Stargardt disease based on electrophysiological evaluation was: group 1, 1.09 mm 2 /y (n = 10 eyes; SD 0.53 mm 2 /y); group 2, 1.89 mm 2 /y (n = 6 eyes; SD 2.27 mm 2 /y); and group 3, 1.97 mm 2 /y (n = 8 eyes; SD 0.70 mm 2 /y) ( Table 2 ). The eyes of patients with Stargardt disease were also categorized into 2 groups based on the distribution of AF in the background. Thus, eyes with an even distribution of AF in the background were considered to have a “homogeneous” pattern of background AF ( Figure 1 ) , whereas those with widespread small foci of increased and reduced background AF were classified as having a “heterogeneous” pattern of background AF ( Figure 2 ) . The rate of atrophy enlargement in eyes with the “homogeneous” AF pattern was 0.72 mm 2 /y (n = 8 eyes; SD 0.31 mm 2 /y; Figure 1 ), whereas those with a “heterogeneous” pattern of AF was 2.01 mm 2 /y (n = 16 eyes; SD 1.33 mm 2 /y; Figure 2 ) ( Table 2 ). However, the effect of AF type on the rate of atrophy enlargement over the duration of the study (adjusted for age at onset and duration of disease) was not statistically significant ( P = .060).
| Rate of Atrophy Enlargement (mm 2 /y) | SD (mm 2 /y) | Patients (n) | |
|---|---|---|---|
| EDT a | |||
| STGD group 1 | 1.09 | 0.53 | 5 |
| STGD group 2 | 1.89 | 2.27 | 3 |
| STGD group 3 | 1.97 | 0.70 | 4 |
| AF | |||
| Homogeneous | 0.72 | 0.31 | 4 |
| Heterogeneous | 2.01 | 1.33 | 8 |
a Group 1 = macular dysfunction; group 2 = macular + cone dysfunction; group 3 = macular + cone-rod dysfunction.
Stay updated, free articles. Join our Telegram channel

Full access? Get Clinical Tree


