Purpose
To report and compare visual and glaucoma outcomes in primary congenital glaucoma (PCG) vs glaucoma following congenital cataract surgery (GFCS).
Design
Retrospective, observational, comparative case series.
Methods
Setting : Emory Eye Center, Atlanta, Georgia. Study Population : Pediatric glaucoma patients (age 0-18 years) treated at Emory by 1 clinician with ≥2-year follow-up. Glaucoma was defined according to the 9th Consensus Report of the World Glaucoma Association. Main Outcome Measures : Snellen-equivalent logMAR visual acuity (VA) and glaucoma control (IOP ≤21, no devastating complications, no recommendation for further glaucoma surgery). Asymptotic Wilcoxon-Mann-Whitney rank sum tests were employed to compare glaucoma subgroups.
Results
Included were 72 PCG and 56 GFCS cases, with mean follow-up time of 7.4 ± 4.1 and 8.0 ± 3.8 years, respectively. At last follow-up, PCG showed better median VA than GFCS in worse-seeing eyes (20/60 [interquartile range (IQR) 20/30-20/200] vs 20/400 [IQR 20/70-hand motion], respectively, P < .0001) and in better-seeing eyes of bilaterally-affected children (20/30 [IQR 20/20-20/60] vs 20/70 [IQR 20/35-20/100], respectively, P = .024).The following variables characterized the PCG and GFCS groups’ glaucoma status, respectively: mean age at diagnosis (years), 0.70 ± 1.3 vs 3.3 ± 3.5 ( P < .0001); median IOP (mm Hg), 15.50 [IQR 12.1-19.4] vs 17.50 [IQR 14.9-22], P = .037; median number of glaucoma medications at last follow-up, 1.49 [IQR 0-2] vs 2.54 [IQR 1-4], P < .0001; median number of glaucoma surgeries, 1.0 [IQR 1-2] vs 1.25 [IQR 0.5-2.0], P = .09.
Conclusions
Children with PCG (vs those with GFCS) presented earlier, had better vision, required fewer medications to control disease, and had lower IOP at last follow-up.
Glaucoma is an uncommon ocular disease in children and has a wide range of etiologies. Primary congenital glaucoma (PCG) involves an inherited developmental abnormality of the trabecular meshwork and anterior chamber angle and is most often diagnosed in infancy. Secondary glaucoma, such as glaucoma following congenital cataract surgery (GFCS, formerly known as aphakic or pseudophakic glaucoma), is an acquired blockage of aqueous outflow associated with systemic or other ocular disease. Of the many types of childhood glaucoma, PCG and GFCS are most commonly encountered in clinical practice.
Childhood glaucoma can cause loss of vision from a variety of mechanisms, including direct optic nerve damage, corneal stretching or scarring, high refractive errors, and buphthalmos itself in extreme cases. Vision loss may also result from amblyopia, especially in cases where glaucoma is unilateral, or where it is bilateral but asymmetric in severity. Visual prognosis for these patients is dependent on factors such as timing of initial disease presentation, degree of optic nerve damage, degree of corneal damage, initial surgical/medical interventions, degree of amblyopia, and progressive refractive error. Though angle surgery—goniotomy or trabeculotomy—is almost universally the first-line treatment for PCG, GFCS is primarily managed with medications and only more serious cases require surgery.
Though many studies have examined PCG and GFCS individually, and others have compared PCG to secondary forms of childhood glaucoma, little direct comparison has been made with regard to the visual and overall outcomes of these 2 relatively common types of childhood glaucoma. Therefore, the aim of the current study is to compare clinical outcomes between children with PCG and those with GFCS with regard to visual outcomes, glaucoma control, disease complications, and management requirements.
Methods
Study Population
This was a single-institution retrospective study involving children with PCG and GFCS who were treated at the Emory Eye Center from 1983 to 2015 by 1 clinician with ≥2-year follow-up. The study was approved by the Institutional Review Board of Emory University. Childhood glaucoma was defined according to the 9th Consensus Report of the World Glaucoma Association ( Table 1 ). Patients were considered to have PCG if they presented in infancy or early childhood with intraocular pressure (IOP) >21 mm Hg and signs of IOP-driven ocular anatomic changes in the absence of other ocular or systemic defects. Pediatric patients who developed glaucoma following cataract extraction (absent other causes of glaucoma) were considered to have GFCS. Children diagnosed with glaucoma at Emory University Eye Center, or referred from another provider for their glaucoma, were included in the study if their glaucoma treatment was provided by the glaucoma services at Emory. Patients treated for glaucoma at Emory were identified using financial claims data (our search employed the following ICD-9 codes: 743.20, 743.21, 365.1 with 379.331 or V43.10, 365.23 or 365.24 with 379.31 or V43.10). Patients identified through this search were screened for eligibility, and all records of patients identified as eligible were then reviewed to include all available data on identified patients. Excluded from the study were patients diagnosed with glaucoma attributable to an etiology other than PCG or GFCS, patients >18 years old at glaucoma diagnosis, patients with <2 years of follow-up, and patients with a non-glaucoma ocular comorbidity other than congenital cataract predating their glaucoma diagnosis, which had the potential to significantly affect visual outcome.
| Definition | Criteria |
|---|---|
| Pediatric glaucoma | Eye has ≥2 of the following features:
|
| Glaucoma control | IOP ≤21 mm Hg in the absence of a devastating complication or further pressure-lowering ocular surgery performed or recommended in the affected eye |
| Devastating complication | Included:
|
Data Collection
Clinical information was collected using a database created with the software OpenClinica (OpenClinica, Waltham, Massachusetts). Data recorded from clinical records included the following: child’s sex, ethnicity, age at both cataract diagnosis and removal (for GFCS group), age at glaucoma presentation, laterality of glaucoma, all ophthalmic diagnoses, and visual acuity and ocular parameters at glaucoma diagnosis including IOP (median of recorded values), corneal diameter and corneal status, optic nerve status (cup-to-disc ratio: mean taken when horizontal and vertical dimensions recorded), and axial length. These features were regularly gathered in a standard fashion at initial examination by a single provider (A.D.B.). The following parameters were recorded annually or as available in the clinical record until the last follow-up: glaucoma medications used (number and type), glaucoma and other ophthalmic surgical procedures performed, surgical complications, IOP, anterior segment ocular features such as corneal status (Haab striae, central vs peripheral opacity, diameter), lens status, refractive error (when available, cycloplegic refraction data were taken from pediatric ophthalmology notes dated from the same month as the child’s glaucoma visit), axial length, optic nerve status, visual field data (when reliable visual field data were available: Goldmann and Humphrey perimeters), and central corneal thickness (measured via pachymetry: DGH 500; Pachette, Exton, Pennsylvania, USA). To determine factors other than glaucoma that likely contributed to poorer visual acuity outcomes, records were specifically reviewed for the presence of strabismus, amblyopia, and nystagmus.
Outcome Measures
The primary outcome—best-corrected visual acuity (VA) at last follow-up—was recorded at patient presentation and yearly thereafter, including testing method and refractive error. When possible, VA was taken from pediatric rather than from glaucoma ophthalmology visit notes. When children were unable to perform optotype VA (Snellen/Allen/HOTV), qualitative measures (eg, central, steady, and maintained fixation) were recorded but not used for the statistical analysis. VA was converted to logMAR for statistical analyses, and non-optotype visual acuities were converted to logMAR using the following values: 1.9 = count fingers (CF), 2.3 = hand motion (HM), 2.7 = light perception (LP), 3 = no light perception (NLP). Snellen VA was stratified into the following categories: ≥20/50, <20/50 to >20/200, and ≤20/200. When visual acuity was compared between glaucoma subgroups of PCG vs GFCS, logMAR VA of the worse-seeing eye was used. Visual acuity of the better-seeing eye was also analyzed in bilaterally affected children in both glaucoma subgroups to allow for inference of functional outcomes in patients from each cohort.
IOP was recorded at presentation and at yearly follow-up for each patient, as was the tonometry method used to obtain IOP (Perkins [Two M Ophthotronics, Gujarat, India], tonopen [Reichert, Depew, New York, USA], Goldmann applanation [Haag-Streit AG, Koeniz, Switzerland], pneumotonometry [Reichert], or Icare [Icare Finland Oy, Helsinki, Finland]). When several IOP measurements were obtained per eye, the median value was recorded. The following analyses were performed for IOP by glaucoma subgroup: IOP at presentation, at last follow-up, and longitudinally over the follow-up period; and difference in IOP between presentation and last follow-up. As in the VA analysis, IOP of the worse-seeing eye was used for children with bilateral glaucoma. Glaucoma control was defined as IOP ≤21 mm Hg in the absence of a devastating complication in the affected eye and the absence of a recommendation for, or performance of, further pressure-lowering ocular surgery ( Table 1 ). Glaucoma control was analyzed by glaucoma subgroup at last follow-up. Glaucoma surgery was routinely recommended for cases where there were documented structural and/or functional changes in the presence of maximal tolerated medical therapy.
For children whose glaucoma diagnoses were made at Emory Eye Center, age at diagnosis was recorded as the child’s age at presentation. For children referred to Emory after being diagnosed or treated by an outside provider, age at diagnosis was determined based on available outside records or correspondence between Emory Eye Center and the referring provider.
Statistical Analyses
Analysis was completed with R version 3.2.2 (R Foundation for Statistical Computing, Vienna, Austria). Data were summarized using the median and interquartile range (IQR). Values in the PCG and GFCS groups were compared using the Mann-Whitney U test for continuous variables and with the χ 2 or Fisher exact test, as appropriate, for categorical variables. Exploratory linear regression models were used to predict the VA at last follow-up in the worse-seeing eye considering type of glaucoma, IOP at last follow-up, average number of medications, and average number of intraocular surgeries. Logistic regression models were also used to predict the outcome of requiring more than 1 glaucoma procedure, considering type of glaucoma, age, corneal opacity, and IOP at presentation as predictors. Final models presented are based on backward variable selection using Akaike’s information criterion. Significance for all analyses was set at .05.
Results
We reviewed the clinical records of 291 patients: 128 of these met study criteria. Included were 138 eyes of 72 children with PCG and 82 eyes of 56 children with GFCS, with mean follow-up time of 7.4 ± 4.1 and 8.0 ± 3.8 years, respectively. Of the 128 patients, 37 (29%) were diagnosed with and treated for glaucoma at an outside facility before being referred to Emory. Demographics of this study population are shown in Table 2 . Mean age at diagnosis was younger in the PCG cohort than in the GFCS cohort (0.70 ± 1.3 years vs 3.3 ± 3.5 years, P < .0001). Bilateral glaucoma occurred more commonly in the PCG than in the GFCS cohort (92% vs 46%, P < .0001).
| Clinical Characteristic | PCG Group | GFCS Group |
|---|---|---|
| Patients, n | 72 | 56 |
| Affected eyes, n | 138 | 82 |
| Male, n (%) | 39 (54.2%) | 27 (48.2%) |
| Unilateral cases, n (%) a | 6 (8.3%) a | 30 (53.4%) a |
| Mean age at diagnosis, y a | 0.70 ± 1.3 a | 3.3 ± 3.5 a |
| Mean follow-up, y ± SD | 7.4 ± 4.1 | 8.0 ± 3.8 |
a Significant P value ( P < .05) for the given glaucoma characteristic being considered.
Visual Acuity
Optotype VA in at least 1 eye was obtained at last follow-up in 61 of 72 PCG subjects (85%) and 40 of 56 GFCS subjects (71%), and 62 PCG subjects (86%) and 50 GFCS subjects (89%) had a measurable VA in at least 1 eye during the follow-up period.
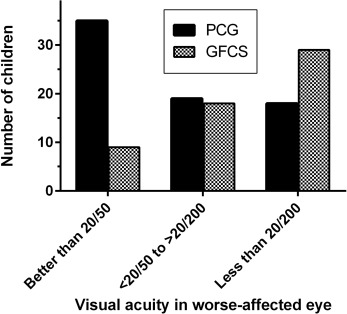
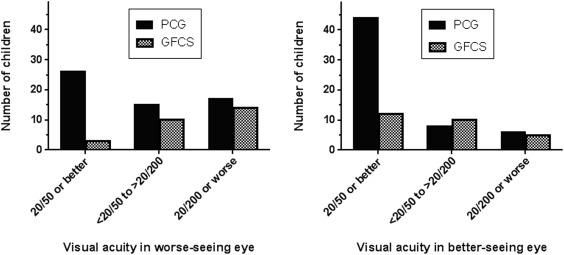
Median VA in the worse-seeing eye at last follow-up was 20/60 (IQR 20/30 to 20/200) in the PCG cohort vs 20/400 (IQR 20/70 to HM) in the GFCS cohort ( P < .0001). Stratification of Snellen VA of the patient’s worse-seeing eye into 20/50 or better (“good” VA), <20/50 to >20/200 (“fair” VA), and 20/200 or worse (“poor” VA), demonstrated more PCG eyes in the good VA group and more GFCS eyes in the poor VA group ( P < .001; Figure 1 ). When worse-seeing eyes of only bilaterally affected children were examined, median VA at last follow-up was similar in the PCG cohort (20/65 [IQR 20/30 to 20/300]) and improved in the GFCS cohort (20/250 [IQR 20/75 to LP]; P < .0001) compared with the analysis including both unilaterally and bilaterally affected children, and breakdown of VA by acuity groups was similar ( P = .0087; Figure 2 , Left). In an analysis of the better-seeing eye of only bilaterally affected children, median VA at last follow-up was 20/30 (IQR 20/20 to 20/60) in the PCG cohort vs 20/70 (IQR 20/35 to 20/100) in the GFCS cohort ( P = .024), and breakdown of VA by acuity groups showed more PCG than GFCS eyes in the good VA group ( P = .015; Figure 2 , Right). Within the GFCS cohort, difference in VA of the worse-seeing eye at last follow-up between unilaterally vs bilaterally affected subjects was not significant (median VA 20/400 [IQR 20/62 to CF] vs 20/250 [IQR 20/74 to LP], P = .28).
The following clinical features of glaucoma were significantly associated with the subjects’ VA in the worse-seeing eye at last follow-up ( Table 3 ): IOP at last follow-up (odds ratio [OR] 0.64 per logMAR unit difference, 95% confidence interval [CI] 0.47-0.86, P = .004), glaucoma type (PCG vs GFCS: OR 1.8, 95% CI 1.3-2.3, P = .005), and number of devastating complications of glaucoma (OR 1.3, 95% CI 1.2-1.4) (skewness = 0.82, kurtosis = −0.6 for dependent variable).
| Glaucoma Characteristic | Change in LogMAR VA | P Value |
|---|---|---|
| Type of glaucoma, GFCS vs PCG | 0.50 | .005 a |
| Age at diagnosis, per year | −0.028 | .32 |
| Number of intraocular surgeries | −0.01 | .68 |
| IOP at diagnosis, per mm | −0.001 | .90 |
| IOP at last follow-up, per mm | −0.45 | .004 a |
| Corneal opacity at presentation | 0.08 | .63 |
| Number of glaucoma medications at last follow-up | 0.05 | .33 |
| Number of devastating complications | 0.21 | <.001 a |
a Significant P value ( P < .05) for the given glaucoma characteristic being considered.
Glaucoma Characteristics
PCG and GFCS cohorts had comparable IOPs at presentation and similar mean IOPs over the entire follow-up period ( Table 4 ). However, the PCG cohort had a significantly lower mean IOP at last follow-up than the GFCS cohort and sustained a greater decrease in IOP between presentation and last follow-up. Mean number of glaucoma medications at last follow-up was lower in eyes with PCG than in eyes with GFCS (1.49 [IQR 0-2] vs 2.54 [IQR 1-4], P < .0001).
| Characteristic | PCG Group Median [IQR] | GFCS Group Median [IQR] | P Value |
|---|---|---|---|
| IOP at presentation (mm Hg) | 27.62 [22.1-34.0] | 25.25 [21, 31.3] | .22 |
| IOP over follow-up period (mm Hg) | 18.75 [16.4, 21.2] | 19.78 [16.8, 22] | .38 |
| IOP at last follow-up (mm Hg) | 15.50 [12.1, 19.4] | 17.50 [14.9, 22] | .037 a |
| ΔIOP (first to last follow-up, mm Hg) | -11.25 [-16.8, -5.5] | -6.63 [-12.0, -0.4] | .014 a |
a Significant P value ( P < .05) for the given glaucoma characteristic being considered.
Glaucoma Surgery
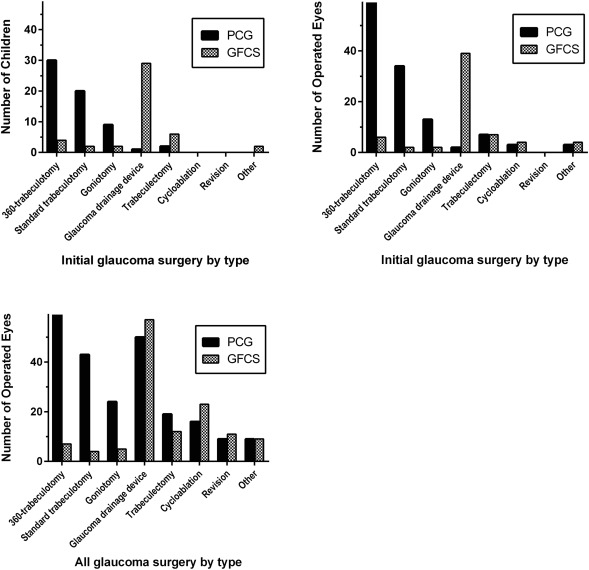
The number of glaucoma surgeries performed on affected eyes in the 2 glaucoma cohorts over the follow-up period was similar (PCG: median 1.0 [IQR 1-2] vs GFCS: 1.25 [IQR 0.5-2.0], P = .09). The PCG cohort underwent fewer intraocular surgeries than the GFCS group (mean 1.69 [IQR 1-2] vs 3.2 [IQR 2-4], P < .0001). Surgery was required in the vast majority of eyes in both cohorts: only 13 PCG eyes (9.4%) and 21 GFCS eyes (25.6%) underwent no glaucoma surgery during the study period.
Considering only the initial glaucoma surgery performed on the first operated eye of a given child (n = 128; Figure 3 , Top left), the most common procedure in the PCG cohort was 360-degree trabeculotomy (30 procedures, 46% of initial glaucoma surgeries), followed by standard trabeculotomy (n = 20, 31%) and goniotomy (n = 9, 14%). In the same analysis, the most common procedures in the GFCS cohort were glaucoma drainage devices (GDDs; n = 29, 62%: Ahmed 16, Baerveldt 11, other 2) and trabeculectomy with mitomycin (n = 6, 13%). Aphakic patients who required a GDD underwent anterior vitrectomy if vitreous was present in the anterior chamber or prolapsed during the procedure. Selected cases where a pars plana approach was required (such as extensive angle closure) received a pars plana vitrectomy performed by a vitreoretinal specialist at the time of the GDD placement. Baerveldt implants were used in older children; Ahmeds were used in younger patients once they became available. Angle surgery was performed as the initial glaucoma procedure in 81.9% of PCG subjects vs 14.3% of GFCS subjects ( P < .0001), whereas GDDs were employed as a first glaucoma procedure in 1.4% of PCG vs 50% of GFCS subjects ( P < .0001). When all operated eyes were included, the distribution of initial glaucoma surgeries was similar to the distribution identified in the first operated eye analysis ( Figure 3 , Top right).