Purpose
To investigate the clinical characteristics of 10-2 visual field defects in subjects with a diagnosis of glaucoma or glaucoma suspicion.
Design
Prospective, observational cohort study.
Methods
From participants enrolled in an ongoing glaucoma research study at our institution, we identified 354 eyes in 180 subjects (97 with primary open-angle glaucoma, 83 with glaucoma suspicion) who had 2 or more reliable 24-2 and 10-2 visual field tests and good-quality spectral-domain optical coherence tomography (SDOCT) scans. Eyes with macular pathology, significant cataract, or nonglaucomatous vision loss were excluded. We applied previously published cluster criteria to define 10-2 visual field loss, and then calculated prevalence, location, severity, and pattern of 10-2 visual field loss as well as its relationships with various functional and structural parameters.
Results
Repeatable 10-2 visual field defects were present in 89 of 180 subjects (49%) and usually exhibited an arcuate or nasal pattern. In eyes with no, mild, moderate, and advanced 24-2 visual field loss, 15 of 236 (6%), 49 of 67 (73%), 25 of 26 (96%), and 25 of 25 (100%) had 10-2 visual field defects, respectively. Of the 114 eyes with 10-2 visual field loss, 93 (82%) demonstrated abnormal points within the central 10 degrees of the 24-2 visual field test. Mean defect on the 10-2 and 24-2 tests was highly correlated (r 2 = 0.72).
Conclusions
Although central VF loss appears to be common in glaucoma and may have an important role in glaucoma management, additional study is warranted to more definitively determine the optimal methods to detect presence, severity, and functional impact of central glaucomatous visual field loss.
Over the past 4 decades, accumulating evidence has shown that central visual dysfunction is a characteristic not just of late stages of glaucoma but also of its earliest stages. Types of central visual dysfunction that have been identified in early stages of glaucoma include color vision defects, abnormalities of contrast sensitivity, and visual field defects within 10 degrees of fixation. Considering that 30% of all retinal ganglion cells serve the central 8 degrees of the macula, and that these cells have been shown to be compromised in early glaucoma, the existence of central visual dysfunction in early glaucoma should not be surprising.
At the present time, however, central visual dysfunction in early stages of glaucoma often goes underappreciated because methods for detecting it are not part of the standard clinical assessment. Particularly, while assessment of later stages of glaucoma often includes visual field testing with a high density of test points within the central 10 degrees, typical visual field assessment of early and moderate glaucoma uses a testing grid that has been shown to substantially undersample the central field. Specifically, the 24-2 grid on the Humphrey Field Analyzer II (Carl Zeiss Meditec Inc, Dublin, California, USA) measures visual function within 8 degrees of fixation with only 4 central test points. Conversely, the 10-2 test pattern on the same instrument measures this central 8 degrees with 44 points. Consequently, central visual field loss in glaucoma can be underestimated and even missed altogether when relying solely on the 24-2 pattern.
Few studies have investigated the prevalence and clinical features of glaucomatous central visual field loss as measured by the 10-2 visual field test. In 1997, Langerhorst and associates prospectively studied 121 subjects diagnosed with glaucoma or glaucoma suspicion and reported that 10-2 field loss was present in 36% of all hemifields, while 12% demonstrated 10-2 field loss without concurrent 30-2 field loss. In 2010, Schiefer and associates identified regions within 30-2 visual field testing that were suspicious for glaucoma, and then further tested those regions with high spatial resolution testing. The high-resolution testing identified central field defects in 50% of eyes with mild to moderate glaucoma. More recently, Traynis and associates prospectively compared the prevalence of 10-2 and 24-2 visual field loss in eyes with early glaucoma and found a similar number of abnormal hemifields with both tests (53% of 10-2 tests vs 59% of 24-2 tests). They also reported that 15.7% had an abnormal 10-2 hemifield result when the 24-2 result was normal, and that superior 10-2 defects were deeper and closer to fixation than inferior 10-2 defects.
These studies suggest that central visual field loss measured by the 10-2 test is a common feature of glaucoma and that these defects may be important to consider within patient management. Before the 10-2 test can be considered for general diagnostic use, however, additional knowledge about the characteristics of 10-2 glaucomatous field loss is needed, particularly when considering the substantial burden that routine incorporation of the test would place on patients, providers, and payers. Accordingly, this study was designed to simultaneously investigate numerous features of 10-2 glaucomatous field loss, including its frequency within a typical clinical sample, its correspondence with 24-2 field loss, its associations with relevant structural parameters, and its severity characteristics. By advancing knowledge about the nature of 10-2 glaucomatous field loss, determination of the relative value and optimal clinical implementation of the 10-2 test should then be facilitated.
Methods
This study adhered to the tenets of the Declaration of Helsinki, conformed to HIPAA regulations, and was approved by the Albuquerque VA Medical Center Institutional Review Board. All subjects for this observational investigation were participating in a prospective, ongoing, longitudinal glaucoma research study at the Albuquerque VA Medical Center, and each provided informed consent prior to study participation. General enrollment criteria included: age ≥40 years; open, normal angles in each eye on gonioscopy; no corneal or scleral pathologic conditions that could affect intraocular pressure (IOP) or visual field measurement; refractive error ≤5 diopters and astigmatism ≤3 diopters; no prior refractive, corneal, or incisional glaucoma surgery (although routine, uncomplicated cataract surgery at least 6 months prior to visual field testing was allowed); no secondary glaucoma diagnoses; and no visual field loss owing to nonglaucomatous pathology (including media, retinal, optic nerve, or visual pathway disorders).
For this investigation, all eyes were required to have best-corrected distance visual acuity of at least 20/25 (Snellen). We excluded eyes with any amount of posterior subcapsular cataract, as well as any eye with cataract exceeding grade 2 nuclear sclerosis or cortical cataract as defined by the LOCS III criteria. We also excluded eyes with evidence of definite macular disease (eg, drusen, pigment disruption, edema, partial- or full-thickness hole, epiretinal membrane, vitreomacular traction), whether detected with dilated funduscopy or with spectral-domain optical coherence tomography (SDOCT; Spectralis; Heidelberg Engineering, Heidelberg, Germany).
All subjects for this investigation were required to have a diagnosis of primary open-angle glaucoma (POAG), ocular hypertension (OH), or glaucoma suspect (GS). Diagnostic criteria for POAG included clinical findings consistent with glaucomatous optic neuropathy (eg, thinning, excavation, rim erosion, or notch of the neuroretinal rim) in conjunction with glaucomatous visual field loss that was reproducible on 1 or more consecutive 24-2 examinations. Minimum criteria for 24-2 glaucomatous field loss included glaucoma hemifield test result outside normal limits and/or the presence of at least 3 contiguous test points on the pattern deviation (PD) plot at P < 1% and at least 1 at P < .5%, not including points on the edge of the field. IOP was not used as a diagnostic criterion for POAG. Diagnostic criteria for OH included IOP ≥22 mm Hg on at least 1 occasion but without definitive structural damage and without repeatable 24-2 visual field loss. Subjects with GS were required to have all IOP measurements <22 mm Hg, no repeatable 24-2 visual field loss, and an optic nerve appearance that was suspicious for glaucoma.
Study Protocol
Within the longitudinal study protocol, standard automated perimetry (SAP) and SDOCT imaging were acquired at 6-month intervals. For this investigation, we only included subjects in whom good-quality visual field tests and SDOCT scans were acquired within 6 months of each other. With SDOCT, we acquired standard 3.4-mm circumpapillary retinal nerve fiber layer (RNFL) scans in both eyes of each subject, and images with poor centration, segmentation errors, and scan quality <15 were excluded. We recorded global RNFL thickness values and documented all sectors that exceeded the 5% and 1% normative database limits. We also obtained SDOCT macular scans for each eye using the posterior pole asymmetry analysis protocol. Post image acquisition, each of the 61 raster scans were reviewed by one of the authors and segmentation errors were manually repaired. We also aligned the scans along the fovea/disc axis so that accurate estimates of superior and inferior macular thickness (MT) could be obtained. We excluded MT scans if image signal prevented accurate boundary detection for the basement membrane or internal limiting membrane in more than 5 scans; if asymmetry maps had linear defects owing to missing data, and/or if significant retinal or vitreoretinal pathology was evident on any of the raster scans including epiretinal membrane, vitreomacular traction syndrome, macular edema, macular hole, or retinal pigment epithelium irregularity.
Visual Field Testing
SAP was performed at each visit using the Humphrey Visual Field Analyzer II (Carl Zeiss Meditec, Dublin, California, USA). Prior to 2012, the achromatic 24-2 SITA-standard program was performed at each research clinic visit; but beginning in 2012, the achromatic 10-2 SITA-fast program was added to the study protocol, and the 24-2 and 10-2 patterns were subsequently alternated. Although we used different SITA algorithms for the 10-2 and 24-2 patterns, this was not expected to meaningfully impact the study results. For all visual field testing, we used optimal near-point correction, adding +3.00 or +3.25 diopter sphere (depending on trial lens availability) over the patient’s distance subjective refractive error. All visual field tests were required to meet reliability criteria (false positives <15%; false negatives <20%; fixation losses <33% unless gaze tracking demonstrated steady fixation). For statistical analysis, we calculated average values for mean defect (MD) and pattern standard deviation (PSD) from the 2 most recent field tests in an effort to reduce the effects of intervisit variability. Visual field index (VFI) rate was recorded if the subject had at least 5 consecutive good-quality 24-2 visual field examinations.
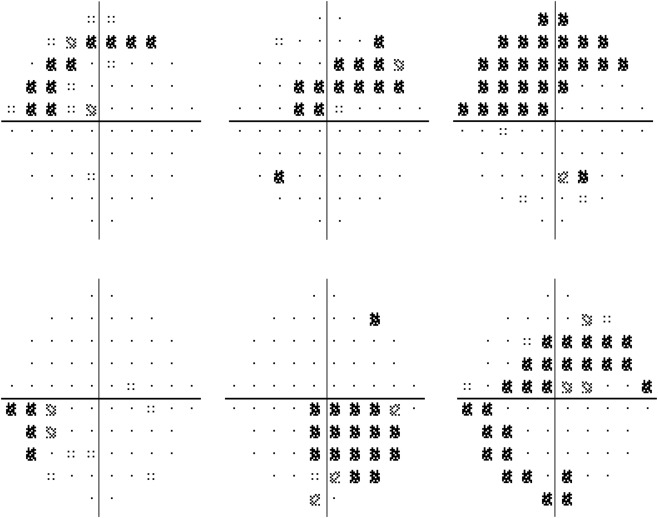
We used previously published cluster criteria to identify the presence of 10-2 visual field loss. Specifically, a 10-2 visual field defect was defined as a repeatable cluster of at least 3 contiguous abnormal points in the superior or inferior hemifield with at least 1 of the 3 points exceeding the 1% threshold or at least 2 of the points exceeding the 2% threshold. Thus, 10-2 visual field loss required an abnormal hemifield cluster that had 3 or more contiguous abnormal points flagged at either the 5%, 5%, and 1% level or the 5%, 2%, and 2% level. Although prior studies have applied these criteria to both the total deviation (TD) and pattern deviation (PD) plots, we only used the PD plot in this study in an effort to reduce false-positive results related to diffuse visual field loss from nonglaucomatous etiologies. We also required that all 10-2 field defects were reproducible on 1 or more consecutive tests. We assessed the pattern of 10-2 defect with the following definitions: if all abnormal, repeatable cluster points were limited to 1 quadrant, the pattern was considered a nasal or temporal defect; if repeatable cluster points were present on both sides of the vertical hemifield midline, the pattern was considered an arcuate defect unless the only defects on the opposite side were limited to the points directly adjacent to the midline, in which case the defect was considered a nasal or temporal defect. Figure 1 shows examples of 10-2 visual field defects identified in this study.
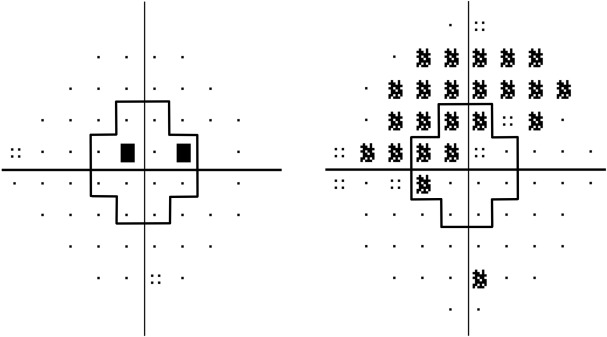
We used Hodapp-Anderson-Parrish criteria to stage 24-2 visual field loss so that we could quantify the frequency and severity of 10-2 defects based on degree of 24-2 field loss. We also recorded the number of abnormal 24-2 points within 10 degrees of fixation to evaluate spatial relationships between central regions of the 24-2 and 10-2 field tests. Further, we recorded the number of abnormal 10-2 points within 5 degrees of fixation to examine fixation threat based on hemispheric defect location. Figure 2 shows the location of the central visual field points on the 24-2 and 10-2 patterns that were used for analyses in this study.
We assessed congruity between 10-2 and 24-2 tests by defining positive correspondence as either absence of field loss on both tests or visual field defect in the same location on both tests. To be considered co-located, location of the 10-2 cluster had to reside in the same quadrant as 1 or more repeatable points (at the <0.5% level) within the central 10 degrees on the 24-2 field test. We also assessed congruity between 10-2 field tests and OCT-RNFL thickness, with positive correspondence requiring agreement between RNFL sector abnormality location (flagged at either the P < .05 or P < .01 level) and location of 10-2 defect or normal RNFL thickness when 10-2 field loss was absent. Finally, based on our prior work, we evaluated the congruity between 10-2 field loss and MT parameters, defining abnormal hemifield MT as ≤265 μm and abnormal hemifield MT asymmetry as >9 μm between the superior and inferior hemifield. Thus, positive correspondence required 10-2 visual field loss in the setting of hemifield MT ≤265 μm or MT asymmetry >9 μm or absence of 10-2 field loss in the setting of hemifield MT >265 μm or MT asymmetry ≤9 μm.
Statistical Analysis
Parametric and nonparametric tests were employed to compare parameters between diagnostic groups depending on the normality of the parameter distributions. Specifically, 1-way analysis of variance and Student t tests were used in normally distributed variables while Kruskal-Wallis and χ 2 tests were used to compare non-normally distributed variables. Student-Newman-Keuls testing for post hoc comparison between groups was employed as needed. When multiple statistical comparisons of similar data were evaluated, Bonferroni correction was calculated and employed. Univariate and multivariate mixed-model linear regression analyses were used to investigate relationships between various structural and functional parameters. Statistical significance was defined as P < .05, and all statistical analyses were performed using MedCalc (Version 12.4.0.0; MedCalc, Ostend, Belgium), Microsoft Excel 2007 (Microsoft, Redmond, Washington, USA), and SAS (Version 9.2; SAS Institute Inc, Cary, North Carolina, USA).
Results
Westudied 354 eyes of 180 subjects with the following diagnoses: POAG (n = 97), OH (n = 54), and GS (n = 29). Descriptive characteristics stratified by diagnosis are shown in Table 1 . Repeatable 10-2 visual field loss was identified in 89 of 180 subjects (49%), with 64 showing 10-2 defects in 1 eye and 25 showing 10-2 defects in both eyes. Of the 89 subjects with 10-2 field loss, corresponding clinical diagnoses were POAG (n = 84), OH (n = 4), and GS (n = 1).
| POAG (n = 97) | OH (n = 54) Mean (SD) | GS (n = 29) Mean (SD) | P Value a | |
|---|---|---|---|---|
| Age (y), mean (SD) | 66.8 (7.9) | 64.4 (6.3) | 66.4 (8.8) | .07 |
| Race, n (%) | .34 | |||
| White | 50 (52) | 27 (50) | 9 (31) | |
| Hispanic | 37 (38) | 21 (39) | 17 (59) | |
| Black | 7 (7) | 5 (9) | 1 (3) | |
| Native American | 3 (3) | 1 (2) | 2 (7) | |
| Sex, n (%) | .60 | |||
| Male | 92 (95) | 53 (98) | 28 (97) | |
| Female | 5 (5) | 1 (2) | 1 (3) | |
| IOP (mm Hg), mean (SD) | ||||
| OD | 15.4 (3.8) | 18.8 (3.2) | 14.0 (3.6) | <.001 b |
| OS | 15.2 (3.2) | 18.6 (3.1) | 13.5 (2.4) | <.001 b |
| CCT (μm), mean (SD) | ||||
| OD | 544.0 (36.1) | 562.3 (32.7) | 541.6 (29.0) | .01 |
| OS | 545.7 (33.7) | 561.6 (35.2) | 542.9 (33.5) | .03 |
| MD 24-2 (dB), mean (SD) | ||||
| OD | −3.76 (4.93) | 0.39 (0.90) | 0.37 (0.98) | <.001 c |
| OS | −3.48 (4.50) | −0.08 (0.95) | −0.13 (1.21) | <.001 c |
| PSD 24-2 (dB), mean (SD) | ||||
| OD | 4.59 (3.67) | 1.65 (0.32) | 1.69 (0.35) | <.001 d |
| OS | 3.86 (2.85) | 1.68 (0.39) | 1.88 (0.55) | <.001 d |
| VFI rate (%/year), mean (SD) | ||||
| OD | −0.67 (1.37) | 0.01 (0.19) | −0.05 (0.21) | <.001 c |
| OS | −0.62 (1.16) | 0.01 (0.21) | −0.10 (0.29) | <.001 c |
| MD 10-2 (dB), mean (SD) | ||||
| OD | −3.61 (5.36) | 0.05 (0.94) | 0.13 (1.03) | <.001 c |
| OS | −2.99 (4.15) | −0.06 (0.99) | −0.04 (0.86) | <.001 c |
| PSD 10-2 (dB), mean (SD) | ||||
| OD | 4.13 (4.42) | 1.19 (0.23) | 1.24 (0.25) | <.001 d |
| OS | 3.22 (3.60) | 1.19 (0.16) | 1.20 (0.18) | <.001 d |
| Global RNFL (μm), mean (SD) | ||||
| OD | 70.5 (13.9) | 89.5 (10.4) | 92.1 (9.7) | <.001 c |
| OS | 69.9 (14.1) | 90.0 (9.9) | 87.8 (11.6) | <.001 c |
| Total MT (μm), mean (SD) | ||||
| OD | 269.7 (14.2) | 281.1 (13.1) | 283.8 (14.0) | <.001 c |
| OS | 268.9 (16.0) | 281.2 (13.1) | 281.9 (13.8) | <.001 c |
| MT asymmetry (μm), mean (SD) | ||||
| OD | 9.0 (7.8) | 4.0 (3.1) | 4.0 (3.3) | <.001 d |
| OS | 8.1 (6.9) | 3.7 (3.1) | 5.3 (4.2) | <.001 d |
a One-way analysis of variance, Kruskal-Wallis, or χ 2 test; significance with Bonferroni correction: P < .004.
When using eye as the unit of analysis, 114 of 354 eyes (32%) exhibited 10-2 field loss and 118 eyes (33%) exhibited 24-2 field loss. Concurrent 24-2 and 10-2 defects were present in 99 eyes, while 15 of 114 eyes (13%) exhibited 10-2 field loss without 24-2 field loss and 19 of 118 eyes (16%) exhibited 24-2 field loss without 10-2 field loss. Furthermore, in the 99 eyes with field defects on both tests, location of the defect corresponded in 97 eyes (98%), though there were 16 eyes in which both superior and inferior defects were present on 1 test (either 24-2 or 10-2) but only 1 hemisphere was involved on the other test. Additional details regarding correspondence of 10-2 and 24-2 visual field loss presence and location are shown in Table 2 .
| 10-2 Visual Field Loss Location | 24-2 Visual Field Loss Location | ||||
|---|---|---|---|---|---|
| None | Superior | Inferior | Superior and Inferior | Total | |
| None | 221 | 5 | 14 | 0 | 240 |
| Superior | 8 | 31 | 0 | 7 | 46 |
| Inferior | 7 | 2 | 35 | 2 | 46 |
| Superior and Inferior | 0 | 1 | 6 | 15 | 22 |
| Total | 236 | 39 | 55 | 24 | 354 |
Prevalence of 10-2 visual field loss was strongly correlated with category of 24-2 visual field loss, as eyes with no, mild, moderate, and advanced 24-2 visual field loss exhibited 10-2 visual field defects in 6% (15/236), 73% (49/67), 96% (25/26), and 100% (25/25) of eyes, respectively. Additionally, the number of abnormal points within the central 10 degrees of the 24-2 test increased as 24-2 visual field loss worsened, as shown in Table 3 . Overall, 109 eyes exhibited repeated, abnormal points within the central 10 degrees on 24-2 testing, and 93 (85%) of these eyes had a corresponding 10-2 visual field defect. This left 21 of 114 eyes (18%) with a 10-2 visual field defect in which there were no abnormal 24-2 points within the central 10 degrees. When considering only the innermost 4 points on the 24-2 test, 56 eyes demonstrated repeatable abnormalities, with 53 (95%) of these eyes exhibiting a 10-2 visual field defect, suggesting that a reproducible 10-2 visual field defect is highly likely when 1 or more of the central 4 points on the 24-2 visual field test is abnormal. When considering severity of 10-2 visual field defect in relationship to the central points on the 24-2 visual field test, 10-2 visual field loss was mild when there were no abnormal central points on the 24-2 test (mean defect = −1.10 ± 1.67; pattern standard defect = 1.54 ± 0.25), while eyes with any abnormal 24-2 points within the central 10 degrees (mean defect = −6.02 ± 5.38; pattern standard defect = 6.07 ± 4.59) and any abnormalities of the innermost 4 points (mean defect = −7.18 ± 6.10; pattern standard defect = 7.17 ± 4.92) showed more substantial loss on the 10-2 visual field test.
| Category of 24-2 Visual Field Loss | N | Number of Eyes (%) With 10-2 Visual Field Defect | Different ( P < .05) From Factor a | Mean (SD) Number of Abnormal 24-2 Points Within 10 Degrees of Fixation | Different ( P < .05) From Factor a |
|---|---|---|---|---|---|
| None (1) | 236 | 15 (6.4%) | (2) (3) (4) | 0.13 (0.60) | (2) (3) (4) |
| Mild (2) | 67 | 49 (73.1%) | (1) (3) (4) | 1.60 (1.46) | (1) (3) (4) |
| Moderate (3) | 26 | 25 (96.2%) | (1) (2) | 2.96 (2.29) | (1) (2) (4) |
| Advanced (4) | 25 | 25 (100%) | (1) (2) | 5.84 (2.30) | (1) (2) (3) |
Location of 10-2 field loss was equally distributed in this study, with 46 superior, 46 inferior, and 22 combined superior and inferior 10-2 field defects, as shown in Table 4 . Severity of 10-2 field loss, however, differed according to defect location. Specifically, eyes with combined superior and inferior defects had greater 10-2 MD and PSD than did eyes with either superior or inferior defects, while eyes with isolated superior defects had greater 10-2 MD and PSD than did eyes with isolated inferior defects ( Table 4 ). Moreover, there were more abnormal 10-2 points within 5 degrees of fixation in superior vs inferior 10-2 defects (2.2 vs 1.2 points, P < .001). Additionally, in eyes with both superior and inferior 10-2 defects, mean sensitivity was lower in the superior vs inferior hemifield in 14 of 22 eyes (64%). In terms of pattern of 10-2 field defect, 90 hemifields (66.2%) demonstrated an arcuate defect, 40 (29.4%) demonstrated a nasal defect, and 6 (4.4%) demonstrated a temporal defect.
| Location of 10-2 Visual Field Loss | N | 10-2 Mean Defect | Different ( P < .05) From Factor a | Mean Number (SD) of Abnormal 10-2 Points Within 5 Degrees of Fixation | Different ( P < .05) From Factor a |
|---|---|---|---|---|---|
| None (1) | 240 | −0.16 (1.17) | (2) (3) (4) | 0.02 (0.19) | (2) (3) (4) |
| Superior (2) | 46 | −4.77 (5.09) | (1) (3) (4) | 2.11 (2.24) | (1) (3) (4) |
| Inferior (3) | 46 | −3.10 (2.97) | (1) (2) (4) | 1.07 (1.37) | (1) (2) (4) |
| Superior and Inferior (4) | 22 | −10.84 (6.48) | (1) (2) (3) | 3.77 (2.31) | (1) (2) (3) |
Stay updated, free articles. Join our Telegram channel

Full access? Get Clinical Tree


