Purpose
To report preoperative prognostic factors associated with visual acuity recovery 1 year after combined cataract and idiopathic epiretinal membrane (ERM) surgery and to introduce a predictive score.
Design
Interventional case series and estimation of a predictive score.
Methods
One hundred forty-two patients (1 eye per patient) operated on for combined cataract and idiopathic ERM in the University Hospital of Dijon were followed for 12 months. Preoperative clinical features and spectral-domain optical coherence tomography (OCT) parameters were compared between eyes that recovered ≥20/20 final best-corrected visual acuity (BCVA) and those with <20/20 final BCVA. Multivariate analysis and predictive score were provided.
Results
At 12 months, 60 eyes (42%) recovered ≥20/20 BCVA and 82 (58%) had lower visual results. Logistic regression analysis showed that final BCVA was associated with age ( P = .040), duration of symptoms ( P = .025), initial BCVA ( P = .002), and inner and outer segment (IS/OS) junction disruption on spectral-domain OCT ( P = .010). The preoperative 10-point predictive score including these parameters reached 82% sensitivity and 66% specificity. With a score >5, patients had a ≥56% chance of recovering 20/20 final BCVA instead of ≤27% when the score was ≤5.
Conclusions
Age, duration of symptoms, and initial BCVA appear to be reliable prognostic factors in patients undergoing combined cataract and idiopathic ERM surgery. Combining these factors with analysis of the IS/OS junction provides a predictive score to estimate individual chances of good visual outcome.
Idiopathic epiretinal membranes (ERMs) are avascular fibrous layers affixed along the surface of the macula. They are principally the consequence of physiological posterior vitreous detachment and therefore mainly affect patients beyond the fifth decade. Based on color fundus photography, studies report a prevalence ranging from 6% to 19% in elderly people. Moreover, their real frequency is probably underestimated, since the new spectral-domain optical coherence tomography (SD OCT) devices provide better detection capability.
More than two thirds of ERMs are nonprogressive, but in some cases expansion and further retraction lead to tangential tractions with a variable amount of macular distortion and thickening. Although only 2% are responsible for visual acuity below 20/200, visual disturbances even with preserved distance acuity impact these patients’ quality of life (QOL). Several authors have investigated the relationship between functional disturbances and SD OCT findings in various retinal diseases including ERM. It appears that integrity of external retinal layers and foveal thickness are closely correlated with visual parameters.
Since the first 6 cases of successful ERM removal were reported by Machemer in 1978, the surgical procedure has steadily improved. ERM peeling is now an efficient, safe, and standardized technique with good anatomic and functional outcomes for at least 75% of patients and visual improvement that extends up to 1 year. Since cataract arises in most phakic patients within 2 years after ERM removal, it has been demonstrated that the combination of these 2 procedures allows equivalent outcomes to consecutive surgery with lower costs and fewer constraints. Nevertheless, in some cases and despite successful peeling without complications, functional outcome may be disappointing. It is therefore necessary to identify preoperative prognostic factors for good postoperative visual recovery. Some clinical factors have long been known, notably preoperative visual acuity and duration of visual impairment. Recent publications have suggested that preoperative SD OCT findings such as foveal thickness and integrity of the photoreceptor (PR) layers may also be reliable prognostic factors.
The purpose of this study was to determine the clinical and anatomic preoperative factors associated with complete visual recovery (20/20 or more) 1 year after a combined cataract and idiopathic ERM surgery in a large retrospective cohort. Secondly, we designed a preoperative predictive score for full visual recovery.
Methods
Population
This retrospective interventional case series study reviewed 279 consecutive eyes that underwent combined cataract and ERM surgery between April 1, 2009 and September 28, 2012 at the Dijon University Hospital, Dijon, France. All patients signed informed consent for the surgical procedure. The protocol was in accordance with the tenets of the Declaration of Helsinki. Owing to its retrospective design, the local institutional review board (Comité de Protection des Personnes, région Est) ruled that approval was not required for this study. Patients were excluded if they presented any cause of secondary ERM (including diabetic retinopathy, vein occlusion, ocular inflammation, retinal detachment, or previously vitrectomized eye), high myopia (axial length ≥26 mm or spherical equivalent ≥6 diopters), severe media opacities with weak SD OCT signal strengths, or any macular or optic nerve disease. Patients with a follow-up of less than 12 months were excluded and only 1 eye was included in those with bilateral ERM.
Clinical Assessments
Data concerning age, sex, and duration of symptoms were gathered from the patients’ preoperative charts. A complete ophthalmologic examination was performed before and at 1, 6, and 12 months after the surgery, including best-corrected visual acuity (BCVA) with Snellen charts converted into the logarithm of the minimal angle of resolution (logMAR), slit-lamp biomicroscopy, indirect fundus, and macular SD OCT.
Optical Coherence Tomography Parameters
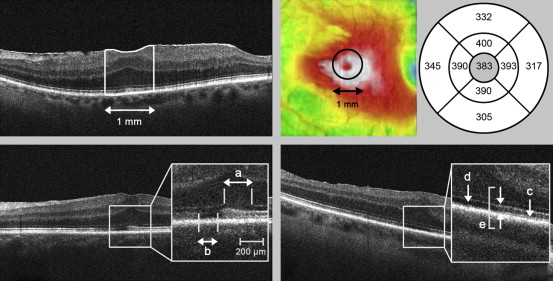
Grayscale SD OCT scans were obtained using a Cirrus high-definition device (Carl Zeiss Meditec AG, Jena, Germany). The acquisition protocol covered a 6 × 6 × 2-mm macular volume composed of 1 native vertical and 128 horizontal B-scans, each composed of 512 axial A-scans. A signal strength greater than or equal to 5/10 was required and data were analyzed using the inbuilt Cirrus software version 6.5. Images were reviewed by 2 independent readers (Y.K., J.C.R.), who were not aware of the patients’ visual outcomes. In the event of discordant readings, the case was discussed to determine the most appropriate interpretation. Figure 1 describes SD OCT parameters used for statistical analysis and Supplemental Figure 1 (Supplemental Material available at AJO.com ) displays examples of abnormal preoperative findings. Macular volume was automatically segmented by the software with delineation of internal limiting membrane (ILM) and retinal pigment epithelium (RPE), allowing reliable retinal thickness assessment. We evaluated mean foveolar thickness (MFT) as the mean distance between the ILM and the RPE in the central 1-mm area automatically provided by the software. To assess the level of impairment of the PR layer, we studied 4 SD OCT parameters: the outer limiting membrane (OLM); the inner and outer segment (IS/OS) junction; the Verhoeff membrane, also called the cone outer segment tip (COST) line; and the PR outer segment (PROS) length. Further qualitative SD OCT parameters were assessed (foveolar profile, macular wrinkling, retinal hyporeflective inner plexiform cysts, foveal bulge along the IS/OS, vitreomacular traction, foveal herniation, macular pseudohole, and lamellar pseudohole).
Surgical Procedure
All patients underwent a combined cataract and ERM surgery owing to visual impairment or disabling metamorphopsia. A 23 or 25 gauge 3-port pars plana core vitrectomy was performed. The ERM and ILM were peeled using a microforceps over an area covering 4–6 mm centered on the fovea. ILM dye was used at the surgeon’s discretion (Brilliant Peel; Fluoron GmbH, Ulm, Germany, or ILM-Blue; DORC, Zuidland, the Netherlands). Cataract surgery was performed by phacoemulsification (Stellaris PC system; Bausch & Lomb, Rochester, New York, USA) with a 3-piece intraocular lens (Acrysof MA 50 BM; Alcon Surgical, Inc, Fort Worth, Texas, USA), either before or after the vitrectomy.
Statistical Analysis
Patients were split into 2 groups according to their postoperative BCVA 12 months after the surgery. The first group was composed of those with optimal visual recovery (≥20/20) and the second group comprised patients with a poorer visual outcome (<20/20). Statistical analysis was performed using STATA/SE 10.0 (StataCorp LP, College Station, Texas, USA). Since some of the variables did not meet the assumptions necessary for parametric statistical tests, the comparisons were carried out with the Mann-Whitney, Wilcoxon matched-pairs signed rank, χ 2 , or Fisher exact tests. Further Spearman rank correlation coefficients with their associated linear curve fits were provided. A multivariate analysis was conducted with the BCVA group set as the dependent variable in a logistic regression model of the potential prognosis factors (namely age, duration of symptoms, initial BCVA, MFT, and IS/OS disruption score). Finally, the preoperative predictive score was built by analyzing a multivariate multiple regression model of independent prognostic factors converted into binary variables, with the final BCVA group set as the dependent variable. Several analyses were performed to determine the most appropriate thresholds for each factor, taking into account its median (age, duration of symptoms, and IS/OS disruption score) or the final visual outcomes in the subgroups of the preliminary analysis (initial BCVA). In the final model, each regression coefficient was weighted relative to the least of them to obtain a 10-point score. Further specificity, sensitivity, and the receiver operating characteristic (ROC) curve were calculated to determine the most accurate cutoff for this overall score. All these analyses were 2-tailed and the significance threshold was fixed at .05.
Results
Of the 279 eyes that were operated on, 142 eyes of 142 patients were included for the statistical analysis ( Figure 2 ). Among those that were excluded, 53 had missing data, mostly because of further follow-up outside the Dijon University Hospital.
Surgical Outcomes
The mean preoperative BCVA was 0.39 ± 0.20 logMAR (Snellen equivalent, 20/49) and improved to 0.11 ± 0.18 logMAR (Snellen equivalent 20/26) at 12 months ( P < .001). Mean final BCVA gain was 2.8 ± 2.0 logMAR lines. One hundred thirty-five patients (95%) showed improved visual acuity and 95 (67%) gained more than 2 lines. The baseline and final characteristics of the study population are displayed in the Supplemental Table (Supplemental Material available at AJO.com ). Supplemental Figure 2 (Supplemental Material available at AJO.com ) shows the BCVA and MFT time course. Sixty patients (42%) recovered ≥20/20 final BCVA and were included in Group 1. Eighty-two patients (58%) achieved <20/20 final BCVA and were included in Group 2. Supplemental Figure 3 (Supplemental Material available at AJO.com ) displays examples of SD OCT follow-up for 1 patient in each group.
Preoperative Factors Associated With Good Visual Recovery, Univariate Analysis
The comparison between baseline characteristics in Groups 1 and 2 is displayed in Table 1 . Supplemental Figure 4 (Supplemental Material available at AJO.com ) shows correlations and linear curve fittings for the final BCVA and the 12-month BCVA gain depending on preoperative BCVA, duration of symptoms, and initial MFT.
| Baseline Characteristics | Group (M12 BCVA ≥20/20) N = 60 | Group 2 (M12 BCVA <20/20) N = 82 | P Value |
|---|---|---|---|
| Age (y) | |||
| Mean ± SD | 73.4 ± 6.6 | 76.5 ± 7.3 | .016 a |
| Sex | |||
| Male, n (%) | 24 (40) | 37 (45) | .608 b |
| Female, n (%) | 36 (60) | 45 (55) | |
| Duration of symptoms (mo) | |||
| Mean ± SD | 10.4 ± 9.3 | 16.6 ± 17.5 | .003 a |
| Baseline BCVA (logMAR) | |||
| Mean ± SD | 0.32 ± 0.14 | 0.45 ± 0.21 | <.001 a |
| Baseline mean foveolar thickness (μm) | |||
| Mean ± SD | 452 ± 72 | 439 ± 85 | .277 a |
| Baseline photoreceptor layer status | |||
| OLM disruption, n (%) | |||
| DS 0 | 36 (60) | 32 (39) | .032 c |
| DS 1 and 2 | 18 (30) | 42 (51) | |
| DS 3 and 4 | 6 (10) | 8 (10) | |
| IS/OS disruption, n (%) | |||
| DS 0 | 37 (62) | 31 (38) | .003 c |
| DS 1 and 2 | 22 (36) | 39 (47) | |
| DS 3 and 4 | 1 (2) | 12 (15) | |
| COST hyporeflectivity, n (%) | 33 (55) | 45 (55) | .999 b |
| PROS length (μm, mean ± SD) | 45.9 ± 9.0 | 45.0 ± 8.0 | .686 a |
| Baseline SD OCT qualitative parameters | |||
| Foveolar profile, n (%) | |||
| Normal | 0 (0) | 0 (0) | .196 c |
| Flattened | 14 (23) | 12 (15) | |
| Lost | 46 (77) | 70 (85) | |
| Foveolar wrinkling, n (%) | |||
| Unruffled | 1 (2) | 9 (11) | .033 c |
| Surface wrinkling | 26 (43) | 23 (28) | |
| Full-thickness folds | 33 (55) | 50 (61) | |
| Foveal cysts, n (%) | |||
| No cysts | 42 (70) | 54 (66) | .618 c |
| Microcysts | 10 (17) | 12 (15) | |
| Macrocysts | 8 (13) | 16 (19) | |
| Foveal bulge, n (%) | 22 (37) | 22 (27) | .271 b |
| Foveal herniation, n (%) | 3 (5) | 3 (4) | .697 b |
| Macular pseudohole, n (%) | 12 (20) | 16 (27) | .999 b |
| Vitreomacular traction, n (%) | 4 (7) | 9 (11) | .558 b |
| Lamellar pseudohole, n (%) | 8 (13) | 12 (15) | .999 b |
| Laser capsulotomy before 12 months | |||
| Capsulotomy, n (%) | 5 (8) | 17 (21) | .060 b |
Preoperative Factors Associated With Good Visual Recovery, Multivariate Analysis
Table 2 shows the logistic regression of age, duration of symptoms, initial BCVA, MFT, and the IS/OS disruption score with the BCVA group set as the dependent variable. The OLM disruption score was excluded from this analysis because of collinearity with the IS/OS score. Hyporeflectivity of the COST line and PROS lengths were not included because they were not related to the final BCVA group in the univariate analysis. The odds ratio of reaching a ≥20/20 final BCVA decreased with age and duration of symptoms and increased with baseline BCVA ( P = .040, P = .025, and P = .002, respectively). As for SD OCT parameters, the odds ratio of having a ≥20/20 final BCVA decreased in case of high IS/OS disruption scores ( P = .010). The odds ratio for the MFT was not significant ( P = .137).
| Odds Ratio (Final BCVA ≥20/20 Group vs Final BCVA <20/20 Group) | 95% Confidence Interval | P Value | |
|---|---|---|---|
| Age | |||
| Odds ratio | 1.067 | 1.003–1.135 | .040 |
| Duration of symptoms | |||
| Odds ratio | 1.045 | 1.006–1.087 | .025 |
| Initial BCVA | |||
| Odds ratio | 27.51 | 3.286–230.3 | .002 |
| Preoperative mean foveolar thickness | |||
| Odds ratio | 0.996 | 0.991–1.001 | .137 |
| Preoperative IS/OS disruption score | |||
| DS 1-2 vs DS 0, odds ratio | 1.839 | 0.808–4.185 | .010 |
| DS 3-4 vs DS 0, odds ratio | 15.86 | 2.501–100.6 |
Predictive Score
Table 3 presents the predictive score for ≥20/20 visual recovery elaborated using the independent prognostic factors identified in the multivariate analysis. It included 4 parameters (age, duration of symptoms, initial BCVA, and IS/OS disruption) with a weighted number of points assigned, resulting in a 10-point score. Supplemental Figure 5 (Supplemental Material available at AJO.com ) shows the ROC curve built to determine the most appropriate cutoff score. With a threshold of 5, the score reached 82% sensitivity and 66% specificity. Taking this cutoff into account, 73% of our patients were accurately classified and we obtained a 2.39 positive likelihood ratio and a 0.28 negative likelihood ratio. Patients with a score >5 therefore had more than a 56% chance of reaching 20/20 postoperative visual acuity, while those with ≤5 had a less than 27% chance. It was also possible to calculate a final 20/20 probability for each final predictive score ( Table 4 ).
| Prognostic Factors | Weight |
|---|---|
| Age (y) | |
| ≥75 | 0 |
| <75 | 2 |
| Duration of symptoms (mo) | |
| ≥12 | 0 |
| <12 | 2 |
| Preoperative BCVA (Snellen) | |
| <20/100 | 0 |
| ≥20/100 and <20/33 | 2 |
| ≥20/33 | 5 |
| IS/OS line (SD OCT) | |
| Disrupted or irregular | 0 |
| Continuous | 1 |
Stay updated, free articles. Join our Telegram channel

Full access? Get Clinical Tree


