Purpose
To evaluate the predictability of visual function and peripapillary nerve fiber layer thickness by cross-sectional areas of extraocular muscles in patients with Graves ophthalmopathy.
Design
Interventional case series.
Methods
The data on a total of 76 patients with Graves ophthalmopathy were collected, and the cross-sectional areas of 4 rectus muscles were calculated using computed tomographic images. This study measured the correlation between the cross-sectional area of all rectus muscles and the Hertel value, logarithm of the minimal angle of resolution (logMAR), mean deviation of retinal sensitivity, P 100 value of visual evoked potential, total error of the Farnsworth-Munsell 100-hue color sensation test, and total thickness of the peripapillary nerve fiber layer thickness by optical coherence tomography.
Results
The cross-sectional area of all rectus muscles was significantly correlated with the mean deviation of retinal sensitivity ( P c = .08), the P 100 value of visual evoked potential ( Pc < .01), and the total error of the 100-hue color sensation test ( P c < .01). However, the cross-sectional area of all rectus muscles was not significantly correlated with logMAR or proptosis, nor with the total thickness of the peripapillary nerve fiber layer.
Conclusions
For patients with Graves ophthalmopathy, the cross-sectional area of all rectus muscles was significantly correlated with visual function. The enlargement of extraocular muscles can be an early sign of optic neuropathy prior to perceived clinical symptoms. Furthermore, it is possible to predict visual function change using the cross-sectional area of all rectus muscles.
Graves ophthalmopathy, a disorder of autoimmune activity against orbital fibroblasts and adipocytes, is characterized by edema and inflammation of the extraocular muscles and an increase in orbital connective tissue and fat. The edema is attributable to the hydrophilic action of glycosaminoglycans secreted by fibroblasts within the connective tissues investing and separating the muscle fibers. The mass effect further causes venous obstruction and congestion. The inflammation is attributable to infiltration of the extraocular muscles and orbital connective tissues by lymphocytes and macrophages. The muscle cells are normal until the late stages of ophthalmopathy, when they may become atrophic or fibrotic.
Most individuals with Graves ophthalmopathy have evidence of both extraocular muscle and orbital adipose tissue involvement. However, some patients appear to have either extraocular muscle enlargement or orbital fat proliferation. Individuals younger than 40 years of age are considerably more likely to exhibit orbital fat expansion in the absence of muscle enlargement, whereas patients over 70 year old are more prone to suffer from severe, fusiform muscle enlargement without significant changes in orbital adipose tissue volume.
The clinical symptoms and signs of Graves ophthalmopathy can be explained mechanically by the discrepancy between the increased volume of the swollen orbital tissues and the fixed volume of the bony orbit. Swelling of the extraocular muscles at the apex of the orbit and lack of forward mobility of orbital contents because of tight attachment of connective tissue to the orbital walls cause compressive optic neuropathy and visual loss. In some cases, the malady can be caused by optic nerve stretching without a crowded apex. There still are some cases of dysthyroid optic neuropathy with progressive visual field loss, but with normal-sized or minimally enlarged extraocular muscles. Although many patients with Graves disease have no clinical evidence of ophthalmopathy, the use of sensitive imaging techniques, such as orbital ultrasonography, computed tomography (CT), and magnetic resonance imaging (MRI), provides evidence of ocular involvement in most of these patients.
In this study, we correlated maximal cross-sectional area of the 4 rectus muscles on to visual functions, such as visual acuity, visual evoked potential, visual field, color sensation, and peripapillary nerve fiber layer thickness in patients with Graves myopathy. We hope that evaluation of CT images may yield early signs of optic neuropathy to allow for early treatment.
Materials and Methods
From January 3, 2006 TO May 30, 2007, we collected data on a total of 76 patients (151 eyes) with Graves restrictive myopathy who were evaluated in the thyroid eye disease clinic at National Taiwan University Hospital. The inclusion criterion of the patients was Graves ophthalmopathy with eye movement restriction in any 1 of 4 primary directions. The duration of the Graves ophthalmopathy at the time of the study was within 6 months. Patients were excluded from the study if they had previously received any steroids, immunosuppressive therapy, radiotherapy, or surgical decompression. Other exclusion criteria included previous optic nerve damage, any systemic diseases (eg, diabetes mellitus, hypertension) that could lead to optic nerve dysfunction, coexisting retinal diseases and uveitis, corneal abnormalities, and media opacity. The Ethics Committee of National Taiwan University Hospital approved the protocol of this study. Ophthalmic examinations included slit-lamp biomicroscopy, best-corrected visual acuity, Hertel exophthalmometry, optical coherence tomography (OCT) for peripapillary nerve fiber layer thickness, visual field examination for retinal sensitivity loss, Farnsworth-Munsell 100-hue color sensation test, and visual evoked potential. Orbital CT scans with 2-mm section cuts were obtained in all cases at approximately the same time.
All visual field examinations were performed with the Humphrey automated field analyzer program 30-2, which tests for retinal sensitivity within 30 degrees from the fixation point. Optical coherence tomography (Stratus OCT; Carl Zeiss Meditec, Inc., Dublin, California, USA) (software version 4.0) was employed to measure the retinal nerve fiber layer thickness of the peripapillary area, and the disc rim thicknesses from the superior, nasal, and inferior to temporal portion were recorded respectively. OCT measures the echo time delay and intensity of backscattered light from microstructures of retinal tissue with a resolution of approximately 10 μm. The color sensation test with Farnsworth-Munsell 100-hue is 1 available test for optic nerve function. The scale, which consists of “total error,” shows the severity of optic nerve dysfunction. We recorded the P 100 value of visual evoked potential for evaluation of visual transduction latency. We also converted the best-corrected visual acuity to a logarithm of minimal angle of resolution (logMAR) for further statistical calculation.
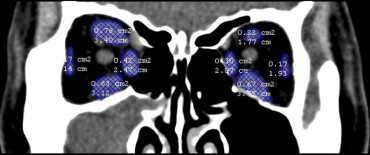
Cross-sectional areas of the 4 rectus muscles (superior rectus, medial rectus, inferior rectus, and lateral rectus muscle) were measured on coronal CT images with soft tissue windows. We chose 3 continuous slices of CT images with the largest cross-sectional area of the 4 rectus muscles. The areas of the 4 rectus muscles of each CT image slice were determined by marking the margin of the rectus muscle and having it automatically calculated by Mirror DPS software (Canfield Clinical Systems, Fairfield, New Jersey, USA) ( Figure 1 ). The cross-sectional area of each rectus muscle was determined by the average value of 3 continuous slices of cross-sectional areas. The cross-sectional area of all 4 rectus muscles was determined by the sum of 4 cross-sectional areas of each rectus muscle. Using the same method, we also measured the cross-sectional area of orbit on the same CT images for the rectus muscles. The ratio between the cross-sectional area of rectus muscles and the orbital area was calculated.
Statistical analysis was carried out using the Statistical Package for Social Sciences (version 11.0, SPSS Inc, Chicago, Illinois, USA). Pearson correlation was used when correlating 2 independent sets of variables. Two-sided P values were corrected for multiple tests using the Bonferroni method. All P values are reported as corrected P values ( P c), and P cs smaller than .1 were considered statistically significant. Linear regression formula was employed after obtaining the significant Pearson correlation results.
Results
All of the 76 patients included inthe study were Asian. The mean age was 46.7 years (range, 22 to 79 years); 30 patients (39%) were male and 46 patients (61%) were female. Among the 76 patients, the best-corrected visual acuity ranged from 20/200 to 20/12.5. The average logMAR visual acuity was 0.27 ± 0.88. The mean Hertel value was 19.4 mm, ranging from 12 mm to 26 mm. The average mean deviation in retinal sensitivity was -4.8 ± 4.44 dB (range, -0.15 to -27.5 dB). The average P 100 value of visual evoked potential was 103.7 ± 10.0 (range, 89.5 to 142). The mean total error of the Farnsworth-Munsell 100-hue color sensation test was 160.6 ± 165.9 (range, 4 to 988) ( Table 1 ).
| Variable | Average | Range |
|---|---|---|
| Age (years) | 46.7 | 22 to 79 |
| LogMAR visual acuity | 0.27 ± 0.88 | −0.3 to 0.8 |
| Hertel value (mm) | 19.4 ± 2.54 | 12 to 26 |
| Mean deviation in retinal sensitivity (dB) | −4.8 ± 4.44 | −0.15 to −27.5 |
| P 100 value | 103.7 ± 10.0 | 89.5 to 142 |
| Total error of 100-hue color sensation | 160.6 ± 165.9 | 4 to 988 |
There were no significant correlations between the cross-sectional area of each extraocular rectus muscle and the related quadrant of the peripapillary nerve fiber layer thickness in Graves ophthalmopathy ( Table 2 ).
| ON-S | ON-N | ON-I | ON-T | ON | |
|---|---|---|---|---|---|
| IR-A | .072 | −.039 | .113 | −.064 | .018 |
| MR-A | .166 | .108 | .186 | −.059 | .118 |
| SR-A | .060 | .035 | .014 | −.109 | .007 |
| LR-A | .163 | .085 | .144 | .007 | .128 |
| EOM-A | .149 | .057 | .153 | −.075 | .086 |
As for the correlation between the cross-sectional area of the 4 rectus muscles and different visual function parameters, the cross-sectional area of all rectus muscles was significantly correlated with the mean deviation of retinal sensitivity ( P c = .08, Figure 2 ), the P 100 value of visual evoked potential ( P c < .01, Figure 3 ), and the total error of the 100-hue color sensation test ( P c < .01, Figure 4 ). However, the cross-sectional area of all rectus muscles was not significantly correlated with logMAR visual acuity ( P c = .34) or proptosis, nor with the total thickness of the peripapillary nerve fiber layer thickness measured by optical coherence tomography (OCT) ( Table 3 ).
| EOM-A | M/O Ratio | ON | logMAR | MD | P 100 | Total Error | Hertel Value | |
|---|---|---|---|---|---|---|---|---|
| EOM-A | 1.000 | 0.927 a | .086 | .197 | −.241 a | .496 a | .346 a | .147 |
| M/O ratio | 1.000 | .089 | .352 | −.418 a | .482 a | .459 a | .155 | |
| ON | 1.000 | .024 | .007 | −.055 | −.056 | .153 | ||
| logMAR | 1.000 | −.517 a | .278 a | .331 a | .075 | |||
| MD | 1.000 | −.342 a | −.347 a | .011 | ||||
| P 100 | 1.000 | .363 a | −.126 | |||||
| Total error | 1.000 | −.045 | ||||||
| Hertel value | 1.000 |
Stay updated, free articles. Join our Telegram channel

Full access? Get Clinical Tree


