Purpose
To examine the relationship between rate of vascular change and plus disease diagnosis.
Design
Retrospective observational case-control study.
Methods
Wide-angle images were taken bilaterally from 37 infants at 31 to 33 weeks and 35 to 37 weeks postmenstrual age (PMA). The semi-automated Retinal Image multiScale Analysis system was used to measure parameters for all arteries and veins: integrated curvature, diameter, and tortuosity index. A reference standard diagnosis (plus vs not plus) was defined for each eye by consensus of 5 experts at 35 to 37 weeks PMA. Weekly rate of change in parameters was compared in eyes with plus vs not plus disease. Receiver operating characteristic area under the curve (AUC) was calculated for plus disease detection based on 1) weekly rates of parameter change between 31 to 33 weeks and 35 to 37 weeks PMA and 2) parameter values at 35 to 37 weeks only.
Results
Weekly rates of change in all venous parameters were significantly different in eyes with plus vs not plus disease, particularly for tortuosity index ( P < .0004) and diameter ( P = .018). Using weekly rate of change, AUC for plus disease detection was highest for venous tortuosity index (0.819) and venous diameter (0.712). Using the 35 to 37-week PMA image only, AUC was highest for venous integrated curvature (0.952) and diameter (0.789).
Conclusion
Rate of change in venous, but not arterial, parameters is correlated with plus disease development in this data set. This did not appear to contribute information beyond analysis of an image at 35 to 37 weeks PMA only.
Retinopathy of Prematurity (ROP) is characterized by abnormal retinal vasoproliferation in low birth weight infants and is a leading cause of childhood blindness worldwide. The multicenter Cryotherapy for ROP (CRYO-ROP) and Early Treatment for ROP (ETROP) studies demonstrated the benefits of appropriate detection and treatment. Published consensus guidelines state that all infants with birth weight <1500 grams or gestational age ≤30 weeks require screening examination for ROP.
“Plus disease” was described by the international classification of ROP as a component of severe disease, and is defined as venous dilation and arterial tortuosity greater than that of a published photograph that was selected by expert consensus. The CRYO-ROP and ETROP studies showed that presence of plus disease is a necessary component of threshold disease and a sufficient component of type-1 ROP, both of which have been found to benefit from treatment with laser photocoagulation or cryotherapy. However, previous studies have shown that there may be significant variability in plus disease diagnosis among different experts and that computer-based image analysis systems that quantify vascular features have potential to perform comparably to or better than experts in plus disease diagnosis. This suggests that there may be advantages of quantitative, objective methods for plus disease diagnosis.
The standard photographic definition of plus disease depicts vascular appearance at a single point in time. However, vascular abnormalities actually evolve over time. Previous studies have found that faster change in vessel appearance may be a prognostic indicator of worse disease outcome and more rapid progression toward treatment-requiring disease. The revised international classification of ROP created a new “pre-plus” designation to account for the fact that vascular dilation and tortuosity occur over a range of levels. However, little previous work, to our knowledge, has examined the value of analyzing the rate of vascular change over time in clinical diagnosis of plus disease.
The purpose of this pilot study was to examine the feasibility of quantitative plus disease diagnosis based on analysis of the rate of vascular change over time compared to analysis at a single point in time. Posterior retinal images were interpreted by a group of ROP experts to develop a reference standard (“plus” vs “not plus”) diagnosis, and a computer-based image analysis system was used to measure quantitative vascular features.
Design and Methods
Source of Data
Wide-angle images of the posterior retina were captured bilaterally from 37 infants during routine ROP care using a commercially available device (RetCam-II, Clarity Medical Systems, Pleasanton, California, USA). Images were captured from each infant at 2 sessions: the first between 31 and 33 weeks postmenstrual age (PMA), and the second between 35 and 37 weeks PMA. Eyes with good-quality posterior pole images at both sessions were included in the study.
Image Interpretation: Experts
Five recognized ROP experts interpreted images. All experts had either been a principal investigator or certified investigator in the CRYO-ROP or ETROP studies, or had co-authored at least 3 peer-reviewed manuscripts involving ROP. Experts designated each image as “plus” or “not plus.” Each image was given a final diagnosis based on the response given by the majority of experts.
Image Interpretation: Computer-Based System
Retinal vessels in each of the 148 images were analyzed using a computer-based system, Retinal Image multiScale Analysis (RISA), using previously described methods. This system defines 3 parameters to quantify the degree of vascular thickness and nonlinearity: diameter, tortuosity index, and integrated curvature. This computer-based system operates by constructing 1-pixel skeletons of the selected vessel and then calculating geometric properties. Diameter is defined as total area of the vessel, divided by its length. Tortuosity index is the length of the vessel divided by the length of the straight line connecting the start and end points of the vessel. Integrated curvature is defined as the sum of the angles along the skeleton, normalized by the length of the vessel.
Data Analysis
Values for the computer-based image analysis parameters were calculated separately for all vessels present in both the first and second sessions in each eye. Average arterial and venous values were calculated for each parameter: arterial diameter, arterial tortuosity index, arterial integrated curvature, venous diameter, venous tortuosity index, and venous integrated curvature. Rate of vascular change between the first and second sessions in each eye was calculated in 2 ways: 1) as the change per week in the single vessel in each eye with the highest change between the 2 sessions for each computer-based system parameter, and 2) as the mean change per week in computer-based system parameters for all vessels present in images from both sessions.
Receiver operating characteristic areas under the curve (AUC) were calculated for use of the computer-based system to detect plus disease. This was performed by plotting sensitivity vs (1 – specificity) compared to the reference standard, while varying hypothetical cut-off thresholds separating “plus” from “not plus.” This was done by considering all individual computer-based system parameters separately at the first session, all individual computer-based system parameters separately at the second session, change per week in the vessel with highest change between sessions for each parameter, and mean change per week in all vessels present in images from both first and second sessions. P values were computed to test the hypothesis that diagnostic performance of the computer-based system was better than chance (ie, AUC = 0.5).
Results
Characteristics of Data
Retinal images from 37 infants were captured bilaterally during a first session at 31 to 33 weeks PMA and a second session at 35 to 37 weeks PMA. This resulted in a total of 148 images (37 infants × 2 eyes × 2 sessions). Mean gestational age of infants was 26 weeks, and mean birth weight was 787 grams.
Image Interpretation: Experts
All 148 images were interpreted by 5 experts and given a reference standard diagnosis of “plus” or “not plus” based on the response provided by the majority of experts ( Table 1 ). Thirteen of the 148 images (8.8%) were given a reference standard diagnosis of “plus” based on expert consensus. All images with a reference standard diagnosis of “plus” were from the second session at 35 to 37 weeks PMA.
| Expert | 31-33 Weeks | 35-37 Weeks | Total | |||
|---|---|---|---|---|---|---|
| Plus | Not Plus | Plus | Not Plus | Plus | Not Plus | |
| 1 | 0/74 (0%) | 74/74 (100%) | 17/74 (23%) | 57/74 (77%) | 17/148 (11%) | 131/148 (89%) |
| 2 | 0/74 (0%) | 74/74 (100%) | 24/74 (32%) | 50/74 (68%) | 24/148 (16%) | 124/148 (84%) |
| 3 | 0/74 (0%) | 74/74 (100%) | 7/74 (9%) | 67/74 (91%) | 7/148 (5%) | 141/148 (95%) |
| 4 | 0/74 (0%) | 74/74 (100%) | 4/74 (5%) | 70/74 (95%) | 4/148 (3%) | 144/148 (97%) |
| 5 | 0/74 (0%) | 74/74 (100%) | 16/74 (22%) | 58/74 (78%) | 16/148 (11%) | 132/148 (89%) |
a Posterior retinal images of both eyes of 37 premature infants were taken at first session between 31 and 33 weeks postmenstrual age (PMA), and at a second session between 35 and 37 weeks PMA. Images were interpreted by 5 experts and given a diagnosis of “plus” vs “not plus.”
Image Interpretation: Computer-Based System
All 148 images were analyzed for the 6 individual computer-based system parameters (arterial diameter, arterial tortuosity index, arterial integrated curvature, venous diameter, venous tortuosity index, and venous integrated curvature). A total of 463 arteries (mean 3.13 arteries/image) and 513 veins (mean 3.47 veins/image) were analyzed, for a total of 976 analyzed vessels. This resulted in a total of 1389 (= 463 × 3) system responses for arteries (diameter, tortuosity index, integrated curvature) and 1539 (= 513 × 3) system responses for veins. Eighty-five of the 976 vessels (8.7%) could not be analyzed by the computer-based system because of inadequate image quality.
Computer-Based Plus Disease Diagnosis
Table 2 summarizes accuracy of computer-based plus disease diagnosis using image analysis from a single session (35 to 37 weeks PMA), compared to the rate of vascular change between 2 sessions (31 to 33 weeks and 35 to 37 weeks PMA). Receiver operating characteristic curves for plus disease diagnosis using individual computer-based image parameters from a single session (35 to 37 weeks PMA) are displayed in Figure 1 . Using data from the second session only, receiver operating characteristic AUCs for plus disease detection were statistically better than chance performance ( P < .05), for all vessel parameters except arterial diameter ( P = .08). Among individual parameters at a single session, diagnostic performance was highest for venous integrated curvature (AUC = 0.952, P < .001) and venous diameter (AUC = 0.789, P = .001).
| Arteries | Veins | |||||||||||
|---|---|---|---|---|---|---|---|---|---|---|---|---|
| Single Session (35-37 Weeks PMA) | Highest Vessel Change/Week | Mean Vessel Change/Week | Single Session (35-37 Weeks PMA) | Highest Vessel Change/Week | Mean Vessel Change/Week | |||||||
| AUC (95% CI) | P Value | AUC (95% CI) | P Value | AUC (95% CI) | P Value | AUC (95% CI) | P Value | AUC (95% CI) | P Value | AUC (95% CI) | P Value | |
| Diameter | 0.760 (0.599–0.922) | N/S | 0.610 (0.416–0.804) | N/S | 0.594 (0.390–0.799) | N/S | 0.789 (0.666–0.911) | .001 | 0.712 (0.512–0.912) | .018 | 0.617 (0.419–0.815) | N/S |
| TI | 0.708 (0.599–0.922) | .039 | 0.580 (0.395–0.765) | N/S | 0.554 (0.370–0.738) | N/S | 0.734 (0.559–0.909) | .009 | 0.819 (0.668–0.970) | <.001 | 0.802 (0.646–0.958) | .001 |
| IC | 0.726 (0.564–0.889) | .024 | 0.530 (0.345–0.715) | N/S | 0.498 (0.316–0.680) | N/S | 0.952 (0.890–1.013) | <.001 | 0.697 (0.489–0.905) | .029 | 0.642 (0.412–0.873) | N/S |
a Single session was at 35 to 37 weeks postmenstrual age. Rate of change was between 31 to 33 weeks postmenstrual age and 35 to 37 weeks postmenstrual age.
b Wide-angle posterior retinal images were captured bilaterally from 37 infants at 2 sessions, the first at 31-33 weeks PMA and the second at 35-37 weeks PMA, and computer-based system parameters (diameter, TI, and IC) were calculated from arteries and veins separately. Rate of vascular change between the 2 sessions was calculated in 2 ways: 1) as change per week in the single vessel in each eye found to have undergone highest change between sessions (“highest vessel change/week”); and 2) as mean change per week in all vessels present in images from both sessions (“mean vessel change/week”).
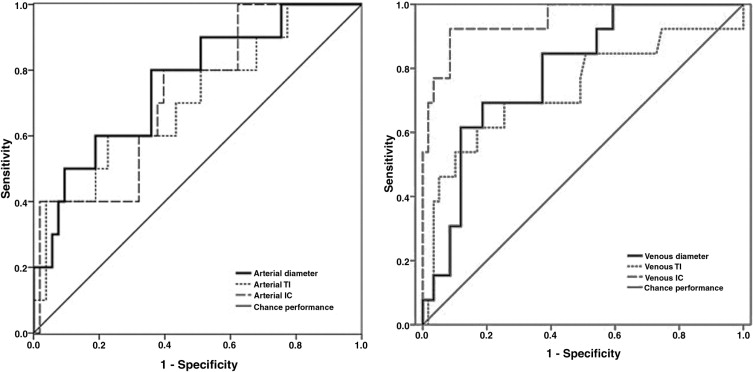
Examples of images showing different rates of vascular change are shown in Figure 2 . Receiver operating characteristic curves for plus disease diagnosis based on rate of vascular change between the 2 sessions (31 to 33 weeks and 35 to 37 weeks PMA) are displayed in Figure 3 using the single vessel in each eye found to undergo greatest change between the 2 sessions. Using this method for analysis of rate of vascular change, diagnostic performance was highest for venous tortuosity index (AUC = 0.819, P = .000376) and venous diameter (AUC = 0.712, P = .018). Receiver operating characteristic curves for plus disease diagnosis based on the rate of vascular change between the 2 sessions are displayed in Figure 4 using the mean rate of change among all vessels present in images at both sessions for each eye. Using this method for analysis of rate of vascular change, diagnostic performance was statistically better than chance performance only for venous tortuosity index (AUC = 0.802, P = .001).


