Purpose
To quantify the area of photoreceptor damage surrounding geographic atrophy (GA) and evaluate the relationship between structural abnormalities and retinal function in eyes with GA.
Design
Prospective cross-sectional study.
Methods
Twenty-five eyes of 25 patients with GA associated with age-related macular degeneration underwent a full ophthalmologic examination, including spectral-domain optical coherence tomography (SDOCT), fundus autofluorescence (FAF), and microperimetry. ImageJ software was used to quantify the disruption of the ellipsoid zone on SDOCT images. Hypofluorescent areas of the FAF images indicated areas of retinal pigment epithelium (RPE) loss. Areas of interest graded by SDOCT (photoreceptor damage) and FAF (RPE loss) were registered with microperimetry within a 6-mm circle centered on the fovea.
Results
The mean area of photoreceptor damage was 7.69 ± 5.36 mm 2 , which was significantly greater than the mean area of RPE loss (4.57 ± 4.07 mm 2 , P < .001). The average retinal sensitivity of the area with photoreceptor damage outside the area of RPE loss was lower than that of the area without photoreceptor damage (6.57 ± 4.13 dB vs 11.27 ± 3.78 dB, P < .001). The area of photoreceptor damage surrounding the area of RPE loss was larger in eyes with pseudodrusen than in eyes without pseudodrusen (4.96 mm 2 vs 1.91 mm 2 , P = .008). The only significant predictor of decreased retinal sensitivity was the area of the photoreceptor damage ( P < .001).
Conclusions
Widespread photoreceptor damage surrounding sites of RPE loss occurred in eyes with GA, and it correlated with visual function. Evaluation of photoreceptor damage surrounding sites of RPE loss using OCT is important in patients with GA associated with AMD.
Age-related macular degeneration (AMD) is a major cause of blindness in developed countries, particularly in people older than 60 years. AMD manifests in 2 forms, neovascular AMD and nonneovascular or dry AMD. Geographic atrophy (GA) represents the end stage of dry AMD, and is characterized by the loss of retinal photoreceptors, retinal pigment epithelium (RPE), and choriocapillaris. GA pathophysiology remains unclear, partly because of its multifactorial etiology. Biochemical, histologic, and genetic studies have implicated several mechanisms, such as oxidative damage, chronic inflammation, excessive lipofuscin accumulation, and complement system malfunction.
Fundus photographs and fundus autofluorescence (FAF) are standard approaches for diagnosing and monitoring GA. On fundus photographs, GA is detected as a sharply delineated area of hypopigmentation, depigmentation, or apparent absence of the RPE, resulting in clearly visible choroidal vessels. On FAF, GA exhibits sharply demarcated hypofluorescent areas, owing to the atrophy of the RPE and thus the loss of fluorophores. These 2 modalities are useful for evaluating RPE loss, and historically GA has been attributed to RPE loss. However, using spectral-domain optical coherence tomography (SDOCT), Fleckenstein and associates noted an ellipsoid zone (EZ) that terminated distal to the RPE beyond the edge of the GA in some patients with dry AMD, indicating that photoreceptor cell death may occur earlier than the loss of RPE cells. In 2014, Bird and associates described the novel observation of a marked loss of photoreceptor cells at variable distances distal from the edge of the GA. This observation indicates that photoreceptor loss may occur in areas with an RPE monolayer. In addition, it is known that retinal sensitivity is reduced beyond the borders of GA. Thus, the relationship between photoreceptors and RPE in eyes with GA has not been well understood, and warrants further investigation.
The purpose of this study was to quantify the areas of photoreceptor and RPE loss, and evaluate the relationship between structural abnormalities and retinal function in eyes with GA associated with dry AMD. To understand the manifestation of GA, we investigated GA using a combination of 3 imaging modalities: FAF, SDOCT, and microperimetry (MP). These 3 modalities allowed us to quantitatively evaluate the status of RPE and photoreceptor cells in vivo and assess their relationship with visual function.
Methods
This study was conducted in accordance with the tenets of the Declaration of Helsinki. This study was approved prospectively by the Institutional Review Board and the Ethics Committee of Kyoto University Graduate School of Medicine. Written informed consent was obtained from all patients. They are registered under the Cohort Study of the Clinical Course of Macular Diseases in Japanese Patients ( ClinicalTrials.gov identifier: NCT02081339 ).
Participants
For this prospective cross-sectional study, we recruited consecutive patients with GA associated with dry AMD who visited the Kyoto University Hospital between March 6, 2014 and February 5, 2015. All patients had been previously diagnosed with GA associated with dry AMD by experienced retinal specialists. We excluded eyes with RPE atrophy secondary to neovascular AMD, idiopathic choroidal neovascularization, angioid streaks, high myopia (axial length ≥26.5 mm), other types of secondary choroidal neovascularization (CNV), central serous chorioretinopathy, hereditary macular dystrophy, uveitis, trauma, and any history or sign of retinal surgery, including laser treatment. We also excluded eyes with coexistent ocular abnormality that would cause decreased visual function, such as significant cataracts greater than NO2, NC2, C2, or P2 in the Lens Opacities Classification System III; epiretinal membrane; diabetic retinopathy; and glaucoma. If both eyes were eligible for the study, 1 eye with better best-corrected visual acuity (BCVA) was selected. Pseudodrusen were diagnosed using multimodal imaging modalities including color fundus photography, FAF, infrared reflectance (IR), and SDOCT.
Multimodal Imaging Methods
All patients underwent a comprehensive ophthalmologic examination, including BCVA measurement, intraocular pressure determination, indirect ophthalmoscopy, slit-lamp biomicroscopy with a noncontact lens, axial length measurement (IOLMaster 500; Carl Zeiss Meditec, Dublin, California, USA), color fundus photography, FAF, IR, SDOCT, and MP during the same visit.
Color fundus photographs (field, 40 degrees) were obtained digitally using a Topcon TRC NW6S nonmydriatic retinal camera (Topcon, Tokyo, Japan) after medical dilation of the pupil (phenylephrine, 0.5% and tropicamide, 0.5%). The FAF images were acquired using a confocal scanning laser ophthalmoscope (SLO) (HRA2; Heidelberg Engineering, Heidelberg, Germany), with an excitation wavelength of 488 nm and with a barrier filter beginning at 500 nm. The field of view was set to 30 × 30 degrees, centered on the fovea. IR and SDOCT imaging were conducted simultaneously using a Spectralis HRA + OCT (Heidelberg Engineering). The IR images were obtained at a wavelength of 820 nm, and the field of view was set to 30 × 30 degrees, centered on the fovea. The SDOCT images were acquired with 49 horizontal raster scans covering a 20 × 30-degree oblong rectangle, averaging 24 scans for each image to reduce speckle noise.
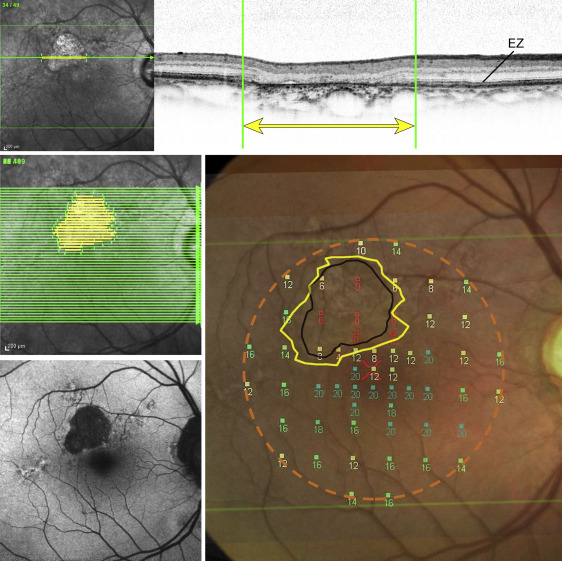
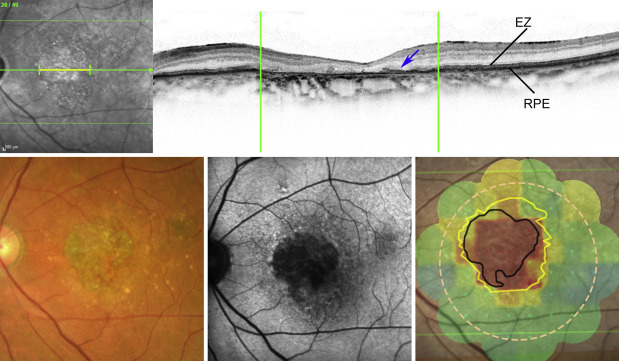
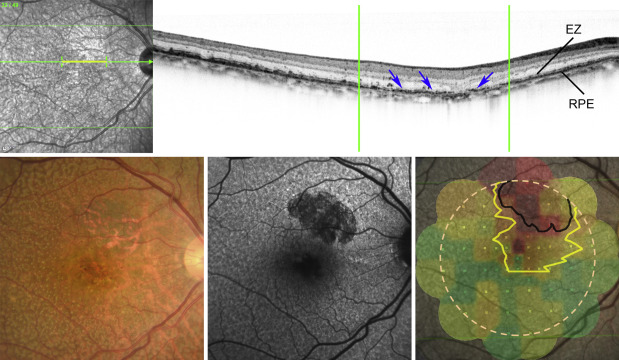
ImageJ software (National Institutes of Health, Bethesda, Maryland, USA) was used to objectively quantify the extent of the disruptions of the EZ band on an SDOCT image. The signal intensity of the EZ band was measured, and the EZ band was quantified using the plot profile function of the ImageJ software. The border of the EZ disruption was defined as the line on the grayscale image along which the EZ reflectivity diminished by 2 standard deviations from the reflectivity of the EZ band in the unaffected retina ( Figure 1 ). A sequence of OCT scans in each data set was examined, and the areas with a disrupted EZ band were identified. As Spectralis HRA + OCT combines the confocal SLO and SDOCT, it allows the integration of information obtained from a SLO fundus image and SDOCT in a pixel-by-pixel manner, thus enabling the determination of the exact sites of the disrupted EZ band regions. An area of interest (ie, the area exhibiting EZ disruption) was defined by manually drawing a line in each B-scan image and projecting it onto the IR image ( Figure 1 ). Each projected image was merged into 1 en face image, and then the area of photoreceptor damage was measured. The hypofluorescent areas on the FAF image were defined as the areas of RPE loss. For images with multiple areas of hypofluorescence, all areas of more than 0.5 mm in the greatest linear diameter were outlined and the measurements were summed and recorded. Areas of interest graded by SDOCT (photoreceptor damage) and FAF (RPE loss) were registered with MP findings within the 6-mm Early Treatment Diabetic Retinopathy Study (ETDRS) sector ( Figures 1–3 ) where major vessels were completely matched.
Microperimetry
Fundus-monitoring MP was used to measure retinal sensitivity. The MP-1 software (NIDEK, Padova, Italy) was set to automatically track eye movements and to evaluate each frame for shifts in the directions of the x and y axes of the fundus, with a reference image obtained by an infrared camera at the beginning of the examination. The 4-2-staircase strategy with Goldmann size III stimuli against a white background with 1.27 cd/m 2 illumination was used to examine 57 stimulus locations covering the central 20 degrees. The differential luminance, defined as the difference between the stimulus luminance and the background luminance, was 127 cd/m 2 at 0 dB stimulation, and the maximum stimulus attenuation was 20 dB. The stimulus duration was 200 ms. If the results of the MP examination were not reliable owing to poor fixation, the eye was excluded from this study.
Statistical Analyses
All statistical evaluations were carried out using SPSS v. 17 (SPSS, Chicago, Illinois, USA). Significance was defined as P < .05. BCVA measured using the Landolt chart was expressed as the logarithm of the minimal angle of resolution (logMAR). The Wilcoxon signed-rank test was used to compare areas of photoreceptor and RPE loss, and average retinal sensitivity with or without photoreceptor or RPE loss. We calculated the Spearman rank correlation coefficient to determine the associations between the mean retinal sensitivity and the area of photoreceptor and RPE loss, and between the distance from the fovea to the nearest area of photoreceptor damage and BCVA. For comparison of GA with and without pseudodrusen, the Mann-Whitney test was used. Multiple regression analysis was performed with age, sex, lens status, axial length, and areas of the regions of photoreceptor and RPE loss as independent factors and average retinal sensitivity as a dependent factor.
Results
Twenty-five eyes of 25 patients (19 men and 6 women) with GA were included in this study. Patient characteristics are shown in Table 1 . The mean age was 80.3 ± 6.7 years (range: 62–89 years). All patients were Japanese. Fourteen eyes were phakic and 11 eyes were pseudophakic. The mean best-corrected visual acuity (logMAR) was 0.48 ± 0.41 (range: −0.18 to 1.22), which is equivalent to 20/50 (range: 20/12 to 20/320) in Snellen visual acuity. The mean axial length was 23.48 ± 1.01 (range: 21.58–24.78 mm).
| Number of eyes | 25 |
| Age (y) | 80.3 ± 6.7 (62–89) |
| Sex (male/female) | 19/6 |
| Race (Japanese/other) | 25/0 |
| Lens status (phakia/IOL) | 14/11 |
| Axial length (mm) | 23.48 ± 1.01 (21.58–24.78) |
| Best-corrected visual acuity (logMAR) | 0.48 ± 0.41 (−0.18 to 1.22) |
| Best-corrected visual acuity (Snellen equivalent) | 20/50 (20/12 to 20/320) |
| Area with photoreceptor damage (mm 2 ) | 7.69 ± 5.36 (0.83–22.32) |
| Area with RPE loss (mm 2 ) | 4.57 ± 4.07 (0.35–14.08) |
| Area with photoreceptor damage outside RPE loss (mm 2 ) | 3.13 ± 3.05 (0.52–15.99) |
| Mean retinal sensitivity of: | |
| Area of all stimulus points (dB) | 8.42 ± 4.24 (0.67–18.98) |
| Area with photoreceptor damage (dB) | 3.28 ± 2.70 (0.00–13.00) |
| Area without photoreceptor damage (dB) | 10.52 ± 4.12 (2.06–19.30) |
| Area with RPE loss (dB) | 1.84 ± 2.68 (0.00–10.00) |
| Area without RPE loss (dB) | 11.27 ± 3.78 (3.54–19.20) |
| Area with hyperautofluorescence surrounding RPE loss (dB) | 7.16 ± 3.77 (0.00–16.00) |
| Area without hyperautofluorescence surrounding RPE loss (dB) | 11.03 ± 3.86 (2.97–19.20) |
| Area with photoreceptor damage outside RPE loss (dB) | 6.57 ± 4.13 (0.00–16.00) |
The mean area with photoreceptor damage was 7.69 ± 5.36 mm 2 , which was significantly greater than the mean area with RPE loss (4.57 ± 4.07 mm 2 , P < .001). The mean area with photoreceptor damage outside the area of RPE loss was 3.13 ± 3.05 mm 2 , which had no correlation with the area of RPE loss ( P = .148). The distance between the fovea and the nearest area of photoreceptor damage negatively correlated with BCVA ( P = .032, r = −0.45).
The areas of RPE loss and photoreceptor damage were negatively correlated with the mean retinal sensitivity of all stimulus points (R = 0.772, P < .001, and R = 0.831, P < .001, respectively). The mean retinal sensitivity of the area with RPE loss was lower than that of the area without RPE loss (1.84 ± 2.68 dB vs 11.27 ± 3.78 dB, P < .001). The mean retinal sensitivity of the area with photoreceptor damage was 3.28 ± 2.70 dB, which was also lower than that of the area without photoreceptor damage, 10.52 ± 4.12 dB ( P < .001). The average retinal sensitivity with hyperautofluorescence surrounding RPE loss was 7.16 ± 3.77 dB, which was lower than that of the area without hyperautofluorescence, 11.03 ± 3.86 dB ( P < .001). Furthermore, the average retinal sensitivity of the area with photoreceptor damage outside the area with RPE loss was worse than that of the area without photoreceptor damage (6.57 ± 4.13 dB vs 11.27 ± 3.78 dB, P < .001) ( Figures 2 and 3 ).
The number of stimulus points with hyperautofluorescence surrounding RPE loss was 116 points out of all 1425 stimulus points in 25 patients. Eighty-one points with hyperautofluorescence out of 116 (69.8%) accompanied photoreceptor damage. On the other hand, the number of stimulus points with photoreceptor damage was 198 points in all patients. Out of 198 points, 81 points (40.9%) accompanied hyperautofluorescence.
Multiple regression analysis revealed that among the possible predictors (age, sex, lens status, axial length, area of photoreceptor damage, and area of RPE loss), the only significant predictor of decreased retinal sensitivity was the area of photoreceptor damage ( P < .001) ( Table 2 ). The area of photoreceptor damage inversely correlated with retinal sensitivity.


